- College of Energy and Electrical Engineering, Hohai University, Nanjing, China
Increasing penetration of wind power with intermittency and variability threatens the stability of the power system frequency. The fast response capability of the energy storage system (ESS) makes it an effective measure to improve frequency regulation performance. However, designing an optimal control for numerous energy storage units (ESUs) with different power and energy characteristics is challenging. To solve the dilemma that the distributed control methods cannot achieve optimality over time horizons while the centralized optimization methods would cause high computational burdens, a bi-layer optimal control approach is proposed in this study. In the upper layer, a multi-area secondary frequency control (SFC) problem is established to determine control policies for ESS clusters under continuous wind power fluctuations and is solved by the Itô theory-based stochastic optimization (ITB-SO) method with high computational efficiency in a rolling-horizon manner. In the lower layer, the power output of ESUs is dispatched and coordinated using the distributed algorithm (DA) method via communication networks, considering different characteristics and the current state-of-charge (SoC) levels. Simulation studies carried out in a dual-region test system evidence the improvement of system frequency stability by compensating for rapid wind power fluctuations immediately via ESSs. The results show that the proposed ITB-SO method without scenario generation is suitable for real-time SFC for the ESS. The effectiveness of the DA method and its robustness in encountering loss of communication links are also verified.
1 Introduction
In the past few decades, the penetration of renewable energy sources (RES) has been increasing rapidly. At the end of 2020, the RES capacity, including wind power and photovoltaic power generation, was 1300GW, accounting for 9.4% of the total installed power generation capacity in the world (Khan et al., 2021). The increasing RES penetration level in the interconnected power grids results in a decrease in the system inertia (Meegahapola and Flynn, 2010). For example, the wind turbine generators are decoupled from the system frequency by converters, so they cannot provide frequency regulation support for a long time (Tsili and Papathanassiou, 2009). Severer frequency fluctuations would happen in the areas with low system inertia than others in the interconnected power systems (Miller et al., 2011). Meanwhile, the intermittency and variability nature of RES power generation would lead to continuous power imbalances and system frequency deviations (Bidram and Davoudi, 2012). Therefore, the increasing integration of RES will inevitably bring challenges to the stability of system frequency.
Exploiting energy storage systems (ESSs) for maintaining frequency stability of the systems with high penetration levels of the RES has recently attracted attention both in industry and academia. In recent years, the application of the ESS is gradually becoming widespread. In 2021, the rated power of installed ESS was 173.7GW, and 1,363 ESS projects were operational globally (U.S.DOE, 2021). The ESS has higher ramping and faster response capability than conventional generators, so better dynamic tracking performance is available for frequency regulation control. Since the traditional automatic generation control (AGC) signal is unsuitable for ESSs with limited energy capacity, filtering mechanisms are developed to extract fast-moving and high-frequency components of the AGC signal for the ESS to participate in SFC (Cheng et al., 2014). Meanwhile, the management of state-of-charge (SoC) for ESS during frequency regulation is important as well. It needs to prevent the second frequency drop issue due to sudden withdrawals of some ESSs. Karrari et al. (2020) propose an SoC recovery mechanism for flywheel ESS so that the residual energy capacity is always in the optimal state. Garcia-Torres et al. (2021) apply the stochastic optimization (SO) method considering the management SoC level and address the prediction uncertainties of RES.
In order to further exploit the complementary advantages of different types of ESSs in terms of rated power and energy capacity, hybrid ESSs are developed and utilized in frequency regulation. The main ESS types, including batteries (Li-ion, Pb-Acid), flywheels, and supercapacitors, possess different power-to-energy ratio characteristics. Jan et al. (2020) used a fuzzy PI controller for ESSs to cater to the frequency variations adaptively. Shim et al. (2018) proposed droop control with the SoC feedback to improve their frequency response and regulation services to the grid. However, the control strategies in these studies are separate and independent, which means different ESSs cannot be coordinated, and hence unnecessary mutual regulation and waste of resources would be caused. Esmaili et al. (2013) decomposed the power signal into fast/slow components to allocate responsibility for hybrid ESSs. Oshnoei et al. (2020) adopted the model predictive control method to determine an ESS control scheme with various characteristics, which is robust to uncertain disturbances. Nevertheless, these centralized ways are sensitive to noise and communication failure (Zhao and Ding, 2018b). On the contrary, the distributed realizations relying on local and neighboring information can reduce computation time and take advantage of local intelligent agents (Anderson et al., 2021).
Distributed methods such as the consensus algorithm are widely used in economic dispatch problems (Li et al., 2019), control for photovoltaic arrays (Zhang et al., 2021) and batteries (Chen C. et al., 2019), etc. Alsharif et al. (2020) applied the distributed algorithm (DA) method coordinating ESS power output to enhance the frequency nadir and improve the dynamic performance. Lee et al. (2016) coordinated the group battery ESS by a distributed control algorithm for voltage and frequency deviation regulation. Cherukuri and Cortes (2018) developed a distributed method for ESSs considering the change of load, but uniform storage efficiency is assumed. However, these studies did not take into account random wind power generation or the influence of ESS control strategies on the frequency of interconnected grids. Zhao and Ding (2018a) present a DA method to maximize the total welfare of battery ESSs during frequency regulation considering changes in wind power. But, it relies on accurate predictions of wind power, which is difficult to accomplish, considering their inherent variability. As a result, the stochastic characteristics of RES should be taken into account when designing accurate control strategies for the ESS.
However, a disadvantage of the distribution methods is that the optimality of power dispatching between ESSs can only be achieved at the current time step, instead of considering the optimal solution over a future finite time horizon. The power output scheme is possibly not adapted to the energy-constrained ESSs when the signal is constantly biased, resulting in storage saturation. It indicates that the ESS can participate in the SFC only if the energy content of the signal is kept low (Megel et al., 2018). So, it is necessary to develop reasonable control strategies to maintain optimal energy levels of ESSs. But, on the other hand, if the power output of all ESSs is decided in a centralized optimization problem over a period, a large scale of variables would lead to computational burdens and intractability, which is unsuitable for real-time SFCs.
In order to fill the abovementioned research gap, a bi-layer SFC framework for the ESS is presented in this article. Different energy storage units (ESUs) in the same area are combined as an ESS cluster to reduce the computational complexities of upper-layer control, and the optimal control policies are updated in a rolling-horizon manner to ensure frequency regulation performance. Then, the ESUs coordinate their power output via communication networks in real-time. Therefore, different from the previous studies, the proposed approach can achieve a balance between the optimization method considering wind power uncertainty and the distribution method with high efficiency. The main contributions of this article are summarized as follows:
1) An upper-layer optimization problem of multi-area frequency regulation considering stochastic wind power fluctuation is established to determine the optimal control policy of ESS clusters. The Itô theory-based stochastic optimization (ITB-SO) method is proposed to efficiently obtain the solutions, in which the wind power uncertainty is modeled by stochastic differential equations (SDE) without scenario generation. The computational burden is significantly reduced so that it is suitable for real-time frequency regulation.
2) To make full use of the local computing capability, a DA method with high efficiency and robustness is applied to dispatching power output among ESUs. The power command can be adaptively decomposed considering the different characteristics of power-type and energy-type units. The evaluation of the SoC level is improved by adopting the logistic function to better reflect the safe and dangerous SoC zones. Sudden withdrawal of ESUs due to energy saturation and violation of power limits can be avoided to guarantee power tracking performance.
The remainder of the article is organized as follows: Section 2 describes the multi-area frequency regulation model considering ESSs and wind power uncertainties. Section 3 proposes an optimal SFC approach for ESS clusters based on the ITB-SO method. Section 4 proposes a power dispatching approach for ESUs in the clusters based on the DA method. Case studies are presented in Section 5. Section 6 gives a conclusion.
2 System model
2.1 Dynamic model of frequency regulation considering the ESS
The system frequency is affected by load and generation sources, including conventional generators and ESSs. Regardless of the power loss, the dynamic frequency response model of multi-areas can be expressed as follows (Mauricio et al., 2009; Li et al., 2016):
where
The wind power output can be considered a negative system load as shown in Eq. (5), which is more difficult to accurately forecast than load. Hence, the continuous wind power fluctuations would pose a threat to the safety and stability of the system frequency.
where
2.2 Energy storage model
Different ESUs are combined into an ESS cluster, so the overall power output and energy level of the ith cluster can be represented by the sum of that of the member ESUs as follows:
where
where
2.3 Model of wind power prediction error
SDE has been widely used as an effective model of RES prediction error, such as wind power (Verdejo et al., 2016) and photovoltaic power (Lingohr and Müller, 2019). The probability distribution information and the temporal correlation characteristic could be simultaneously expressed. It is convenient to fit the non-Gaussian distribution via the Itô process by adopting different functions in SDE models so as to well-reflect the detailed characteristics of RES uncertainty. On the other hand, the SDE model can be embedded into SO problems without scenario generation in order to significantly release computational burdens.
Specifically, the wind power output value consists of the ultra-short-term prediction in a finite time period and the prediction error, which is modeled via the Itô process as follows:
where
2.4 Bi-layer SFC framework for ESS clusters
The optimal SFC for ESS clusters is divided into two control layers. In the upper layer, the convex SO problems are established to decide the optimal power output minimizing the frequency deviation. However, modeling numerous ESUs will result in a large number of decision variables for the optimization problem, which is difficult to solve rapidly. Therefore, optimal control policies for the overall power output of ESS clusters are determined to reduce computational complexities. The ITB-SO method is applied instead of scenario-based methods in order to quickly obtain the optimal solutions for the SFC.
In the lower layer, the total power command is dispatched between the ESUs in the same ESS cluster with a communication network. The optimal dispatching scheme is obtained by the DA method considering the current SoC levels and different characteristics of power-type and energy-type units. In summary, the framework of the bi-layer optimal SFC is shown in Figure 1.
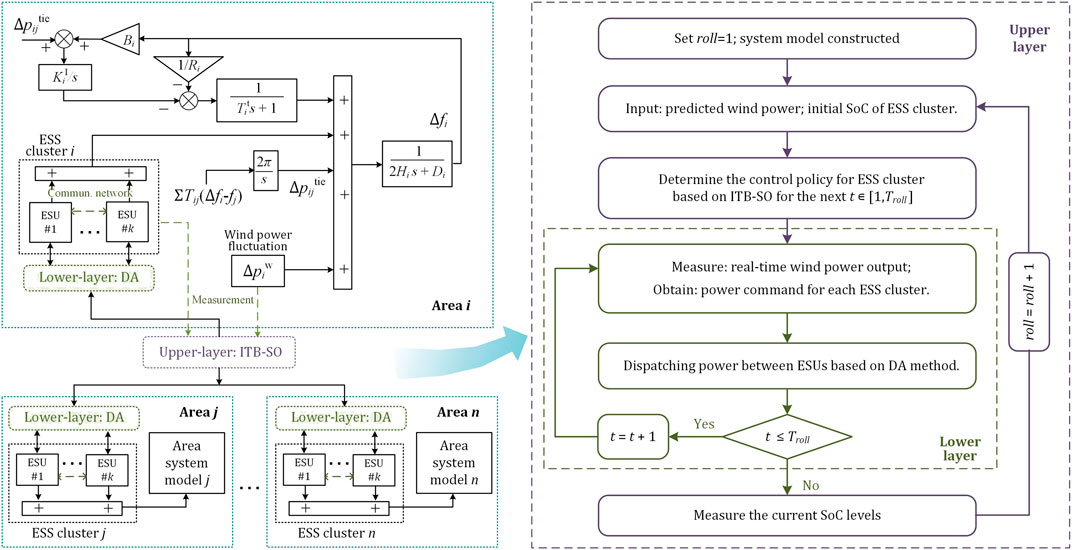
FIGURE 1. Framework of bi-layer secondary frequency control for energy storage clusters in multi-area systems.
3 Optimal SFC of ESSs based on ITB-SO
3.1 Objective function
The frequency regulation control problem to minimize the frequency deviation and operation cost of the ESS can be described as a SO problem over
where
Since different ESUs are combined into an ESS cluster and meet the power command, their overall SoC level can be estimated by
where
It can be seen that the objective function (15) shows the trade-off between frequency regulation performance and the power and energy cost of the ESS. At the terminal time, the SoC level is forced to be close to the reference value by the objective function because it is necessary to maintain the feasibility of the next rolling horizon after the terminal time.
Moreover, the frequency deviation constraint and SoC constraint should be considered, as shown in (19) and (20), to enhance frequency regulation performance and guarantee the operation of the ESS. It is to be noted that constraint (19) could be violated sometimes when ESSs do not have enough power capacity to participate in frequency regulation, and hence it should be removed if the problem is infeasible.
3.2 Itô theory-based stochastic optimization method
3.2.1 Series expansion of stochastic assessment function
To obtain the expected value of the objective function under all uncertainties, an ITB approximation method is adopted to evaluate it in a deterministic way (Chen et al., 2019c) so that the SO problem can be solved efficiently. For convenience, the stochastic system is expressed as (21) considering the stochastic resources
where
The stochastic assessment function (SAF) is defined and denoted as
where
Specifically, the objective function (15) evaluated by SAF at time T can be decomposed into low-order terms as
Given that
where
where
3.2.2 Control policy
The control output of the ESS should be appropriately adjusted in response to different wind power values. However, it is hard to accurately predict wind power so the design of the control strategy is challenging considering unrevealed uncertainties. Disturbance feedback control is needed to address the problem (Skaf and Boyd, 2010). An effective measure is parameterizing the control policies as an affine policy (Chen et al., 2019b; Qiu et al., 2020), which is expressed in (27). The control policy only needs to be updated once in each rolling period, and once
where
where
where
3.2.3 Chance constraint
In the established SO problem, the constraints are classified into equality constraints, including (1)–(6), (18), (28), and (29); and inequality constraints, including (9), (19), and (20). The linear inequality constraints are considered in a probabilistic way as chance constraints, expressed as
where
According to the abovementioned series expansion theory, the variance term can be evaluated by SAF as (32), and a detailed explanation of (31) and (32) can be found in Supplementary Appendix SA.
3.2.4 Convex optimization problem reformulation
The convexity of the SO problem can be guaranteed when the affine feedback policy is adopted, and the optimization problem is formed as a quadratically constrained quadratic programming (QCQP) problem. The trapezoidal rule (Sanchez-Gasca et al., 1995) can be used in the numerical calculation of the integral. To express the chance constraints as a second-order cone constraint form, the coefficient vector
Moreover, the ‘ = ’ in the objective function can be replaced by ‘≥’ to relax and can be rewritten into second-order cone constraints similar to the method in (33). In summary, the overall optimization problem is expressed as
where
4 Power dispatching approach for ESUs based on DA
Once the total power command is given by the upper-layer optimal SFC, different ESUs in the same ESS cluster are required to coordinate with each other to determine their power output and completely meet the command. However, the characteristics of different ESUs are probably inconsistent, including rated power, rated energy capacity, and the current SoC level. Thus, the possible energy saturation and violation of power limits would lead to sudden withdrawals of ESUs, which might influence the frequency regulation effect. Therefore, a DA method is proposed in this section to coordinate the power output of ESUs with communication networks and guarantee the frequency regulation performance.
4.1 Optimization control problem of ESUs
Similar to the cost of conventional generators in economic dispatch (Wen et al., 2018), the virtual cost function of ESUs can be defined as a quadratic function with respect to the power output of the ESU and the current SoC level (Megel et al., 2018) at each time step t as
where
Thus, the optimization control problem of ESUs is to achieve the minimizing objective function (36) under equality constraint (37) and other inequality constraints.
where
In addition, the inequality constraints are twofold: power and energy limits, and power direction constraints, i.e.,
This problem is a quadratic programming problem and can be solved in a centralized way (Yin et al., 2021). However, the local computing capability in a parallel way is not fully used, so the efficiency of solving optimization problems would be reduced. Therefore, the DA needs to be developed.
According to the general process of utilizing distributed methods to solve optimization problems (Wang et al., 2019), the Lagrange function
where
In other words, when all
Specifically, the evaluation function
where
where
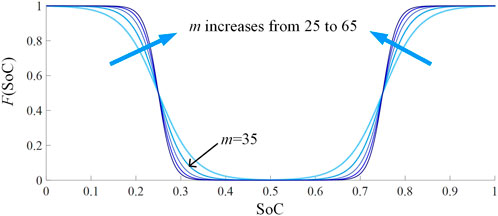
FIGURE 2. Different curves of F (SoC) when the value of the adaptive factor m increases from 25 to 65.
4.2 Discrete consensus algorithm
The main idea of DA is that the agents use a communication network to share information to complete the iterative calculation. The communication network topology can be modeled by a directed or undirected graph denoted by
The agents obtain information from their neighbors through the communication network and update their own information. All agents finally converge to the same value after several iterations. The first-order discrete consensus algorithm can be updated according to (44).
where l is the discrete sequence representing the lth iteration;
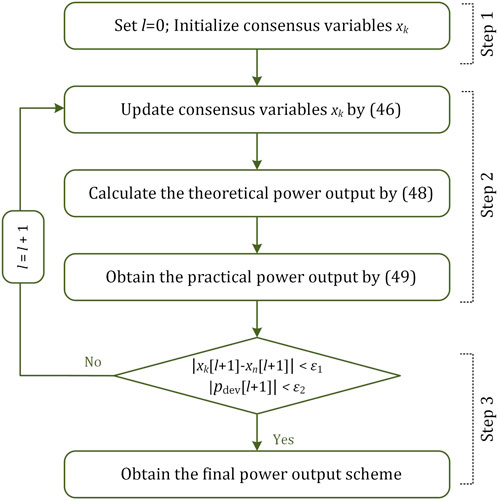
4.3 Control procedure of DA
1) Step 1: Initializing power dispatch and consensus variables.
Set
2) Step 2: Iterative calculation.
The consensus variables are iterated by DA. In order to ensure that the final dispatching scheme can match the total power command, a power correction term is introduced for the leader agent. The update rule is shown as
where
where (49) makes a restriction on the theoretical power output by (48), which is possibly infeasible due to inequality constraints, i.e., power and energy limits and power direction constraints.
Then, the remaining power deviation would be fed back to the consensus variable through the correction term and shared by other neighbors.
3) Step 3: Judging the convergence condition.
First, each ESU agent should reach an agreement with the adjacent agents on their consensus variables. However, complete consensus cannot be achieved for all agents actually, so the approximate condition is implemented as
where
Second, the power deviation is also taken as a factor in the convergence condition as shown in (51). In order to avoid over-iteration,
In summary, the flowchart of the control procedure of the DA method is shown in Figure 3.
5 Case study
5.1 Simulation model setting
The simulations are performed using Matlab software and run on a machine equipped with Intel i7 3.2 GHz CPU and 16 GB RAM. The established optimization problems are solved by the Yalmip toolbox called Gurobi optimizer. The test simulations based on the actual wind power scenario are conducted using the Simulink platform.
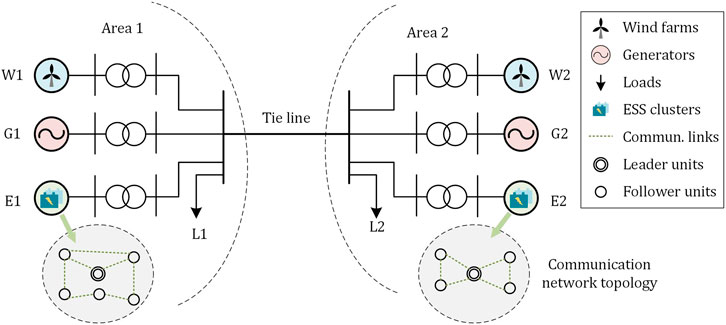
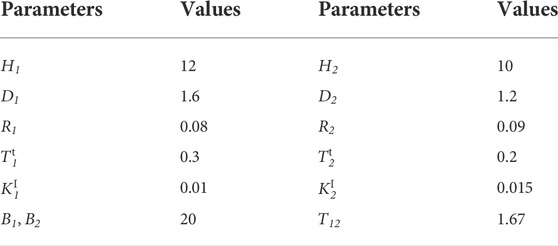
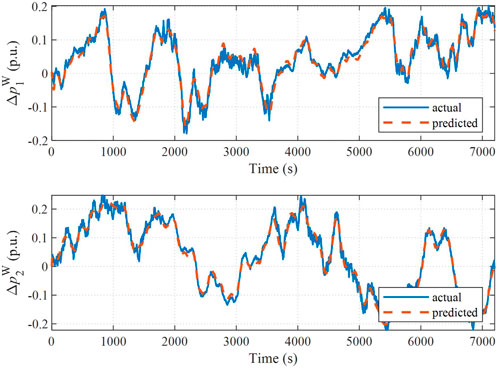
The structure of the simulation system for frequency regulation is shown in Figure 4 containing two areas with rated capacities of both 600 MW and a rated system frequency of both 50 Hz. The parameters of the simulation system are listed in Table 1 (Kundur et al., 1994; Pathak et al., 2018). The parameters and initial SoC levels of the ESSs are listed in Table 2. The predicted and actual wind power deviations in the two areas are shown in Figure 5. The total simulation time is set as 7200s; the time step is set as 1s; the parameters of the SDE models can be found in Supplementary Appendix SC; the upper-layer SO problem is solved every 60 s, in which the parameter
5.2 Frequency regulation results
In this section, two contrast cases are introduced for comparison. Contrast method 1: the contribution of the ESS is not considered during the frequency regulation, and Contrast method 2, namely, PI: the power command for the ESS is computed via PI controller, where the input signal of PI is high-frequency components of the ACE signal via a high-pass filter. In addition, our proposed method is denoted as ITB-SO for convenience.
The results of frequency deviations under these different control methods are compared in Figure 6. It is clear that when the ESS participates in frequency regulation, the peak and nadir value of system frequency is always reduced and increased. Most of the time, the frequency deviations of the two areas can be limited within the ±0.2 Hz bounds, both under the PI and the ITB-SO methods. However, the PI method cannot respond immediately to wind power fluctuation, so it is difficult to make full use of the rapid adjustment capability of the ESS. The root mean squared (RMS) value of frequency deviations is given for comparison as shown in Figure 6. It can be seen that the RMS value under the ITB-SO method is the lowest, and that of the two different areas can be restricted to a similar level.

FIGURE 6. Comparison of frequency deviation under different control methods of (A) area 1 and (B) area 2.
To verify that the proposed ITB-SO method can adaptively adjust the power output of the ESS considering different rated power and energy capacity, Figure 7 gives the simulation results under the PI and the ITB-SO methods. It can be seen that the power command for ESS cluster 2 cannot be accurately met by the actual output during several periods because the rated power of ESS cluster 2 is small. On the contrary, the scheme determined by ITB-SO is based on the estimation of the future possible power and SoC in a finite horizon; therefore, the violation of power and energy restriction can be avoided, and the frequency regulation performance can be guaranteed.
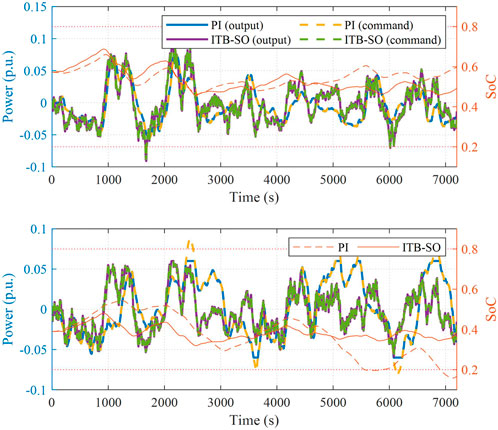
FIGURE 7. Comparison results under different control methods of (A) ESS cluster 1 and (B) ESS cluster 2.
In addition, the SoC level under ITB-SO is closer to the reference value than that of the PI method. For example, the ESS cluster 2 operates near the lower SoC bound, i.e., 0.2 after 5500 s under PI control, while under ITB-SO, ESS cluster 1, with a higher energy level, discharges more power to release the burden of ESS cluster 2. That is because the penalty of SoC deviation is also considered in the objective function in order to force the SoC to the reference value.
5.3 Accuracy and results of stochastic assessment
The effectiveness of the rolling-horizon manner is validated in this section by comparing it with Monte Carlo sample (MCS) simulations, where the MCS simulations are conducted under 100 wind power generation scenarios. Results of the two successive rollings (100th and 101st) are shown in Figure 8. The violet bands represent 85–100% (5% interval) of all 100 MCS results, and the actual operation results are clearly in the scope of the MCS. The four subgraphs in the left column show the wind power deviation, frequency deviation, power, and SoC of the ESS cluster in area 1, and those in area 2 are in the right column.
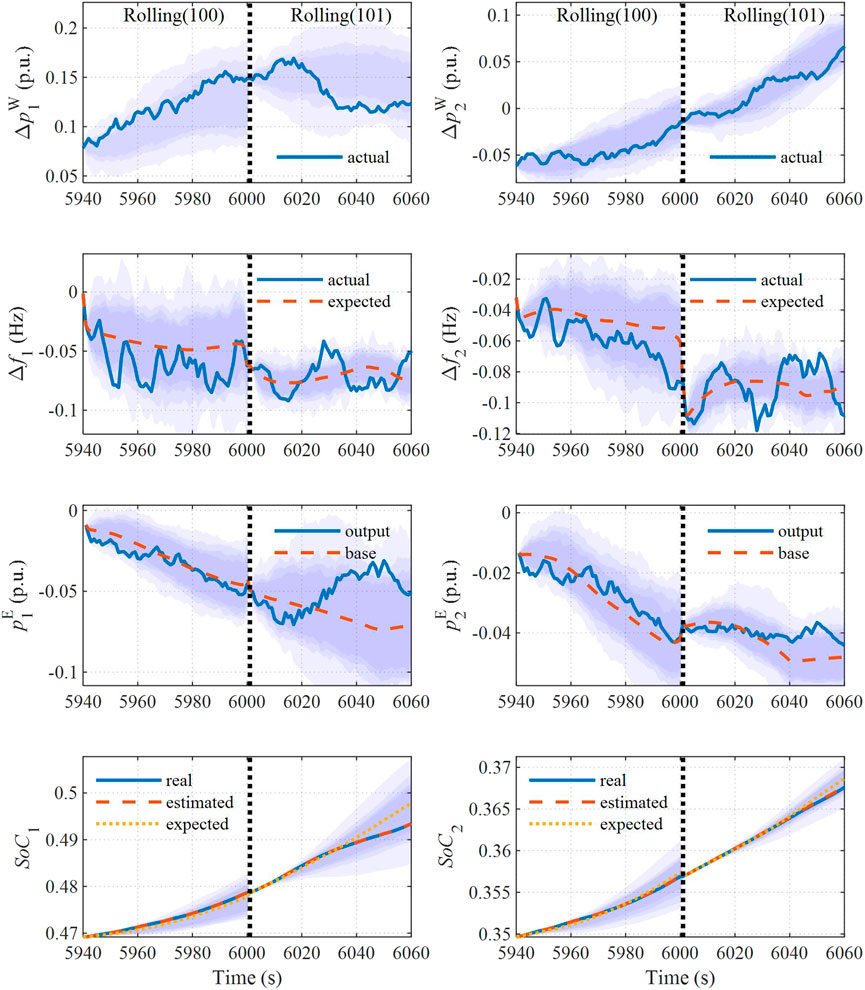
FIGURE 8. Actual results and Monte Carlo samples of (A,B) wind power deviation, (C,D) frequency deviation (E,F) power output of the ESS cluster, and (G,H) SoC level of the ESS cluster.
In Figures 8C and D, the expected value is obtained without taking into account wind power uncertainty, where the impact of stochastic fluctuation on the objective and chance constraints in the optimization problem cannot be considered. Therefore, the application of SO is necessary. In Figures 8E and F, it can be seen that the control output of the ESS can be further corrected according to the feedback policy and respond to the real-time wind power prediction error rapidly. In Figures 8G and H, the curve marked ‘real’ is the mean value of all ESUs in the ESS cluster, and the estimated results are obtained by equivalent discharge and charge efficiency as in (18). It indicates that accuracy can be ensured, and the effectiveness of ITB-SO can be verified.
To verify the effectiveness of the approximately decomposed reformulation of SAF in the first-order form, the objective value assessed by SAF of each rolling iteration is compared with the results via MCS simulations. The gross objective is divided into multi-objective for comparison as shown in Figure 9, including the objective of frequency deviations, control variables, and SoC deviations. It evidenced the accuracy of SAF without scenario generation; thus, the computational efficiency can be enhanced.
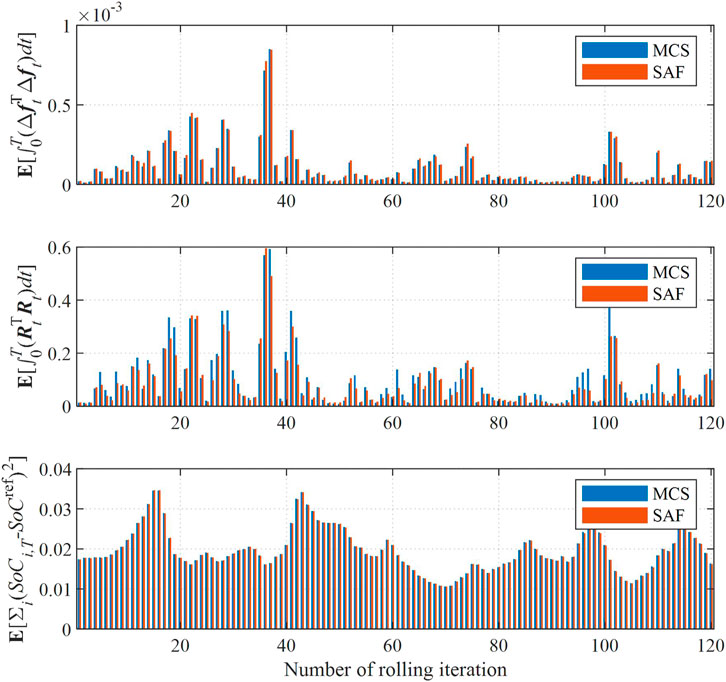
FIGURE 9. Objective value estimated by SAF compared with Monte Carlo samples: (A) objective of frequency deviations, (B) objective of control variables, and (C) objective of SoC deviations. Keywords: energy storage, frequency regulation, wind power uncertainty, stochastic optimization, Itô theory, distributed algorithm.
5.4 Results of DA
Taking the ESUs in the ESS cluster 1 as an example, Figure 10 shows their output power and SoC level under the DA method, compared with the contrast method, which is to reach the average command signals. It is easy to be implemented without iteration, and the power command can be met under ideal situations.
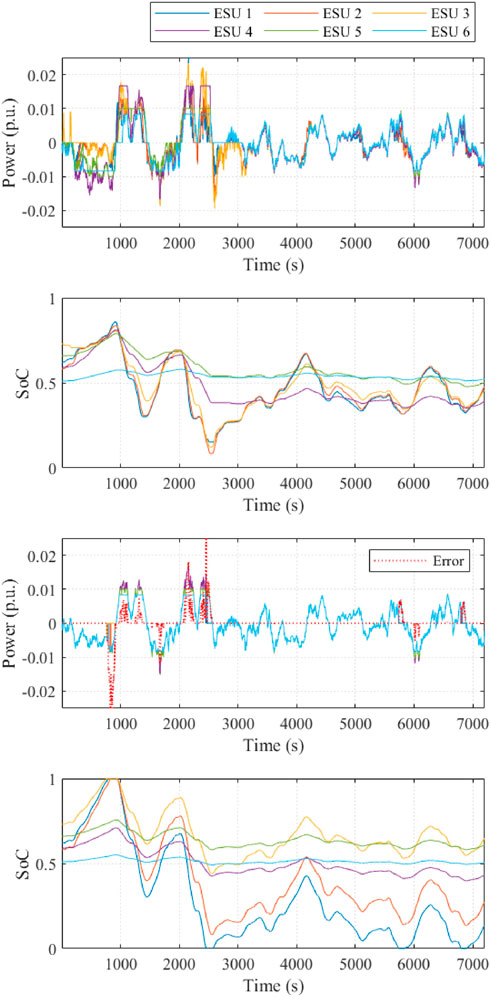
FIGURE 10. Power output and SoC level of each ESU compared under (A,B) DA control and (C,D) equally allocation method.
However, the tracking error cannot be eliminated because of the SoC saturation or violation of rated power in some cases when the power command is equally allocated to each ESU. For example, in Figures 10C and D, some ESUs withdraw from frequency regulation since their SoC level reaches the upper bound (such as 800 s) and the lower bound (such as 2500 s) or the power signal is larger than the rated output (such as 1080 s), while others with large energy capacity are barely used. Therefore, the effect of frequency regulation could deteriorate due to sudden withdrawals. In contrast, the proposed DA method enables all ESUs to coordinate their output power and adjust their SoC at optimal levels. It is clear from Figure 10B that the SoC level is attracted to their reference value and the saturation can be avoided. Therefore, the DA method can make full use of the characteristics and advantages of power-type and energy-type units effectively.
Random communication failure between the ESU agents is implemented to verify the robustness of the DA dispatching method. The results are studied in different simulation systems containing 5, 10, 20, and 50 ESUs. The situation with complete connectivity is defined as all units being connected with each other. Then, the proportion of missing communication links varies from 10 to 80% (10% interval) by disconnecting the communication links randomly. The boxplot of iteration times and the mean value of algebraic connectivity are shown in Figure 11. The algebraic connectivity is the second smallest eigenvalue of the Laplace matrix
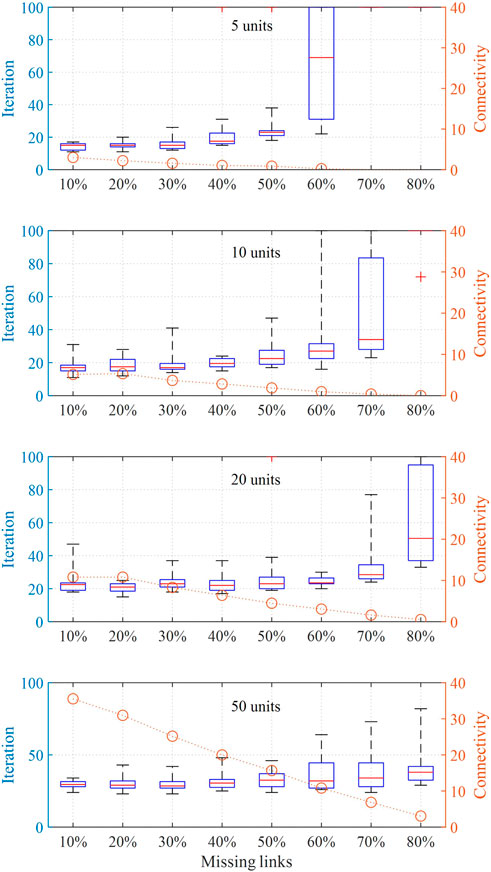
FIGURE 11. Results of iteration times and mean value of connectivity for simulation systems with different numbers of ESUs Nomenclature.
When parts of the communication links disconnect between ESUs, they can still share information through other remaining links and successfully track the power command as well. It can be found in Figure 11 that with the increase in the number of missing links, the connectivity gradually decreases while iteration times increase. However, the trend is diverse with different numbers of units: iteration times with 20 and 50 units increase slower than that with 5 and 10 units, and the iteration characteristic is more stable. It indicates that random communication failure has a slight impact on the system with numerous ESUs and the robustness is higher.
6 Conclusion
In this article, a bi-layer optimal SFC approach is proposed for ESSs to participate in multi-area systems frequency regulation under continuous wind power fluctuations. The upper-layer control based on the ITB-SO method in a rolling-horizon manner is implemented to determine the power command for different ESS clusters considering wind power uncertainties. The power output of ESUs in the same cluster is coordinated using the DA method in the lower-layer control to track the total power command. The simulation applications reveal that 1) the stability of the system frequency can be enhanced by compensating for wind power volatility immediately via ESSs. Moreover, the trade-off between frequency regulation performance and the operation cost of the ESS can be achieved. 2) The ITB-SO method can solve optimization problems precisely without generating scenarios of wind power. The computational efficiency is high, so it is suitable for real-time SFCs. 3) Sudden withdrawals of ESSs due to energy saturation and violation of power limit can be avoided by dispatching power signals using the DA method. The robustness of the DA method is also validated while missing limited communication links between ESUs. In future work, the addition of PV systems would be considered.
Data availability statement
The original contributions presented in the study are included in the article; further inquiries can be directed to the corresponding author.
Author contributions
ZW, FW, and LS contributed to the conception and design of the study. ZW and YL are responsible for providing experimental design and data analysis. ZW and WH are responsible for providing code implementation. All authors contributed to the manuscript writing revised, read, and approved the submitted version.
Funding
This work was supported in part by the Funds for International Cooperation and Exchanges of the National Natural Science Foundation of China under Grant 52061635102, and in part by the Overseas Expertise Introduction Project for Discipline Innovation (“111Project”) under Grant B14022.
Conflict of interest
The authors declare that the research was conducted in the absence of any commercial or financial relationships that could be construed as a potential conflict of interest.
Publisher’s note
All claims expressed in this article are solely those of the authors and do not necessarily represent those of their affiliated organizations, or those of the publisher, the editors, and the reviewers. Any product that may be evaluated in this article, or claim that may be made by its manufacturer, is not guaranteed or endorsed by the publisher.
Supplementary material
The Supplementary Material for this article can be found online at: https://www.frontiersin.org/articles/10.3389/fenrg.2022.1005281/full#supplementary-material
References
Alsharif, H., Jalili, M., and Hasan, K. N. 2020. "Analyzing the impact of distribution of battery energy storage system for participation in frequency regulation", in: 2020 Australasian Universities Power Engineering Conference (AUPEC), Hobart, Australia, 29 November 2020 - 02 December 2020, 1–6.
Anderson, T., Muralidharan, M., Srivastava, P., Haghi, H. V., Cortés, J., Kleissl, J., et al. (2021). Frequency regulation with heterogeneous energy resources: A realization using distributed control. IEEE Trans. Smart Grid 12 (5), 4126–4136. doi:10.1109/TSG.2021.3071778
Bidram, A., and Davoudi, A. (2012). Hierarchical structure of microgrids control system. IEEE Trans. Smart Grid 3 (4), 1963–1976. doi:10.1109/TSG.2012.2197425
Calafiore, G. C., and Ghaoui, L. E. (2006). On distributionally robust chance-constrained linear programs. J. Optim. Theory Appl. 130 (1), 1–22. doi:10.1007/s10957-006-9084-x
Chen, C., Bao, Y.-Q., Wu, X.-H., Wang, B., and Shen, C. (2019a). Battery energy storage system based on incremental cost consensus algorithm for the frequency control. IEEE Access 7, 147362–147372. doi:10.1109/access.2019.2946458
Chen, X., Lin, J., Liu, F., and Song, Y. (2019b). Optimal control of AGC systems considering non-Gaussian wind power uncertainty. IEEE Trans. Power Syst. 34 (4), 2730–2743. doi:10.1109/tpwrs.2019.2893512
Chen, X., Lin, J., Liu, F., and Song, Y. (2019c). Stochastic assessment of AGC systems under non-Gaussian uncertainty. IEEE Trans. Power Syst. 34 (1), 705–717. doi:10.1109/tpwrs.2018.2865502
Cheng, Y., Tabrizi, M., Sahni, M., Povedano, A., and Nichols, D. (2014). Dynamic available AGC based approach for enhancing utility scale energy storage performance. IEEE Trans. Smart Grid 5 (2), 1070–1078. doi:10.1109/TSG.2013.2289380
Cherukuri, A., and Cortes, J. (2018). Distributed coordination of DERs with storage for dynamic economic dispatch. IEEE Trans. Autom. Contr. 63 (3), 835–842. doi:10.1109/tac.2017.2731809
Esmaili, A., Novakovic, B., Nasiri, A., and Abdel-Baqi, O. (2013). A hybrid system of Li-ion capacitors and flow battery for dynamic wind energy support. IEEE Trans. Ind. Appl. 49 (4), 1649–1657. doi:10.1109/tia.2013.2255112
Garcia-Torres, F., Bordons, C., Tobajas, J., Real-Calvo, R., Santiago, I., and Grieu, S. (2021). Stochastic optimization of microgrids with hybrid energy storage systems for grid flexibility services considering energy forecast uncertainties. IEEE Trans. Power Syst. 36 (6), 5537–5547. doi:10.1109/tpwrs.2021.3071867
Jan, M. U., Xin, A., Abdelbaky, M. A., Rehman, H. U., and Iqbal, S. (2020). Adaptive and fuzzy PI controllers design for frequency regulation of isolated microgrid integrated with electric vehicles. IEEE Access 8, 87621–87632. doi:10.1109/access.2020.2993178
Karrari, S., Baghaee, H. R., Carne, G. D., Noe, M., and Geisbuesch, J. (2020). Adaptive inertia emulation control for high‐speed flywheel energy storage systems. IET Gener. Transm. Distrib. 14 (22), 5047–5059. doi:10.1049/iet-gtd.2020.0066
Khan, F. H., Pal, T., Kundu, B., and Roy, R. "Wind energy: A practical power analysis approach", in: 2021 Innovations in Energy Management and Renewable Resources,Kolkata, 07 February 2021, 1–6.
Kundur, P., Balu, N. J., and Lauby, M. G. (1994). Power system stability and control. New York: McGraw-Hill.
Lee, S.-J., Kim, J.-H., Kim, C.-H., Kim, S.-K., Kim, E.-S., Kim, D.-U., et al. (2016). Coordinated control algorithm for distributed battery energy storage systems for mitigating voltage and frequency deviations. IEEE Trans. Smart Grid 7 (3), 1713–1722. doi:10.1109/tsg.2015.2429919
Li, N., Zhao, C., and Chen, L. (2016). Connecting automatic generation control and economic dispatch from an optimization view. IEEE Trans. Control Netw. Syst. 3 (3), 254–264. doi:10.1109/tcns.2015.2459451
Li, Q., Gao, D. W., Zhang, H., Wu, Z., and Wang, F. y. (2019). Consensus-based distributed economic dispatch control method in power systems. IEEE Trans. Smart Grid 10 (1), 941–954. doi:10.1109/TSG.2017.2756041
Lingohr, D., and Müller, G. (2019). Stochastic modeling of intraday photovoltaic power generation. Energy Econ. 81, 175–186. doi:10.1016/j.eneco.2019.03.007
Mauricio, J. M., Marano, A., Gomez-Exposito, A., and Martinez Ramos, J. L. (2009). Frequency regulation contribution through variable-speed wind energy conversion systems. IEEE Trans. Power Syst. 24 (1), 173–180. doi:10.1109/tpwrs.2008.2009398
Meegahapola, L., and Flynn, D. 2010. "Impact on transient and frequency stability for a power system at very high wind penetration", in: IEEE PES General Meeting, Minneapolis, 29 July 2010, 1–8.
Megel, O., Liu, T., Hill, D. J., and Andersson, G. (2018). Distributed secondary frequency control algorithm considering storage efficiency. IEEE Trans. Smart Grid 9 (6), 6214–6228. doi:10.1109/tsg.2017.2706979
Miller, N. W., Clark, K., and Shao, M. "Frequency responsive wind plant controls: Impacts on grid performance", in: 2011 IEEE Power and Energy Society General Meeting, Detroit, 28 July 2011, 1–8.
Oshnoei, A., Kheradmandi, M., and Muyeen, S. M. (2020). Robust control scheme for distributed battery energy storage systems in load frequency control. IEEE Trans. Power Syst. 35 (6), 4781–4791. doi:10.1109/tpwrs.2020.2997950
Pathak, N., Bhatti, T. S., Verma, A., and Nasiruddin, I. (2018). AGC of two area power system based on different power output control strategies of thermal power generation. IEEE Trans. Power Syst. 33 (2), 2040–2052. doi:10.1109/tpwrs.2017.2734923
Postnikov, E. B. (2020). Estimation of COVID-19 dynamics “on a back-of-envelope”: Does the simplest SIR model provide quantitative parameters and predictions? Chaos Solit. Fractals 135, 109841. doi:10.1016/j.chaos.2020.109841
Pourbabak, H., Luo, J., Chen, T., and Su, W. (2018). A novel consensus-based distributed algorithm for economic dispatch based on local estimation of power mismatch. IEEE Trans. Smart Grid 9 (6), 5930–5942. doi:10.1109/tsg.2017.2699084
Qiu, Y., Lin, J., Liu, F., Song, Y., Chen, G., and Ding, L. (2020). Stochastic online generation control of cascaded run-of-the-river hydropower for mitigating solar power volatility. IEEE Trans. Power Syst. 35 (6), 4709–4722. doi:10.1109/tpwrs.2020.2991229
Sanchez-Gasca, J. J., D'Aquila, R., Price, W. W., and Paserba, J. J. 1995. "Variable time step, implicit integration for extended-term power system dynamic simulation", in: Power Industry Computer Application Conference, Salt Lake City, 2 May 1995.
Shim, J. W., Verbic, G., Zhang, N., and Hur, K. (2018). Harmonious integration of faster-acting energy storage systems into frequency control reserves in power grid with high renewable generation. IEEE Trans. Power Syst. 33 (6), 6193–6205. doi:10.1109/tpwrs.2018.2836157
Skaf, J., and Boyd, S. P. (2010). Design of affine controllers via convex optimization. IEEE Trans. Autom. Contr. 55 (11), 2476–2487. doi:10.1109/TAC.2010.2046053
Tsili, M., and Papathanassiou, S. (2009). A review of grid code technical requirements for wind farms. IET Renew. Power Gener. 3 (3), 308–332. doi:10.1049/iet-rpg.2008.0070
U.S.DOE (2021). Global energy storage database projects. [Online]. Available: https://sandia.gov/ess-ssl/gesdb/public/projects.html (accessed 01Jun, 2022).
Verdejo, H., Awerkin, A., Saavedra, E., Kliemann, W., and Vargas, L. (2016). Stochastic modeling to represent wind power generation and demand in electric power system based on real data. Appl. Energy 173, 283–295. doi:10.1016/j.apenergy.2016.04.004
Wang, Y., Xu, Y., Tang, Y., Liao, K., Syed, M. H., Guillo-Sansano, E., et al. (2019). Aggregated energy storage for power system frequency control: A finite-time consensus approach. IEEE Trans. Smart Grid 10 (4), 3675–3686. doi:10.1109/TSG.2018.2833877
Wen, G., Yu, X., Liu, Z.-W., and Yu, W. (2018). Adaptive consensus-based robust strategy for economic dispatch of Smart grids subject to communication uncertainties. IEEE Trans. Ind. Inf. 14 (6), 2484–2496. doi:10.1109/tii.2017.2772088
Yin, J., Leon, J. I., Perez, M. A., Franquelo, L. G., Marquez, A., and Vazquez, S. (2021). Model predictive control of modular multilevel converters using quadratic programming. IEEE Trans. Power Electron. 36 (6), 7012–7025. doi:10.1109/tpel.2020.3034294
Yoonsoo, K., and Mesbahi, M. (2006). On maximizing the second smallest eigenvalue of a state-dependent graph Laplacian. IEEE Trans. Autom. Contr. 51 (1), 116–120. doi:10.1109/tac.2005.861710
Zhang, X., Yu, T., Yang, B., and Jiang, L. (2021). A random forest-assisted fast distributed auction-based algorithm for hierarchical coordinated power control in a large-scale PV power plant. IEEE Trans. Sustain. Energy 12 (4), 2471–2481. doi:10.1109/tste.2021.3101520
Zhao, T., and Ding, Z. (2018a). Cooperative optimal control of battery energy storage system under wind uncertainties in a microgrid. IEEE Trans. Power Syst. 33 (2), 2292–2300. doi:10.1109/tpwrs.2017.2741672
Zhao, T., and Ding, Z. (2018b). Distributed agent consensus-based optimal resource management for microgrids. IEEE Trans. Sustain. Energy 9 (1), 443–452. doi:10.1109/TSTE.2017.2740833
Glossary
RES Renewable energy sources
SFC Secondary frequency control
ESS Energy storage system
ESU Energy storage unit
SoC State-of-charge
AGC Automatic generation control
ACE Area control errors
ITB-SO Itô theory-based stochastic optimization
DA Distributed algorithm
SDE Stochastic differential equation
SAF Stochastic assessment function
MCS Monte Carlo samples
Variables
K Gain matrix of feedback control
Parameters
Keywords: energy storage, frequency regulation, wind power uncertainty, stochastic optimization, Itô theory, distributed algorithm
Citation: Wang Z, Wu F, Li Y, Huang W and Shi L (2022) Bi-layer optimal secondary frequency control approach for energy storage clusters considering wind power uncertainty. Front. Energy Res. 10:1005281. doi: 10.3389/fenrg.2022.1005281
Received: 28 July 2022; Accepted: 23 August 2022;
Published: 23 September 2022.
Edited by:
Shiwei Xia, North China Electric Power University, ChinaReviewed by:
Lei Sun, Hefei University of Technology, ChinaAmit Kumar, Thapar Institute of Engineering and Technology, India
Copyright © 2022 Wang, Wu, Li, Huang and Shi. This is an open-access article distributed under the terms of the Creative Commons Attribution License (CC BY). The use, distribution or reproduction in other forums is permitted, provided the original author(s) and the copyright owner(s) are credited and that the original publication in this journal is cited, in accordance with accepted academic practice. No use, distribution or reproduction is permitted which does not comply with these terms.
*Correspondence: Yang Li, ZWVsaXlhbmdAaGh1LmVkdS5jbg==
 Zizhao Wang
 Feng Wu
 Yang Li