 Xiaolin Chen1
 Tao Wan1,2,3*
- 1Advanced Energy Science and Technology Guangdong Laboratory, Huizhou, China
- 2Institute of Modern Physics, Chinese Academy of Sciences, Lanzhou, China
- 3School of Nuclear Science and Technology, University of Chinese Academy of Sciences, Beijing, China
Structural material compatibility with lead bismuth eutectic is one of the main challenges for design and operation of the LBE-cooled nuclear systems. To better understand the mechanisms of stainless steel corrosion behavior in LBE flow, the iron mass transfer phenomenon on roughened walls under various LBE pipe flow conditions are numerically investigated in this study. CFD simulations are performed, by applying a low Reynolds number k-ε model, in a range of Reynolds number from 5 × 10³ to 105. Meanwhile, various pipe wall roughness conditions are considered, which are simulated by crests with different depths and periodic lengths. Effects of roughness dimensions and Reynolds numbers on the near-wall mass transfer rate are investigated. Results showed that higher flow velocities and shorter crest length led to higher mass transfer coefficient. On the basis of the results, the mass transfer coefficients are proposed both for smooth wall and roughened walls. The mass transfer enhanced by wall roughness is characterized by the ratio of rough-to-smooth mass transfer coefficient, and this ratio is demonstrated by a regression equation, in which dimensionless roughness number, Reynolds number and geometrical ratio of the roughness are included. Moreover, it is found that the ratio of rough-to-smooth mass transfer coefficient is relatively more dependent on Reynolds number.
Introduction
Lead-bismuth Eutectic (LBE) is a prominent candidate coolant for Lead-cooled Fast Reactors (LFRs) and Accelerator Driven Systems (ADS) due to its favorable thermal and physical properties (Zhang, 2014). However, the compatibility of structure material (e.g., stainless steel) with LBE is one of the key issues for design and operation of LBE-cooled nuclear systems. Stainless steels could be severely corroded when exposed to flowing LBE, which would challenge the structural integrity of and operation safety, especially at high working temperature.
To better understand the mechanism and characteristics of steel corrosion in LBE, many studies have been carried out in last two decades (Barbier et al., 2001; Benamati et al., 2006; Doubková et al., 2008; Zhang and Li, 2008; Del Giacco et al., 2014; Heinzel et al., 2014; Lambrinou et al., 2017; Chen et al., 2019). The state-of-art of steel corrosion in LBE pointed out four main mechanisms: oxidation, dissolution, erosion-corrosion and fretting wear (Ballinger and Lim, 2004; Zhang and Li, 2008; Zhang, 2009; Gong et al., 2022). Oxidation of steel occurs if oxygen concentration in LBE reaches appropriate value, Fe3O4-based oxide film or layer could be formed at the metal surface, which could be protective or rather non-protective to the metallic surface. Dissolution corrosion is facilitated when the oxygen concentration in LBE locates at a sufficient low level, steel elements dissolve directly into LBE since there is no protective oxide layer at surface. The dissolution is driven by the temperature-dependent chemical potential differences of elements in steels and those in LBE. Erosion-corrosion is also termed as flow-assisted corrosion, it is caused by the LBE penetration into grain boundaries of steel when dissolution of elements occurs, then the loose grains are stripped by high wall shear stress under high velocities, which leads to further penetration of LBE into steel. Fretting wear is considered as an interaction of flow-induced vibration and corrosion processes, which occurs most likely at fuel pins in core or heat exchanger tubes in steam generator.
The surface condition is one of the addressed factors that affects the LBE corrosion behavior (Gong et al., 2022). Discrepancies of liquid metal corrosion behavior of steels under different surface conditions were reported. Doubková et al. (2008) observed a different corrosion resistance for T91 steel specimens with ground and passivated surfaces in the same LBE environment. Tsisar et al. (2018) investigated effect of structure state and surface finishing of austenitic 1.4970 (15-15 Ti) steel on the corrosion under flowing oxygen-containing LBE condition, and they found out that specimens with polished surfaces were less resistant to dissolution corrosion. Ilinc̆ev et al. (2004) carried out corrosion/oxidation behavior studies of 304 and 316 Austenitic steel in LBE with different oxygen concentrations, differences of corrosion rates were reported between specimens with ground, passivated, and as-produced surfaces. Thus, it is reasonable to consider that surface roughness, which could represent the surface condition, plays an important role in corrosion/oxidation behavior of steel in LBE.
The effect of surface roughness on mass transfer behavior has been investigated under different Reynolds numbers and Schmidt numbers. Mass transfer on various roughened surfaces including V-shaped grooves (Dawson and Trass, 1972; Tantirige and Trass, 1984; Grifoll et al., 1986; Zhao and Trass, 1997), erosion-corrosion roughness (Postlethwaite and Lotz, 1988), sandpaper-roughness (Lolja, 2005) and square ribs (Berger and Hau, 1979) have been studied by applying electrochemical method (Selman and Tobias, 1978). Equations of Sherwood number, Reynolds number and Schmidt number were proposed. Dimensionless wall roughness was considered as a factor enhancing the mass transfer. Recently, researchers investigated mass transfer enhancement on sinusoidal wavy wall, in which a plaster dissolution method was applied to measure the mass transfer coefficient (Fujisawa et al., 2017, 2020; Yamagata and Fujisawa, 2021). Meanwhile, CFD studies of roughness effect on mass transfer by using low Reynolds number (LRN) models are reported as well. Mass transfer behavior on a sinusoidal wavy wall was simulated and compared with the experimental results by Yamagata and Fujisawa (2021) and Fujisawa et al. (2017, 2020), respectively. Lari et al. (2013) investigated the mass transfer behavior on d-type rough wall under high Schmidt number by applying a LRN k-ε model, they concluded that mass transfer could be either enhanced or weakened by the roughness.
Mass transfer of elements in LBE is a crucial phenomenon in steel corrosion process. Due to the technical difficulties in experimental measurement, the CFD investigation is considered as a highly effective way. Zhang et al. (2021) used Ansys FLUENT code to simulate oxygen mass transfer for a packed bed of PbO spheres in flowing LBE in the CRAFT experiment. Ito and Sakai (2004) evaluated the oxygen concentration controllability in a LBE-cooled natural-circulation reactor using COCOA code. Feng et al. (2021) proposed a coupling method between the oxidation model and Ansys CFX code to simulate the oxidation reaction in fuel assemblies under flowing LBE. Marino et al. (2018) investigated the oxygen concentration profiles through the 19-pin scaled fuel assembly of MYRRHA reactor core with Ansys CFX tool and identified the regions which are prone to LBE corrosion. The investigation of oxygen transfer in LBE is necessary in environment of high oxygen concentration, while in environment of low oxygen concentration, the study of iron transfer is crucial when dissolution of iron occurs at the interface of structural steel and LBE. Investigation on iron mass transfer in dissolution corrosion under different surface states of steel, could provide considerable values for evaluation of dissolution damage of LBE to steel, like corrosion rate. However, to the best of the authors’ knowledge, CFD investigation of iron transfer behavior under LBE flow condition is limited, especially transfer from roughened wall to bulk LBE. By using STAR-CD code to simulate the mass transfer behavior of dissolved iron, Wan and Saito (2018) evaluated the corrosion rate of 316L steel in LBE and compared with experimental data. More numerical investigations on iron transfer in LBE are required for the further analysis and model development of iron dissolution. Although experimental investigation has always been the main approach in the research of steel corrosion behavior in LBE, the CFD approach is thought to be an effective way to analyze the local mass transfer phenomenon on roughened walls and is able to provide considerable values for further development of corrosion/dissolution model of steel in LBE.
The aim of this study is to characterize the effect of rough walls on iron transfer behavior in LBE flow and to further enhance the understanding of steel dissolution in LBE. For this purpose, d-type roughened pipe wall geometries are chosen, numerical simulation of iron transfer in LBE flow at different Reynolds numbers is carried out. By applying LRN k-ε model, the mass transfer coefficient is obtained through the calculated near-wall iron concentration. Effect of different roughness is then analyzed by comparison with smooth wall, the rough-to-smooth ratio is characterized and correlated with several parameters.
Physical models
Corrosion and mass transfer model
In the steady state LBE pipe flow without protective oxide layer at wall under isothermal condition, the steel corrosion depends on the mass transfer rates and dissolution/reaction rates of steel constituents at wall. If the mass transfer rate is greater than dissolution rate, the corrosion is dominated by the mass transfer, which is called mass transfer controlled corrosion. In the other case, it is called activation controlled or dissolution controlled corrosion (Zhang et al., 2010). The dissolved iron at wall is firstly transferred through the diffusion boundary layer by molecular diffusion, then the transfer rate of iron becomes higher in the viscous sublayer. The diffusion boundary layer could be very thin as the Schmidt number is considerably high (order of 103).
The mass flux of iron J at wall obeys the Fick’s law and could be expressed as follow:
where Dm is the molecular diffusion coefficient of iron, C and n are, respectively the concentration and normal distance to wall in Fick’s law, respectively, Cw is the concentration of iron at wall, y0 is the distance from wall and C0 is the concentration of iron at distance y0. In general, the distance y0 represents the thickness of the first inflation mesh layer in CFD simulation. Meanwhile, the mass flux from dissolution location to bulk fluid can be expressed by the following equation, where Cw denotes concentration at wall, Cb denotes concentration in bulk fluid and K is mass transfer coefficient of iron:
Since the mass transfer rate in diffusion boundary layer is very low, it dominates the mass transfer from wall to bulk fluid. Thus, the iron mass flux is the same in Eqs 1, 2, and the mass transfer coefficient can be deduced by
For the mass transfer controlled corrosion, the corrosion rate (CR) is proportional to the mass flux and therefore can be directly calculated as follow (Davis and Frawley, 2009):
where ρFe and M denote the density and molar mass of iron, respectively. In addition, many studies have found that local wall-to-liquid mass transfer behavior and corrosion rate in practical geometries have strong dependence on the near-wall turbulent level (Poulson, 1999; Nešić, 2006; Ikarashi et al., 2017), the near-wall concentration distributions of solutes are considered to be influenced by the near-wall turbulent kinetic energy (Wan and Saito, 2018).
For the mass transfer in a steady-state or fully developed flow, correlations between Sherwood number Sh, (
where the coefficients a1 depends on the geometry, a2 generally ranges from 0.5 to 1, while a3 is close to 1/3. As the near-wall mass transfer is affected by the wall roughness, the rough-to-smooth ratio of mass transfer coefficient Kr/Ks has been characterized by the similarity function (Dawson and Trass, 1972; Tantirige and Trass, 1984; Postlethwaite and Lotz, 1988; Mobarak et al., 1997; Zhao and Trass, 1997; Lolja, 2005). The mass transfer similarity function contains several parameters, such as the dimensionless roughness number, Schmidt number and Reynolds number:
The dimensionless roughness number (or roughness Reynolds number) e+ is defined by roughness height e and friction velocity u*:
The dimensionless friction velocity u∗ is determined by the stream flow velocity U and friction factor f, while the friction factor f could be determined by the measured pressure drop for pipe flow with roughened wall:
LRN turbulent model
The resolution of the near-wall iron concentration is critical since the near-wall concentration dominates the mass transfer behavior in LBE corrosion. To achieve a precise simulation of the near-wall flow behavior, LRN models with damping functions are used. LRN models have been proposed by Jones and Launder (1972), Launder and Sharma (1974), Lam and Bremhorst (1981), and Chien (1982). In this study, the Launder-Sharma LRN model is adopted for calculation, the transport equations of the turbulent kinetic energy and its dissipation rate are given as follows:
In the above equations, μt and Pk denote turbulent viscosity and production rate of turbulence respectively. σk, σɛ, C1, C2, and Cμ are constants which have the same values as those in the standard k-ε model (i.e. 1.0, 1.3, 1.44, 1.92, and 0.09, respectively). The modified turbulent dissipation rate ε* is related to the origin turbulent dissipation rate ε with a damping term Dε whose value is significant near wall but can be negligible away from the wall. With Eq. 12, equation of ε* could be solved by applying a zero wall boundary condition, which greatly simplifies the computation. f1, f2, and fμ are damping functions accounting for near-wall effects:
wherein the turbulent Reynolds number Ret is defined as:
The direct resolution of the viscous sublayer in LRN model requires very fine grids at walls, the first node (or cell centroid) should be located at y+ ≤ 1.
Numerical simulation
Rough wall geometry
The rough wall geometry consists of periodic square cavities, Figure 1 shows the 2D geometry of computational domain. An axis-symmetry model is adopted, with a radius of the cylinder pipe R = 4.9 mm. λ is the periodic distance between two adjacent cavities, while w and d denotes the width and depth of the cavity, respectively. The width-to-depth ratio w/d is one for square cavities, hence a d-type roughness is represented. The d-type roughness is considered as a good representative for a natural roughness and allows for comparison of the flow field with CFD and electrochemical experiments (Lari et al., 2013). Three different sizes of cavities w = 500, 250, 50 μm are adopted and the ratio λ/d = 2 and 4 are considered, respectively. The total length of computational domain is 80 mm, which is more than eight times of the inlet diameter, thus the pipe flow could be considered as fully developed. The mass transfer of smooth wall with the same radius R and length is also studied for comparison. Table 1 gives the models with different geometrical dimensions in this study.
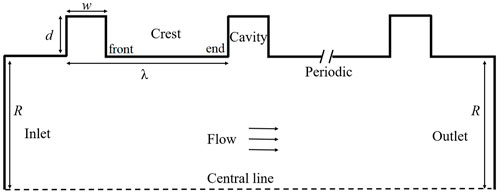
FIGURE 1. 2D axisymmetric geometry of the rough wall pipe.
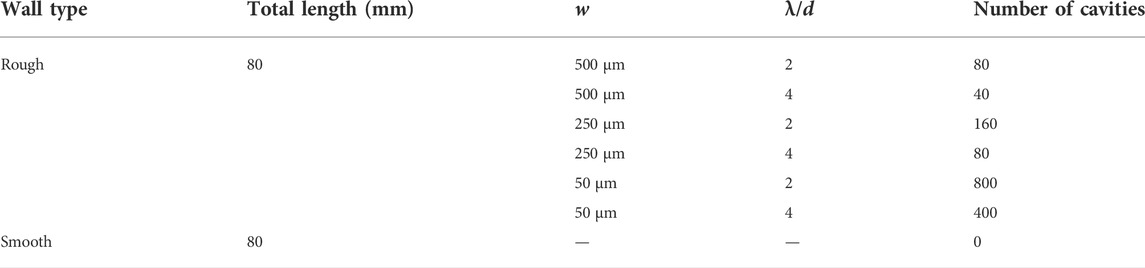
TABLE 1. Geometrical characteristics of considered models.
Mesh generation
Unstructured triangle grid was applied to the LBE bulk, with coupled mesh inflation that consists of fine layers near the wall. The thickness of the first inflation layer was fixed approximately at y+ = 0.1 or below for LRN model, which is considered as the thickness of the diffusion boundary layer (Nešić et al., 1992). Hence, in the above geometrical models, y+ was set as approximately 0.1 in the whole computational domain. For the LBE flow in condition Re = 5 × 10⁴, the thickness of the first layer is 3.4 × 10⁻⁷ m. With extension ratio of 1.2 in normal direction to the wall, sixteen layers were defined, which could cover the viscous sublayer region. In the region away from the wall, coarse triangle meshes were applied. The maximal total number of cells does not exceed two million. A typical mesh structure is given in Figure 2.
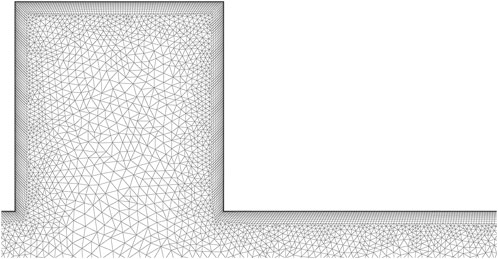
FIGURE 2. Mesh employed for computational domain (w = 500 μm, λ/d = 4).
Simulation set up
The steady-state simulation of LBE flow and iron transfer was carried out by the CFD code Ansys FLUENT. Table 2 summarizes the main boundary conditions applied in the computation. In each model, the inlet bulk fluid velocity ranges from 0.07 to 1.4 m/s, correspondingly the Reynolds number ranges from 5 × 10³ to 105. With an assumption that the oxygen concentration in LBE is sufficiently low, Fe3O4-based oxide film does not form at the metallic wall surface, so that LBE has direct contact with wall and the dissolution equilibrium of iron is established at wall. Thus, a constant iron concentration of 8.978 × 10⁻⁵ wt% is imposed at wall and the iron concentration in LBE bulk fluid is set as 9.576 × 10⁻⁶ wt% (Li, 2002). The viscosity of LBE adopted in calculation is 0.001402 kg/m.s, the density of LBE in simulation is 10130.2 kg/m3 at 450°C, the molecular diffusion coefficient of iron in LBE at 450°C is 3.16 × 10⁻¹⁰ m2/s, which is deduced through an extrapolation from Robertson’s law (Abella et al., 2011; OECD, 2015). A mesh independent check was preliminarily performed in the smooth pipe geometry. The Figure 3 shows the radial distribution of iron concentration at pipe outlet under Re = 5 × 10⁴ for different meshes number. The convergence of the resolution is reached when the relative residuals are all below 10−7.
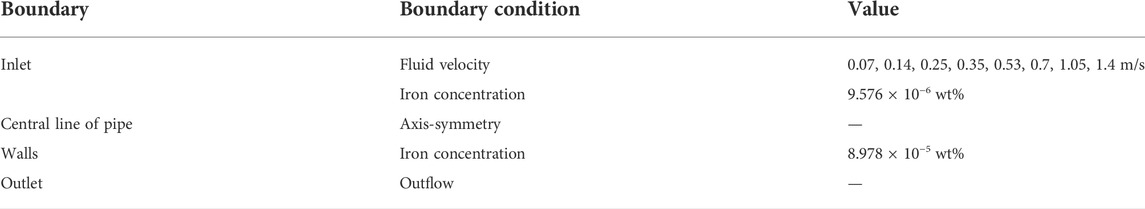
TABLE 2. Boundary conditions used in simulations.
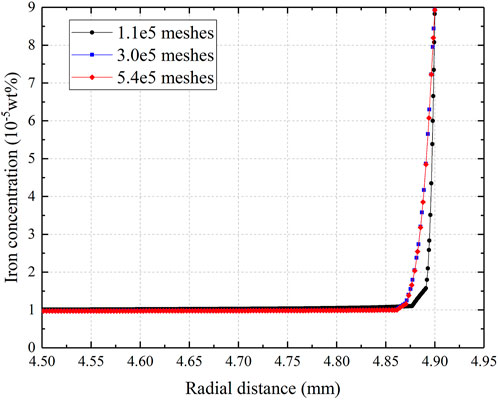
FIGURE 3. Radial distributions of iron concentration at Re = 5 × 10⁴ in mesh independent check.
Results and discussion
Iron mass transfer
The radial distributions of velocity at different positions near outlet are compared. In Figure 4, at distance of 70, 75, and 79 mm of the pipe, high consistency of the velocity profiles consist is observed respectively for smooth pipe and roughened pipe at Re = 105, which could verify the developed state of flow near outlet.
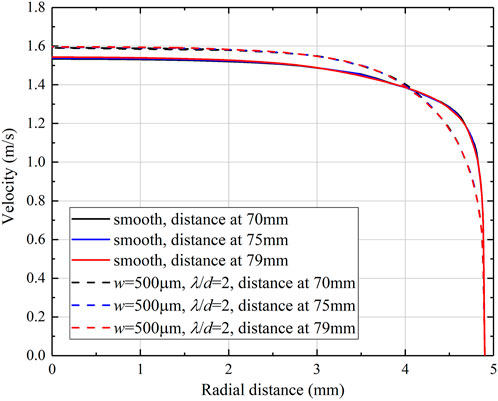
FIGURE 4. Radial distributions of velocity at distance of 70, 75, and 79 mm (Re = 105).
Since the mass transfer coefficient K is locally determined, a profile of K is obtained along the wall. The mass transfer coefficient of smooth wall Ks is the averaged value of K near the outlet. The mass transfer coefficient of rough wall Kr is the averaged value of K along the cavity walls and crest horizontal wall in a periodic length (see Figure 1). In addition, the mass transfer coefficient of the crest Kcr is the averaged value of K along the crest horizontal wall. The last periods of cavities in each roughness geometrical models are chosen in order to neglect the entrance effect of flow.
The results of mass transfer data Sherwood number Sh determined by predicted mass transfer coefficient are shown in Figure 5. Sh increased with a higher flow velocity, this is consistent with the fact that the diffusion boundary layer and viscous sublayer are thinner at high Re, therefore a higher near-wall concentration difference was formed and the mass transfer rate was enhanced. A higher corrosion rate could be observed for the flow at higher velocity. Berger and Hau (1977) have proposed a correlation for fully developed flow in smooth pipe where Re ranges from 8 × 10³ to 2 × 10⁵ and Sc varying from 1 × 10³ and 6 × 10³:
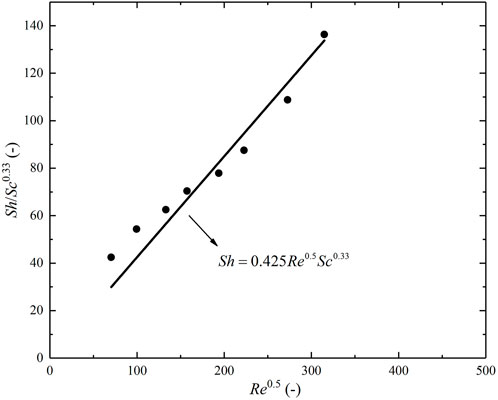
FIGURE 5. Sh/Sc0.33 versus Re0.5 for iron transfer on smooth wall (Re from 5 × 10³ to 105).
In previous mass transfer study, a relation between thickness of viscous sublayer δv and thickness of diffusion boundary layer δd was proposed (Levich, 1962; Nešić and Postlewaite, 1991):
The diffusion boundary layer is much thinner than viscous sublayer. In this diffusion boundary layer, the mass transfer is dominated by molecular diffusivity, while out of this layer the mass transfer is dominated by turbulence in viscous region. In the correlation between Sh, Re and Sc, Re affects the viscous layer of flow, while the relation between δv and δd depends on Sc. For this reason, the variation of mass transfer is mainly impacted by Re. The factor Sc0.33 in Eq. 16 is also verified by Wan and Saito (2018) in LBE pipe flow. Thus, we assume the same exponent value on Sc, which is the same approach as in Dawson and Trass (1972), Berger et al. (1979), and Postlethwaite and Lotz (1988), then the following correlation is obtained by regression:
The corrosion rate of smooth wall is also estimated and compared with experimental data which were reported by Wan and Saito (2018). The averaged corrosion depth of a 9.8 mm-diameter straight pipe under LBE flow at a velocity of 0.7 m/s ranges from 0.06–0.16 mm after 3,000 h operation. With the same flow condition, the predicted corrosion depth calculated by Eqs 3, 4 is about 0.22 mm, which is near 1.4 to 3.6 times of the measured value. This discrepancy may be caused by the varying surface condition of the pipe during operation and the assumption of saturated solute concentration at solid-fluid interface.
Iron mass transfer from roughened walls is different compared to smooth wall, since the near-wall velocity field can be affected by the rough wall. The results show that stagnant flow is formed in cavities. Figure 6 gives the flow velocity fields in cavities under different roughness at Re = 5 × 10⁴ and Figure 7 gives the corresponding iron concentration distributions. Given the same inlet condition, the velocity magnitude in cavity decreased as the size of cavity decreased, resulting in the increased near-wall concentration, which led to weaker transfer of iron from cavity wall to LBE bulk fluid. Similar results were observed at different Reynolds numbers as well.
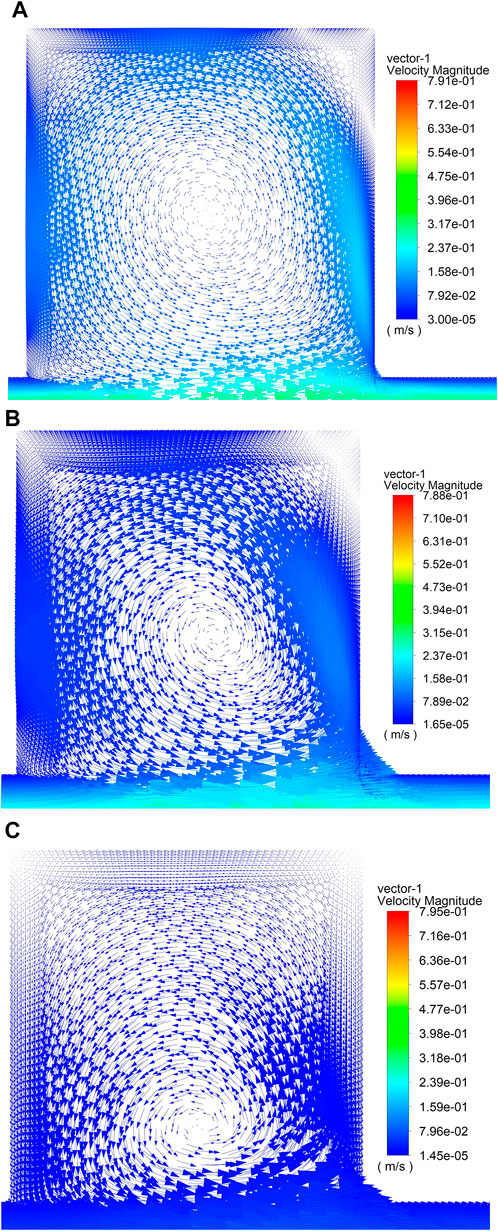
FIGURE 6. Velocity field in cavity for λ/d = 4 at Re = 5 × 10⁴ (A) w = 500 μm; (B) w = 250 μm; (C) w = 50 μm.
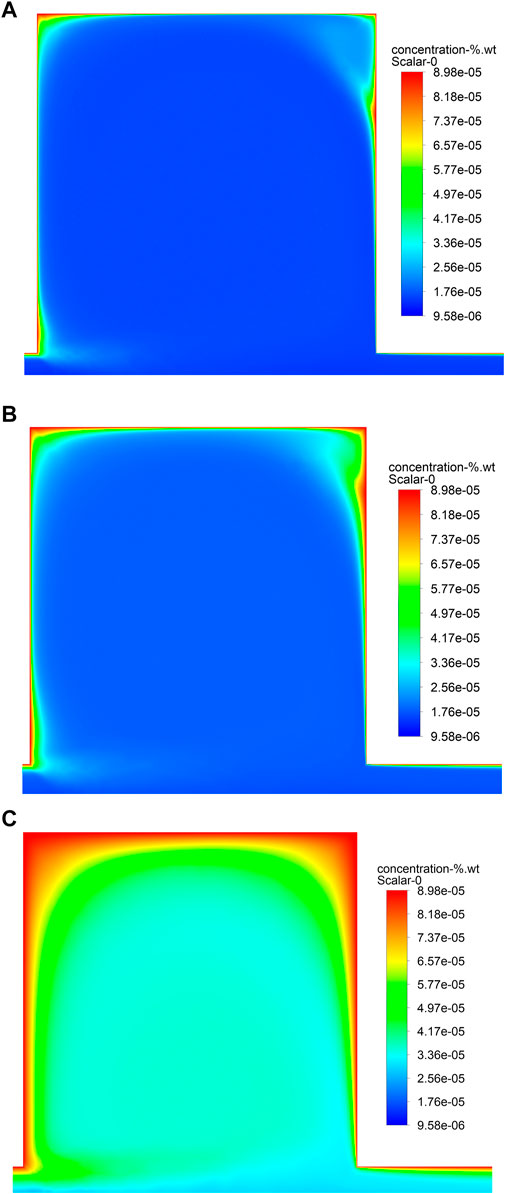
FIGURE 7. Iron concentration distribution in cavity for λ/d = 4 at Re = 5 × 10⁴ (A) w = 500 μm; (B) w = 250 μm; (C) w = 50 μm.
The size of the crest can impose influence on the iron transfer at crest wall since it is depended by the distribution of K along the crest wall. The averaged coefficient Kcr of each rough geometry are given in case of Re from 5 × 10³ to 105 in Figure 8, and are compared with Ks of smooth wall. It is shown that, as the flow velocity increased, Kcr increased obviously and the values are much greater than Ks. At the same ratio of λ/d, value of Kcr is larger as the cavity has a smaller size. For the same cavity size, value of Kcr is smaller with higher ratio of λ/d, which represents a longer crest.
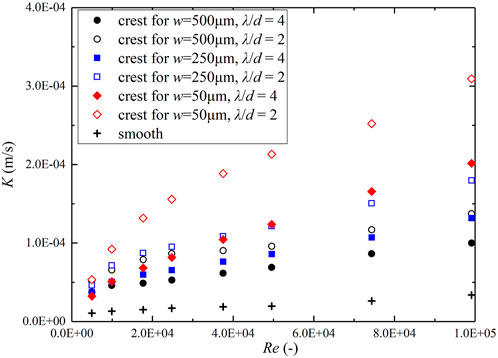
FIGURE 8. Mass transfer coefficient on crest wall and smooth wall, Re from 5 × 10³ to 105.
The distribution of concentration at the first node, C0, along the crest wall depends not only on the flow velocity, but also on the crest length. Figure 9 gives the distributions of (Cw−C0) along the crest walls for d = 500 μm and for Re = 5 × 10³, 2.5 × 10⁴ and 5 × 10⁴. At the same Re, compared with the relatively uniform distribution in the case of the smooth pipe, C0 has much lower values at the front of the crest wall, while it increases along the crest, then it stays very close to Cw until the end of the crest wall. This distribution is similar to that of the entrance part of the smooth pipe wall. Hence, higher local mass transfer coefficients K are obtained at the front of crest wall. However, when λ/d = 4, which represents the horizontal length of crest is three times of that of λ/d = 2, K remains at a low level at the end of crest wall, so the average coefficient Kcr owns a lower value. The distributions of turbulent kinetic energy at the first node along the crest are given in Figure 10, for d = 500 μm and for Re = 5 × 10³, 2.5 × 10⁴, and 5 × 10⁴. It is shown that, higher values of turbulent kinetic energy are obtained at higher flow velocities, the turbulent kinetic energy decreases from the front part of crest wall and then keeps at a stable level until the end of crest wall. It could be observed that the turbulent kinetic profiles are similar to those of (Cw−C0), thus it is reasonable to relate the near-wall mass transfer rate to the near-wall turbulence level.
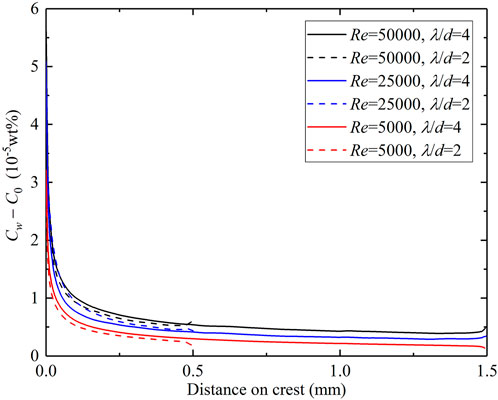
FIGURE 9. Distribution of (Cw−C0) on the crest wall (d = 500 μm).
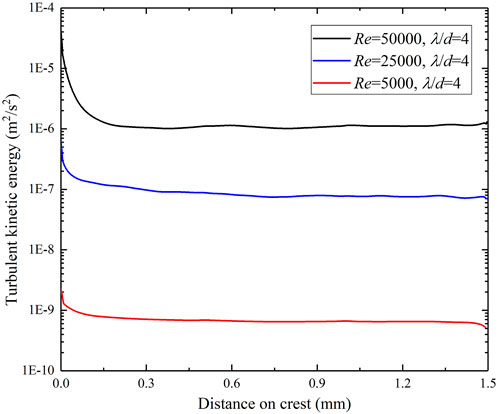
FIGURE 10. Distribution of turbulent kinetic energy on the crest wall (d = 500 μm).
By calculating the mass transfer coefficients along the cavity walls and crest wall, the averaged coefficient Kr on a periodic length λ is determined for each rough geometry. The obtained Sherwood number for roughened walls Shr are correlated with Sc and Re by Eq. 5, which is shown in Figure 11. Assuming that the correlation expression for Shr has the same exponent values on Re and Sc as in Eq. 16, Table 3 gives the correlative coefficient a for different cases. The value of a ranges from 1.810 to 2.357 for the correlations, which is thought to be a geometry-dependent coefficient for mass transfer in this study.
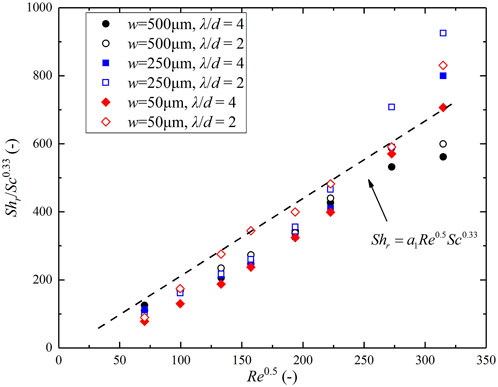
FIGURE 11. Shr/Sc0.33 versus Re0.5 for iron transfer, Re from 5 × 10³ to 105.
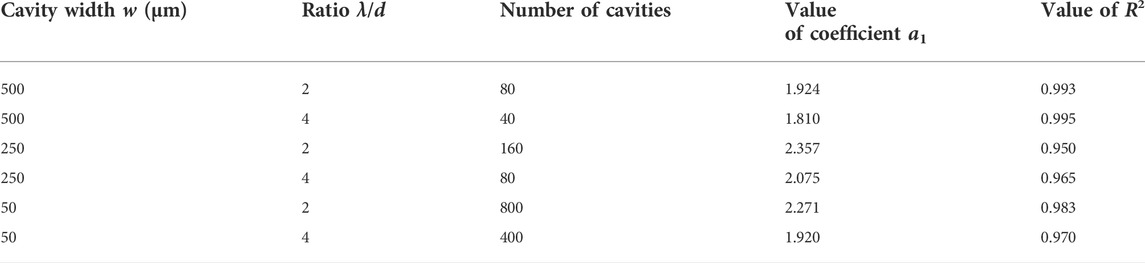
TABLE 3. Values of coefficient a in correlations for different roughness walls.
Effect of surface roughness
The mass transfer enhancement phenomenon caused by the roughen walls was described by the rough-to-smooth ratio Kr/Ks. The values of Kr/Ks for iron mass transfer in LBE are plotted against the dimensionless roughness number e+ in Figure 12. At Sc = 438, for each rough geometry, Kr/Ks increased from near two to approximately six as e+ increased. It should be noticed that for the same rough geometry, the increase of e+ is due to the rise of flow velocity. Hence, Kr/Ks has low dependence on e+ but has great dependence on the flow velocity. In previous reported researches, the mass transfer similarity functions have been developed and Kr/Ks was characterized under different roughness regimes depending on e+ (Dawson and Trass, 1972; Postlethwaite and Lotz, 1988). However, the same approach cannot be adopted to analyze the results in this study, more parameters are required to characterize Kr/Ks. The difference between the results in previous studies and in this study can be explained from several aspects. First, the properties of fluid are involved in the definition of e+, which could induce a great different range of e+. Secondly, the Schmidt number characterizes the mass transfer properties of the species in fluid, the value is relatively much lower in this study comparing with Sc = 2,000–5,000 in previous reported researches. Moreover, in this study, Kr are determined by averaging the values along the cavity wall and crest wall in a roughness period, which is quite different from the electrochemical method.
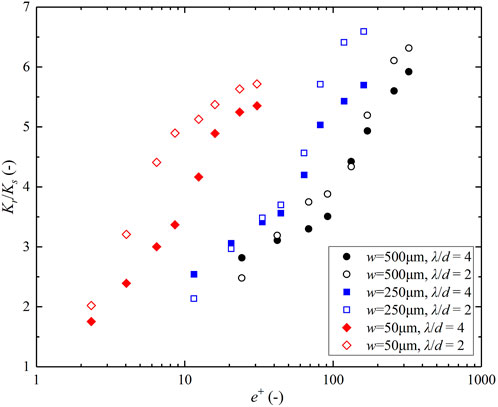
FIGURE 12. Kr/Ks versus e+, Re from 5 × 10³ to 105.
In previous sections, the dimension and geometry of the crest and cavity are found to have considerable influence on C0. The value of Kr is actually dominated by the value of Kcr. For this reason, a correlation of Kr/Ks is proposed with the following parameters: dimensionless roughness number e+, Reynolds number Re and the geometrical ratio (λ-d)/λ:
In the correlation expression, the value of the first constant b1 is one since it is the asymptotic value of Kr/Ks as e+ and Re tend to zero, which means that the mass transfer behavior on rough walls is similar to that of smooth wall. The values of Kr/Ks are plotted by using Eq. 18 in Figure 13, fitting values of correlative constants in Eq. 18 are obtained with a deviation within 4%. Thus, the mass transfer enhancement is well correlated for Re ranging from 5 × 10³ to 105:
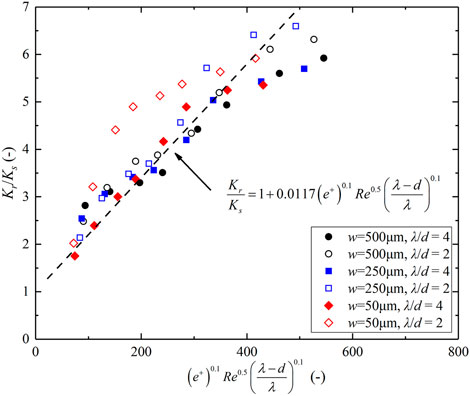
FIGURE 13. Kr/Ks versus
The exponent values on e+ and Re are, respectively 0.1 and 0.5, which is consistent with the results that e+ has less contribution while the flow velocity has higher contribution on Kr/Ks. To a certain degree, the mass transfer enhancement is also affected by the geometrical ratio of the crest. The effect of Sc is not included in the correlation since all predicted results are obtained at the same Sc = 438.
Conclusion
The Iron mass transfer on roughened walls in LBE turbulent pipe flow is studied by using CFD code. Steady-state simulations are performed with the LRN k-ε model. Based on the simulation results, the following main conclusion can be drawn:
(1) The mass transfer coefficient of iron from wall to LBE bulk fluid depends on the distribution of the near-wall iron concentration, which is highly affected by the near-wall flow velocity magnitude. Higher flow velocity induces higher mass transfer rate from the wall to fluid.
(2) Under the same Re condition, the local mass transfer is strongly affected by the roughness dimension. The mass transfer rate in the cavity of smaller size is lower due to the relatively lower velocity magnitude, while the mass transfer rate at crest wall has higher value when the crest length is shorter. The averaged mass coefficient Kr is dominated by the value Kcr, which has higher value than Ks.
(3) Based on the predicted results, mass transfer correlations relating Sh, Re and Sc are established both for smooth wall and roughened walls at Sc = 438 and Re ranging from 5 × 10³ to 105. The mass transfer enhancement induced by roughened wall is confirmed through the computed data.
(4) The ratio Kr/Ks ranges from about 2 to 6, effects of different parameters on Kr/Ks are analyzed. A correlation is proposed and it indicates that the mass transfer enhancement has a higher dependence on Reynolds number than the dimensionless roughness number. The effect of the geometrical ratio of the crest is also included.
Further work is still needed to make progress in understanding the iron mass transfer in steel dissolution/corrosion phenomenon in LBE flow. Other factors, such as roughness types (k-type, V-grooved, and irregular roughness), Schmidt numbers (which varies with LBE working temperature) could be included in further investigation. The method and results obtained in this work could provide some values for the future numerical investigations on steel corrosion in LBE.
Data availability statement
The original contributions presented in the study are included in the article/supplementary material, further inquiries can be directed to the corresponding author.
Author contributions
XC: Writing–original draft; methodology; investigation. TW: Concept; software; methodology; writing–review and editing.
Conflict of interest
Author TW was employed by the company Institute of Modern Physics, Chinese Academy of Sciences.
The remaining author declares that the research was conducted in the absence of any commercial or financial relationships that could be construed as a potential conflict of interest.
Publisher’s note
All claims expressed in this article are solely those of the authors and do not necessarily represent those of their affiliated organizations, or those of the publisher, the editors and the reviewers. Any product that may be evaluated in this article, or claim that may be made by its manufacturer, is not guaranteed or endorsed by the publisher.
References
Abella, J., Verdaguer, A., Colominas, S., Ginestar, K., and Martinelli, L. (2011). Fundamental data: Solubility of nickel and oxygen and diffusivity of iron and oxygen in molten LBE. J. Nucl. Mater.415 (3), 329–337. doi:10.1016/j.jnucmat.2011.04.036
Ballinger, R. G., and Lim, J. (2004). An overview of corrosion issues for the design and operation of high-temperature lead- and lead-bismuth-cooled reactor systems. Nucl. Technol.147 (3), 418–435. doi:10.13182/NT04-A3540
Barbier, F., Benamati, G., Fazio, C., and Rusanov, A. (2001). Compatibility tests of steels in flowing liquid lead-bismuth. J. Nucl. Mat. 295 (2-3), 149–156. doi:10.1016/S0022-3115(01)00570-0
Benamati, G., Gessi, A., and Zhang, P. (2006).Corrosion experiments in flowing LBE at 450°C. J. Nucl. Mater.356 (1-3), 198–202. doi:10.1016/j.jnucmat.2006.05.035
Berger, F. P., and Hau, F. L. (1977). Mass transfer in turbulent pipe flow measured by the electrochemical method. Int. J. Heat Mass Transf.20 (11), 1185–1194. doi:10.1016/0017-9310(77)90127-2
Berger, F. P., Hau, K. F., and Hau, F. L. (1979). Local mass/heat transfer distribution on surfaces roughened with small square ribs. Int. J. Heat Mass Transf.22 (12), 1645–1656. doi:10.1016/0017-9310(79)90081-4
Chen, G., Ju, N., Lei, Y., Wang, D., Zhu, Q., and Li, T. (2019).Corrosion behavior of 410 stainless steel in flowing lead-bismuth eutectic alloy at 550 °C. J. Nucl. Mater.522, 168–183. doi:10.1016/j.jnucmat.2019.05.029
Chien, K. Y. (1982). Predictions of channel and boundary-layer flows with a low-Reynolds-number turbulence model. AIAA J.20 (1), 33–38. doi:10.2514/3.51043
Davis, C., and Frawley, P. (2009). Modelling of erosion-corrosion in practical geometries. Corros. Sci.51 (4), 769–775. doi:10.1016/j.corsci.2008.12.025
Dawson, D. W., and Trass, O. (1972). Mass transfer at rough surfaces. Int. J. Heat Mass Transf.15 (7), 1317–1336. doi:10.1016/0017-9310(72)90015-4
Del Giacco, M., Weisenburger, A., and Mueller, G. (2014). Fretting corrosion of steels for lead alloys cooled ADS. J. Nucl. Mater.450 (1-3), 225–236. doi:10.1016/j.jnucmat.2013.07.005
Doubková, A., Di Gabriele, F., Brabec, P., and Keilová, E. (2008). Corrosion behavior of steels in flowing lead-bismuth under abnormal conditions. J. Nucl. Mater.376 (3), 260–264. doi:10.1016/j.jnucmat.2008.02.033
Feng, W., Zhang, X., Cao, L., Wang, S., and Chen, H. (2021). Development of oxygen/corrosion product mass transfer model and oxidation-corrosion model in the lead-alloy cooled reactor core. Corros. Sci.190, 109708. doi:10.1016/j.corsci.2021.109708
Fujisawa, N., Uchiyama, K., and Yamagata, T. (2017). Mass transfer measurements on periodic roughness in a circular pipe and downstream of orifice. Int. J. Heat Mass Transf.105, 316–325. doi:10.1016/j.ijheatmasstransfer.2016.10.002
Fujisawa, N., Yamagata, T., and Nagasaki, T. (2020). Mass transfer behavior on sinusoidal wavy walls at different Reynolds numbers. Int. Commun. Heat Mass Transf.110, 104383. doi:10.1016/j.icheatmasstransfer.2019.104383
Gong, X., Short, M. P., Auger, T., Charalampopoulou, E., and Lambrinou, K. (2022). Environmental degradation of structural materials in liquid lead- and lead-bismuth eutectic-cooled reactors. Prog. Mater. Sci.126, 100920. doi:10.1016/j.pmatsci.2022.100920
Grifoll, F., Farriol, X., and Giralt, F. (1986). Mass transfer at smooth and rough surfaces in a circular Couette flow. Int. J. Heat Mass Transf.29 (12), 1911–1918. doi:10.1016/0017-9310(86)90009-8
Heinzel, A., Weisenburger, A., and Müller, G. (2014). Corrosion behavior of austenitic steels in liquid lead bismuth containing 10-6 wt% and 10-8 wt% oxygen at 400-500 °C. J. Nucl. Mat. 448 (1-3), 163–171. doi:10.1016/j.jnucmat.2014.01.046
Ikarashi, Y., Taguchi, S., Yamagata, T., and Fujisawa, N. (2017).Mass and momentum transfer characteristics in and downstream of 90° elbow. Int. J. Heat Mass Transf.107, 1085–1093. doi:10.1016/j.ijheatmasstransfer.2016.11.014
Ilinc̆ev, G., Kárník, D., Paulovic̆, M., and Doubková, A. (2004).The impact of the composition of structural steels on their corrosion stability in liquid Pb-Bi at 500 and 400 °C with different oxygen concentrations. J. Nucl. Mater.335 (2), 210–216. doi:10.1016/j.jnucmat.2004.07.015
Ito, K., and Sakai, T. (2004). Oxygen diffusion analysis of lead-bismuth-cooled natural-circulation reactor. J. Nucl. Sci. Technol.41 (3), 252–259. doi:10.1080/18811248.2004.9715482
Jones, W. P., and Launder, B. E. (1972). The prediction of laminarization with a two-equation model of turbulence. Int. J. Heat Mass Transf.15 (2), 301–314. doi:10.1016/0017-9310(72)90076-2
Lam, C. K. G., and Bremhorst, K. (1981).A modified form of the k-ε model for predicting wall turbulence. J. Fluids Eng. 103 (3), 456–460. doi:10.1115/1.3240815
Lambrinou, K., Charalampopoulou, E., Van der Donck, T., Delville, R., and Schryvers, D. (2017).Dissolution corrosion of 316L austenitic stainless steels in contact with static liquid lead-bismuth eutectic (LBE) at 500 °C. J. Nucl. Mater.490, 9–27. doi:10.1016/j.jnucmat.2017.04.004
Launder, B. E., and Sharma, B. I. (1974). Application of the energy-dissipation model of turbulence to the calculation of flow near a spinning disc. Lett. Heat Mass Transf.1 (2), 131–137. doi:10.1016/0094-4548(74)90150-7
Li, N. (2002). Active control of oxygen in molten lead-bismuth eutectic systems to prevent steel corrosion and coolant contamination. J. Nucl. Mater.300 (1), 73–81. doi:10.1016/S0022-3115(01)00713-9
Lolja, S. A. (2005). Momentum and mass transfer on sandpaper-roughened surfaces in pipe flow. Int. J. Heat Mass Transf.48 (11), 2209–2218. doi:10.1016/j.ijheatmasstransfer.2004.12.030
Marino, A., Lim, J., Keijers, S., Deconinck, J., and Aerts, A. (2018). Numerical modeling of oxygen mass transfer in a wire wrapped fuel assembly under flowing lead bismuth eutectic. J. Nucl. Mater.506, 53–62. doi:10.1016/j.jnucmat.2017.12.017
Mobarak, A. A., Farag, H. A., and H.Sedahmed, G. H. (1997). Mass transfer in smooth and rough annular ducts under developing flow conditions. J. Appl. Electrochem. 27, 201–207. doi:10.1023/A:1018408125105
Nešić, S., Postlethwaite, J., and Bergstrom, D. J. (1992). Calculation of wall-mass transfer rates in separated aqueous flow using a low Reynolds number k-ε model. Int. J. Heat. Mass Transf. 35 (8), 1977–1985. doi:10.1016/0017-9310(92)90200-C
Nešić, S. (2006). Using computational fluid dynamics in combating erosion-corrosion. Chem. Eng. Sci.61 (12), 4086–4097. doi:10.1016/j.ces.2006.01.052
Nešiĉ, S., and Postlethwaite, J. (1991). Hydrodynamics of disturbed flow and erosion-corrosion. Part I - single-phase flow study. Can. J. Chem. Eng. 69 (3), 698–703. doi:10.1002/cjce.5450690311
OECD (2015). Handbook on lead-bismuth eutectic alloy and lead properties, materials compatibility, thermal-hydraulics and technologies. Paris, France No: OECD/NEA, 7268.
Postlethwaite, J., and Lotz, U. (1988). Mass transfer at erosion-corrosion roughened surfaces. Can. J. Chem. Eng. 66 (1), 75–78. doi:10.1002/cjce.5450660111
Poulson, B. (1999). Complexities in predicting erosion corrosion. Wear 233-235, 497–504. doi:10.1016/S0043-1648(99)00235-5
Poulson, B. (1990). Mass transfer from rough surfaces. Corros. Sci. 30 (6-7), 743–746. doi:10.1016/0010-938X(90)90037-6
Selman, J. R., and Tobias, C. W. (1978). Mass-transfer measurements by the limiting-current technique. Adv. Chem. Eng. 10, 211–318. doi:10.1016/S0065-2377(08)60134-9
Sookhak Lari, K. S., van Reeuwijk, M., and Maksimović, Č. (2013). The role of geometry in rough wall turbulent mass transfer. Heat. Mass Transf. 49, 1191–1203. doi:10.1007/s00231-013-1165-4
Tantirige, S. C., and Trass, O. (1984). Mass transfer at geometrically dissimilar rough surfaces. Can. J. Chem. Eng. 62 (4), 490–496. doi:10.1002/cjce.5450620407
Tsisar, V., Schroer, C., Wedemeyer, O., Skrypnik, A., and Konys, J. (2018).Effect of structural state and surface finishing on corrosion behavior of 1.4970 austenitic steel at 400 and 500 °C in flowing Pb-Bi eutectic with dissolved oxygen. J. Nucl. Eng. Radiat. Sci. 4 (4), 041001. doi:10.1115/1.4040422
Wan, T., and Saito, S. (2018). Flow-accelerated corrosion of type 316L stainless steel caused by turbulent lead-bismuth eutectic flow. Metals 8 (8), 627. doi:10.3390/met8080627
Yamagata, T., and Fujisawa, N. (2021). Experimental and numerical studies of flow field and mass transfer phenomena on sinusoidal wavy walls. Heat. Mass Transf. 57, 715–722. doi:10.1007/s00231-020-02975-x
Zhang, J. (2009). A review of steel corrosion by liquid lead and lead-bismuth. Corros. Sci.51 (6), 1207–1227. doi:10.1016/j.corsci.2009.03.013
Zhang, J., Hosemann, P., and Maloy, S. (2010). Models of liquid metal corrosion. J. Nucl. Mater.404 (1), 82–96. doi:10.1016/j.jnucmat.2010.05.024
Zhang, J. (2014). Lead-bismuth eutectic (LBE): A coolant candidate for gen. IV advanced nuclear reactor concepts. Adv. Eng. Mat. 16, 349–356. doi:10.1002/adem.201300296
Zhang, J., and Li, N. (2008). Review of the studies on fundamental issues in LBE corrosion. J. Nucl. Mater.373 (1-3), 351–377. doi:10.1016/j.jnucmat.2007.06.019
Zhang, Y., Zhang, D., Wang, C., Lan, Z., Tian, E., Su, G., et al. (2021). Oxygen transport analysis in lead-bismuth eutectic coolant for solid-phase oxygen control. Ann. Nucl. Energy154, 108128. doi:10.1016/j.anucene.2021.108128
Zhao, W., and Trass, O. (1997). Electrochemical mass transfer measurements in rough surface pipe flow: Geometrically similar V-shaped grooves. Int. J. Heat Mass Transf.40 (12), 2785–2797. doi:10.1016/S0017-9310(96)00346-8
Nomenclature
Abbreviations
a1, a2, a3 correlative constants in correlation linking Sh to Sc and Re
b1, b2, b3, b4, b5 correlative constants in correlation of Kr/Ks
C concentration in Fick’s law, kmol/m3
C1, C2, Cμ constants in transport equations of k and ɛ
Cb, Cw, C0 species concentration in bulk fluid, at wall, and at the first node, kmol/m3
d depth of cavity, m
D diameter of pipe, m
Dm molecular diffusion coefficient, m2/s
Dε damping term of turbulent dissipation rate, m2/s3
e roughness height, m
e+ dimensionless roughness height
f friction factor
f1, f2, fμ damping functions in Launder-Sharma LRN model
J mass flux of iron, kmol/(m2 s)
k turbulent kinetic energy, m2/s2
K mass transfer coefficient, m
l characteristic length, m
L Length of pipe, m
M molar mass of iron, kg/mol
n normal distance to wall in Fick’s law, m
Pk production rate of turbulence, kg/(m s3)
ΔP Pressure drop through the pipe, Pa
R radius of pipe, m
Re, Ret Reynolds number and turbulent Reynolds number
Sc Schmidt number
Sh Sherwood number
t time, s
u, uj velocity and its components in transport equation of ɛ*, m/s
u* friction velocity
U velocity of stream flow, m/s
w width of cavity, m
xj Cartesian coordinates, m
y distance from the wall, m
y0 distance of the first node from the wall, m
y+ dimensionless distance from the wall
Greek symbols
δv, δd Thickness of viscous layer and diffusion boundary layer, m
ɛ, ɛ* origin and modified dissipation rate of turbulent kinetic energy, m2/s3
λ periodic length of adjacent cavities, m
μ molecular dynamic viscosity, kg/(m s)
μt turbulent viscosity, kg/(m s)
ρ, ρFe density of fluid and density of iron, kg/m3
σk, σɛ constants in transport equations of k and ɛ
Subscripts
cr crest of roughness
r rough wall
s smooth wall
Keywords: LBE, corrosion, mass transfer, wall roughness, numerical simulation
Citation: Chen X and Wan T (2022) CFD analysis of Fe transfer on roughened wall caused by turbulent lead-bismuth eutectic flow. Front. Energy Res. 10:1005171. doi: 10.3389/fenrg.2022.1005171
Received: 28 July 2022; Accepted: 29 August 2022;
Published: 15 September 2022.
Edited by:
Wenzhong Zhou, Sun Yat-sen University, ChinaReviewed by:
Yaou Shen, Laboratory of Reactor System Design Technology (LRSDT), ChinaBo Pang, Shenzhen University, China
Copyright © 2022 Chen and Wan. This is an open-access article distributed under the terms of the Creative Commons Attribution License (CC BY). The use, distribution or reproduction in other forums is permitted, provided the original author(s) and the copyright owner(s) are credited and that the original publication in this journal is cited, in accordance with accepted academic practice. No use, distribution or reproduction is permitted which does not comply with these terms.
*Correspondence: Tao Wan, d2FudGFvQGltcGNhcy5hYy5jbg==