 Chao Yang
 Qing Han
- Shengli Oilfiled, Dongying, China
In this paper, FLUENT software coupled with the chemical reaction mechanism is used to study the ignition characteristics of methane-air mixtures at low temperature. Variations of the main free radical concentrations, the critical conditions for a successful ignition and the chemical reaction rate of each elementary reaction for a failure ignition are obtained, respectively. Results indicate that the consumption of methane immediately affects the concentration distribution of carbon monoxide, which presents the opposite relationship with that of methane. Mass fractions of the intermediate products and H, O free radicals are low in the burnt zone and unburnt zone, whereas reach the maximum on the flame front. OH is not only the intermediate free radical, but also the combustion product remained by the intermediate reactions. At a low temperature of 150 K, the critical radius and temperature of methane ignition are 4.6 mm and 1180 K, respectively. When ignition radius is smaller than the critical value, the failed ignition of methane is caused by the termination of the elementary reactions: R8: H + O2 = OH + O, R9: OH + O = O2 + H, R12: O + H2O = 2OH and R13: 2OH = O + H2O. However, when ignition temperature is lower than the critical value, because of the failed initiation of elementary reaction R1: CH4 = CH3 + H, the combustion of methane is not occurred.
1 Introduction
With an attention to environmental protection and increased energy demand all over the world, and the increasingly shortage of traditional energy such as oil, the development and utilization of liquid natural gas (LNG) and oxygen-bearing coal-bed methane have shown significant economic and social benefits (Gao et al., 2010; Hammond and Grady, 2017; Mikolajkov et al., 2017; Song et al., 2017). However, in the LNG storage and low temperature liquefaction of oxygen-bearing coal-bed methane, the methane concentration in the gas phase is within the explosion limit, which has an explosion risk and results in significant economic losses and casualties (Cui et al., 2015). At present, some experts at home and abroad have conducted some research on the combustion characteristics of combustible gases at low temperatures. Karim et al. (1984) built a cylindrical stainless steel tube, and experimentally measured the lower flammability limit of methane at initial temperature of 143–298 K. Wierzba et al. (1990) used the same experimental device to measure the upper flammability limit of combustible gases at normal pressure and low temperature. The temperature condition was from room temperature to 213 K. Then, Wierzba et al. (1992) measured the flammability limits of hydrogen and some fuel mixtures at low temperature. Among, the initial temperature range for the upper flammability limits was from room temperature to 213 K, while for the lower flammability limits was from room temperature to 173 K. Li et al. (2011) from the Chinese Academy of Science have experimentally measured the flammability limits of different methane/nitrogen mixtures at a temperature range from 150 to 300 K. In recent years, our research team built an explosion test setup which was able to withstand a temperature as low as 113 K, and conducted a methane explosion experiment at different low initial temperatures of 123–273 K, different initial pressure of 0.1–0.9 MPa and different equivalence ratios. The flammability limit and the MIE of methane at low initial temperatures were obtained (Cui et al., 2016a; Cui et al., 2016b).
To sum up, the above research results are focused on macroscopic explosion characteristics, such as flammability limits, minimum ignition energy, explosion pressure, and temperature. However, the characteristics of the ignition source itself is rarely studied. For the combustion process of methane in a confined vessel, it can be regarded as an unsteady hydrodynamic phenomenon with detailed chemical reactions. The ignition initiation stage is the beginning of the combustion, accompanied by the rapid growth of the flame kernel and the occurrence of a large number of chemical chain reactions. The current study does not give the critical value for a successful ignition. Moreover, variations in concentrations of reactants, products, and free radicals generated by chemical reactions are also not involved. Therefore, focusing on the ignition initiation characteristics of combustible gases has important implications for clarifying the nature of ignition.
For the combustion process of combustible gases, the most intuitive and effective way of research is experimental measurement. However, during the experiment, all the parameters that can be measured immediately are the macroscopic phenomena of combustion: combustion temperature and pressure, flame propagation speed, variations of flame shape and so on. However, some microscopic features such as variations of the detailed chemical reactions, critical values for ignition and the flow field during the flame propagation are hardly presented by experiment. Moreover, due to the special nature of low-temperature conditions, it is difficult to set a transparent observation window on the combustion vessel (caused by the cooling method and icing at low temperatures). Therefore, it is difficult to study the combustion of methane under low temperature conditions using experimental method. Numerical simulation is an important tool for studying the effect of some factors on the combustion characteristics which are hardly test or controlled by experimental method. Some researchers have studied the ignition characteristics by numerical methods. Yuasa et al. (2002) studied the influence of the energy retention on the minimum ignition energy using a two-dimensional numerical analysis. Kravchik and Sher (1994) studied ignition characteristic and flame propagation in methane/air mixture by numerical methods. Han et al. (2010) studied the spark ignition characteristics of methane/air mixture using detailed chemical reaction mechanisms. The ignition behavior of a hydrogen/air mixture was also studied by them using the same numerical model while heat loss was considered (Han et al., 2011). In Cui et al. (2018) study, premixed methane-air flame propagation in a confined vessel at low initial temperature was simulated using a multi-step chemical reaction mechanism. As explained above, the numerical simulation method can effectively study the combustion characteristics of combustible gas.
Therefore, in this paper, FLUENT software coupled with the chemical reaction mechanism is used to study the initiation process of methane combustion at low temperature. The variations of the main free radical concentrations during the growth of flame kernel are obtained. The critical ignition radius and critical ignition temperature for a successful ignition at low temperature are also calculated. Through the study on the chemical reaction rate of each elementary reaction for a failed ignition, the elementary reactions which induce the termination of the chemical reaction are obtained. The research results have important safety significance for LNG storage and low-temperature liquefaction production of oxygen-containing coalbed methane. In addition, the research results can be used for the research and development of LNG fire extinguishing agents, which can achieve the purpose of extinguishing fire by interrupting the chemical reaction chain of methane combustion at low temperature.
2 Numerical methods
2.1 Definition of the initiation stage of methane combustion
According to the standard BS EN 1839:2003, an explosion is considered to occur when the pressure rise in the confined vessel is 5% of the initial pressure. Based on this criterion, the initiation stage of methane combustion is defined as following: from the moment of ignition, to the end when the combustion pressure at the center of the right end wall of the confined space increases by 5% of the initial pressure. As shown in Figure 1, the black solid line shows the variation of explosion pressure with ignition time. The red dashed line indicates that the explosion pressure is 1.05 times of the initial pressure. The intersection of the red dashed line and the black solid line is the moment when explosion occurs. The stage between the start of ignition and the moment when explosion occurs is the initiation stage of methane combustion. As seen from the figure, the ignition initiation period is from 0 to 3.5 ms.
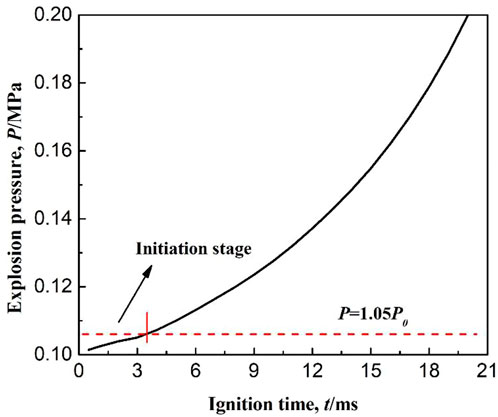
FIGURE 1. Definition of the ignition initiation stage.
2.2 Mathematical model
The equations describing the methane combustion at low temperatures are completely consistent with those previously published in Ref. (Cui et al., 2018), which are not repeated here. The ignition problem in the central axis of a cylindrical vessel can be considered as a central symmetry problem centered on the axis. Because of the large amount of 3D simulation calculations, the model is simplified to a two-dimensional problem, which has been proved to be effective to model the flame propagation (Dunn-Rankin et al., 1988; Marra and Continillo, 1996; Kaltayev et al., 2000; Xiao et al., 2014). The size of the computational domain is exactly the same with the explosion vessel used in the literature (Cui et al., 2016a; Cui et al., 2016b), as also shown in Figure 2. In the figure, X represents the height direction of the cylindrical explosion vessel, and Y represents the diameter direction of the cylindrical explosion vessel. In the process of simulation, the size of the grid directly affects the accuracy of the calculation results and the calculation time. Therefore, before the calculation, the size of the grid should be studied first to obtain the optimal one, as shown in Figure 3. The study on grid optimization in this paper is consistent with that in the previously published paper (Cui et al., 2018) which will not be repeated here.
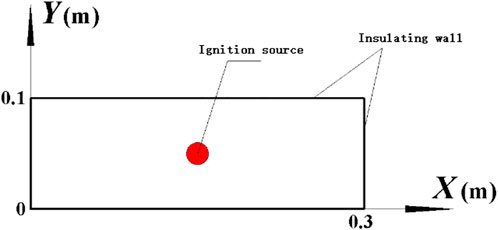
FIGURE 2. Computational domain.
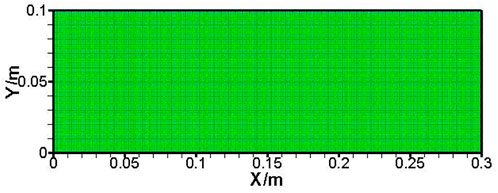
FIGURE 3. Mesh generation.
2.3 Chemical kinetics mechanism
In this paper, the eddy dissipation concept (EDC) model is chosen for solving because fluid dynamics calculation is coupled with chemical reaction mechanism. A simplified chemical kinetics mechanism are imported in FLUENT software for related calculations, as shown in Table 1 (Hu et al., 2000).
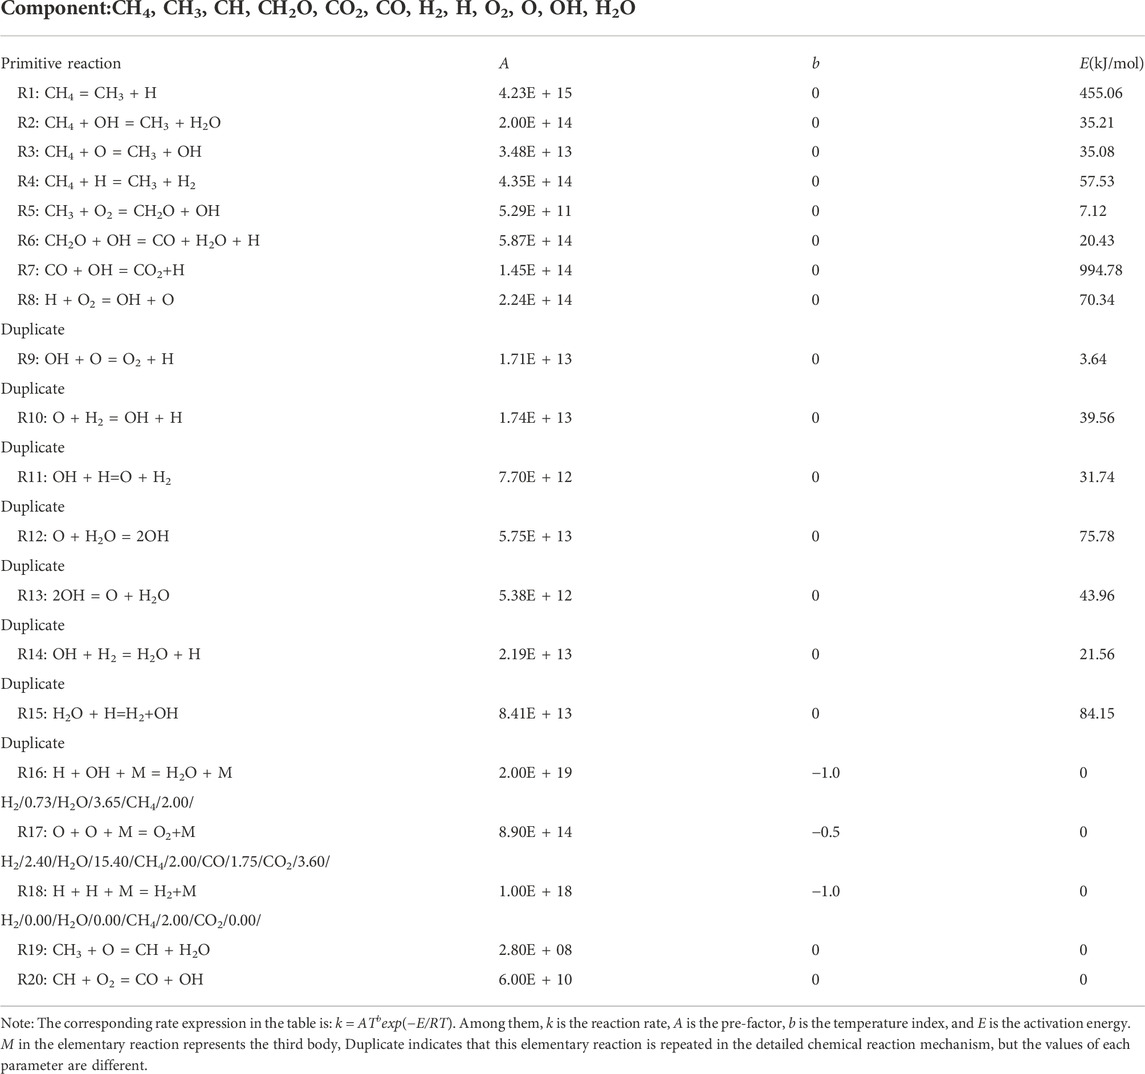
TABLE 1. Chemical kinetics mechanism of methane.
2.4 Initial and boundary conditions
For the combustion problem in a small confined space, we believe that the combustion is completed in an extremely short time. Therefore, the four walls of the model shown in Figure 2 are all set as adiabatic boundaries. The initial pressure is 0.1 MPa and the initial temperature is 150 K. When the equivalence ratio is 1, the mass fraction of methane is 0.053, mass fraction of oxygen is 0.21, mass fraction of nitrogen is automatically calculated in FLUENT and mass fractions of remaining components are all zero. The initial speeds in X and Y directions are also zero.
2.5 Ignition treatment
In this paper, the ignition source is set to a high temperature air mass instead of the actual spark. A circular zone is first created in which the gas consists of CH4, O2, and N2. The ratio of each component is the same as the initial condition. Then, the ignition source is set as a relatively high initial temperature (e.g., 1,400 K). The ignition source is the red circular with a radius r as shown in Figure 2.
The ignition source has two variable parameters: radius r and temperature T, which directly affect whether the combustible gas is ignited successfully. Therefore, by changing the ignition radius and temperature, the critical conditions for ignition are obtained.
2.6 Numerical methods
The finite volume method is used to discretize the corresponding control equations. The standard k-ε model is used for the turbulence equation, coupling with the non-equilibrium wall function method and the volumetric reaction. The SIMPLEC method is used for coupling the pressure and velocity fields. Second-order upwind scheme is used for the convective terms, while the time is advanced by the fully implicit Euler method. The time stepping method is successive over-relaxation. The relaxation factor of pressure, density, momentum and energy is set to 0.3, and the relaxation factor of each component is set to 1. The time step is set to 10−5 s.
3 Results and discussion
3.1 Variations in free radical concentration
For the free radical concentration at the ignition initiation stage, the concentration distribution on the central axis of the confined space is selected. Figure 4 shows the variation of mass fraction of CH4 at different ignition times. The mass fraction of CH4 inside the flame core is almost zero, while on the flame front, the methane concentration gradually increases from the burned zone to the unburned zone. It indicates that the combustion of methane mainly occurs on the flame front. With the increase in ignition time, the burned area and the flame front gradually expands to the surroundings. When the time is 0.5 ms after ignition, the mass fraction of CH4 is not zero in the flame core, indicating that the consumption rate of CH4 is slow at the initial stage. As seen in Table 1, the elementary reactions which promote the consumption of CH4 are mainly R5: CH3 + O2 = CH2O + OH, R6: CH2O + OH = CO + H2O + H, R8: H + O2 = OH + O, and R9: OH + O = O2 + H. The above elementary reactions are participated by free radicals. Due to the initial mass fraction of free radicals is low, the above elementary reactions are inactive and CH4 is consumed slowly at the beginning of ignition. Moreover, the mass fraction of CH3 is large at the beginning of ignition (as seen in Figure 6), which causes the reverse reaction rate of the elementary reactions R2: CH4 + OH = CH3 + H2O and R4: CH4 + H = CH3 + H2 to be larger than the positive reaction rate. With the increase in ignition time (greater than 1.5 ms), the mass fraction of free radicals increases greatly and the mass fraction of CH3 decreases a lot, which increases the consumption rate of methane. In the subsequent combustion process, the mass fraction of CH4 inside the flame core is always equal to zero.
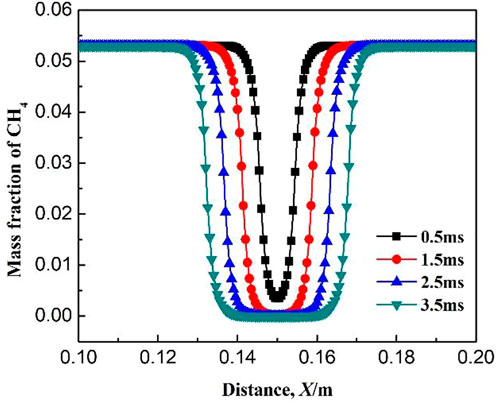
FIGURE 4. Variation of mass fraction of CH4.
Figure 5 shows the variation of mass fraction of CO at different ignition time. The mass fraction of CO reaches the maximum in the burned area. On the flame front, the mass fraction of CO gradually decreases from the burned area to the unburned area. At the beginning of ignition, the mass fraction of CO is low because of the low concentration of free radicals and the slow reaction rate. Subsequently, with the increase in ignition time, the mass fraction of CO reaches the maximum in the flame core. When Figure 4 is compared with Figure 5, it is found that the distribution of mass fraction of methane shows an inverse relationship with that of CO.
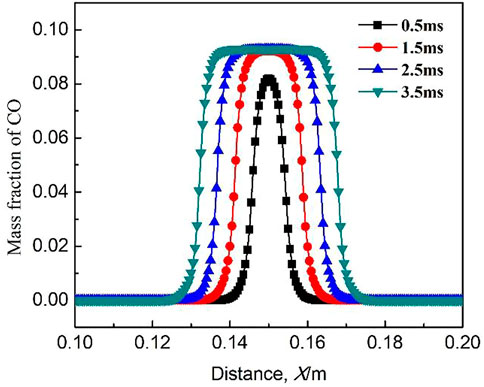
FIGURE 5. Variation of mass fraction of CO.
Figures 6–8 show the variations of mass fraction of important intermediate products CH3, CH2O, and CH. As seen in the figures, the mass fraction of the intermediate products in the burned and unburned areas is low while reaches the maximum on the flame front. It indicates that the chemical reaction takes place on the flame front. At the beginning of ignition, the mass fraction of the intermediate product on the flame front is high. With the increase in ignition time, the mass fraction of the intermediate product on the flame front decreases. The reactions for the generation of CH3 in Table 1 includes R2: CH4 + OH = CH3 + H2O, R3: CH4 + O = CH3 + OH, and R4: CH4 + H = CH3 + H2. The main reaction for the consumption of CH3 is R5: CH3 + O2 = CH2O + OH. At the initial time (0.5 ms), the elementary reactions R2, R3, and R4 occurs severely, whereas elementary reaction R5 occurs gently. Therefore, a large amount of CH3 is generated and accumulated which results in a large mass fraction of CH3 on the flame front. As the combustion continues, the elementary reaction R5 gradually becomes active. Therefore, the generated CH3 is rapidly consumed and its mass fraction on the flame front greatly decreases. The main reaction for the generation of CH2O is R5: CH3 + O2 = CH2O + OH, while the main elementary reaction for the consumption of CH2O is R6: CH2O + OH = CO + H2O + H. As shown in Figure 7, the mass fraction of CH2O on the flame front gradually decreases with ignition time. This is because the elementary reaction R6 is much more reactive than R5. Figure 8 shows the variation of mass fraction of CH. Overall, the mass fraction of CH is very small, on the order of 10−7, indicating that the elementary reactions R19: CH3 + O = CH + H2O and R20: CH + O2 = CO + OH are very weak in the whole combustion process.
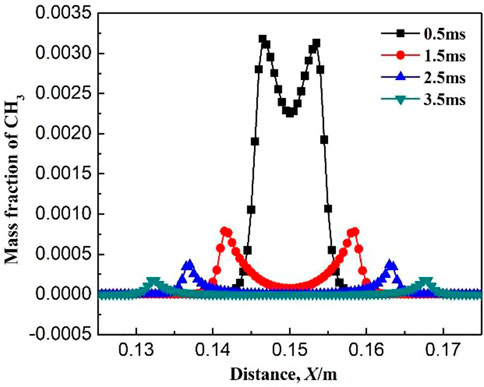
FIGURE 6. Variation of mass fraction of CH3.
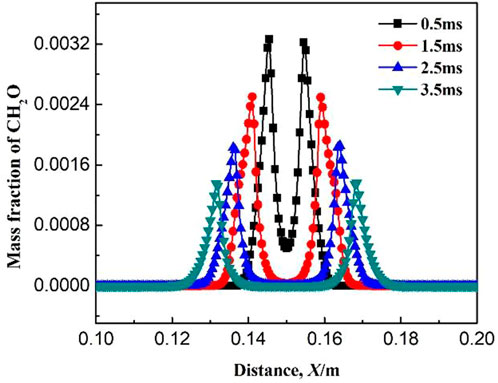
FIGURE 7. Variation of mass fraction of CH2O.
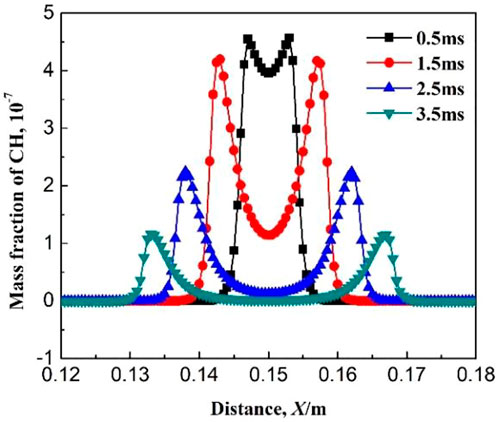
FIGURE 8. Variation of mass fraction of CH.
Figures 9–11 show the variations of mass fraction of the important free radicals H, O, and OH. The distribution of the mass fractions of free radicals H and O is similar to that of the intermediate products. The mass fractions in the burned and unburned areas are both low and reach the maximum on the flame front. At the beginning of ignition, the concentrations of H and O free radicals are low, which lead to slow chemical reaction rates at the initial stage (resulting in slow consumption rates of CH4 and CH3, which is consistent with the above discussion). With the increase in ignition time, the concentrations of free radicals maintain at a high level, indicating that the reaction rate greatly increases. Figure 11 shows the variation of mass fraction of OH. Specially, the mass fraction of OH in the burned zone is not zero, but maintains a high value. As seen in Table 1, the consumption reactions of OH are R2, R6, and R7. The elementary reactions that OH serves as a chain carrier are R9, R11, R13, and R14. Therefore, OH is not only the intermediate free radical which participates in the reaction as the chain carrier, but also the combustion product remained by the intermediate reactions.
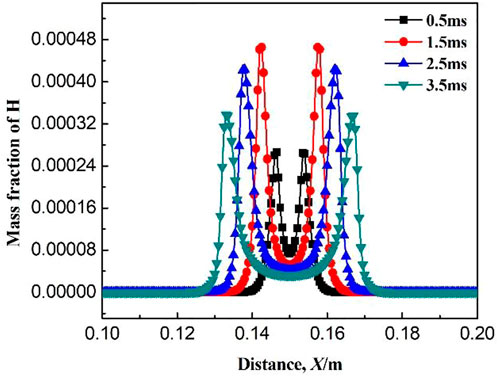
FIGURE 9. Variation of mass fraction of H.
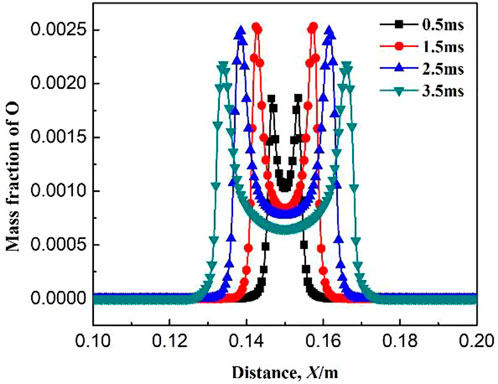
FIGURE 10. Variation of mass fraction of O.
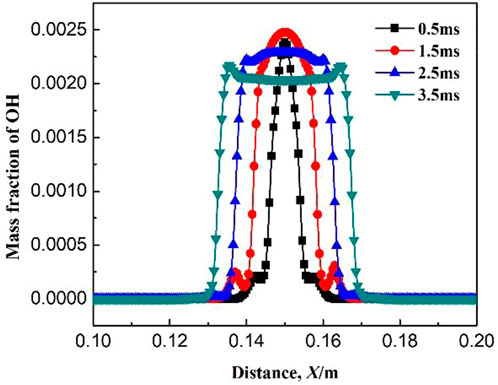
FIGURE 11. Variation of mass fraction of OH.
3.2 Critical conditions for methane ignition at low temperatures
In this paper, the ignition source is a spherical high temperature air mass, of which the temperature and radius are variables. If the ignition temperature is too low or the ignition radius is too small, the combustible gas cannot be successfully ignited. Therefore, there is a minimum ignition temperature or an ignition radius that can ignite methane successfully, i.e., the critical value for a successful ignition. Figure 12 shows the pressure rise in the confined space for different ignition radius r at an initial temperature of 150 K. The pressure is the monitoring data at the center of the right side wall. According to the standard BS EN 1839:2003, the explosion is considered to occur if the pressure rise in a confined space reaches 5% of the initial pressure. As seen in Figure 12, the explosion is considered to occur when the pressure rise curve exceeds ΔP = 5.06 kPa (the initial pressure is 101.3 kPa). When the ignition radius r < 4.6 mm, the pressure rise maintains at a low level, and the maximum pressure rise is less than 1 kPa. Therefore, when the ignition radius r < 4.6 mm, the combustible gas cannot be ignited. However, when the ignition radius r ≥ 4.6 mm, the pressure rise greatly increases and between t = 3 and 4 ms, the pressure rises exceeds 5.06 kPa, indicating that the combustible gas is successfully ignited. In summary, the critical value of the ignition radius at an initial temperature of 150 K is 4.6 mm. As also seen in Figure 12, with an increase in ignition radius, the pressure rise increases. This is because with the increase in ignition radius, the amount of combustible gas that is initially ignited increases. Thus, the heat released increases which induces a larger pressure rise. Therefore, the size of the ignition radius has a large effect on the methane ignition.
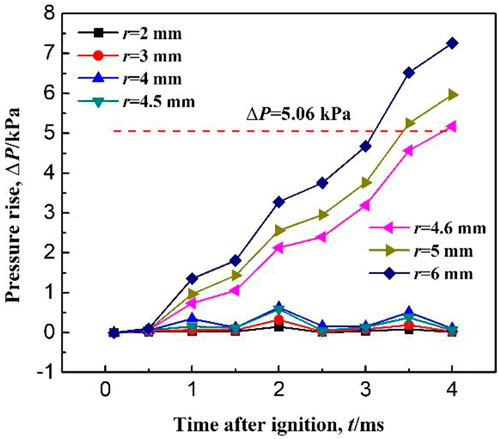
FIGURE 12. Pressure rise for different ignition radius.
Figure 13 shows the pressure rise in the confined space for different ignition temperatures. When the ignition temperature is less than 1180 K, the pressure rise after ignition maintains a low level, and the maximum pressure rise is less than 5.06 kPa, indicating that the combustible gas is not ignited. When the ignition temperature T ≥ 1180 K, the pressure rise increases rapidly and exceeds 5.06 kPa at about 3.5 ms, indicating that the combustible gas is successfully ignited. Therefore, at an initial temperature of 150 K, the critical ignition temperature is 1180 K. As also seen in Figure 13, the pressure rise curves basically coincide for different ignition temperatures, indicating that the ignition temperature has no effect on the methane ignition.
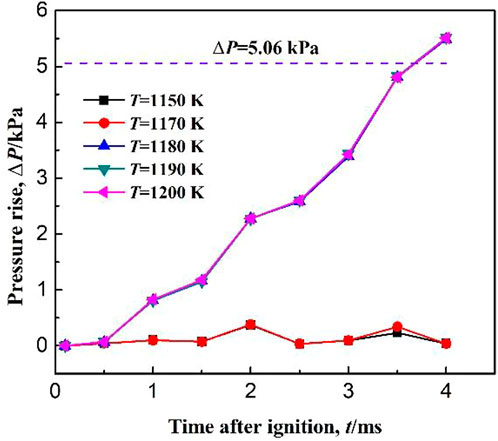
FIGURE 13. Pressure rise for different ignition temperature.
3.3 Terminated elementary reactions when the ignition radius is less than the critical value
Figure 14 shows the variation of flame temperature with ignition time when the ignition radius is 4.5 mm and the initial temperature is 150 K. First, the flame temperature gradually increases with time after ignition, and at the ignition time of 0.06 ms, the temperature reaches a maximum of 1640 K. With the further increase in ignition time, the flame temperature gradually decreases. When the ignition time reaches 0.20 ms, the flame temperature decreases below 900 K. Therefore, combustible gas cannot be successfully ignited at an ignition radius of 4.5 mm. However, the increase in temperature after ignition indicates that some chemical reactions occur at the early stage of ignition. Because the ignition radius is less than the critical value, the energy released by the chemical reactions occurring at the initial stage is not enough to maintain the combustion of methane, and eventually lead to the failure of ignition. Methane combustion process consists of a chain reaction composed by a series of elementary reactions. The failure of methane ignition must be caused by the termination of one or more elementary reactions. In order to obtain the elementary reaction for the termination of methane combustion when the ignition radius is less than the critical value, variation of the reaction rate of each elementary reaction with ignition time is studied, as shown in Figure 15. The chemical reaction rate reflects the activity of the elementary reaction. When the reaction rate of a certain elementary reaction suddenly drops to a low level, the elementary reaction is considered to be terminated.
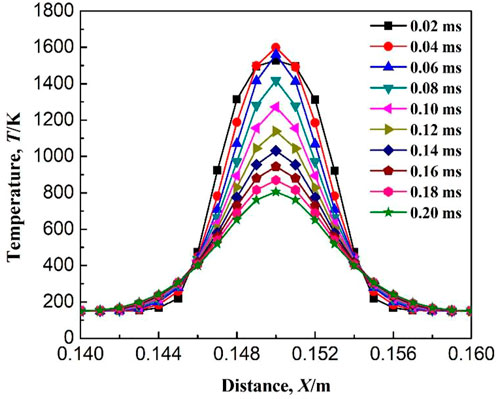
FIGURE 14. Variation of temperature with time when ignition radius is 4.5 mm.
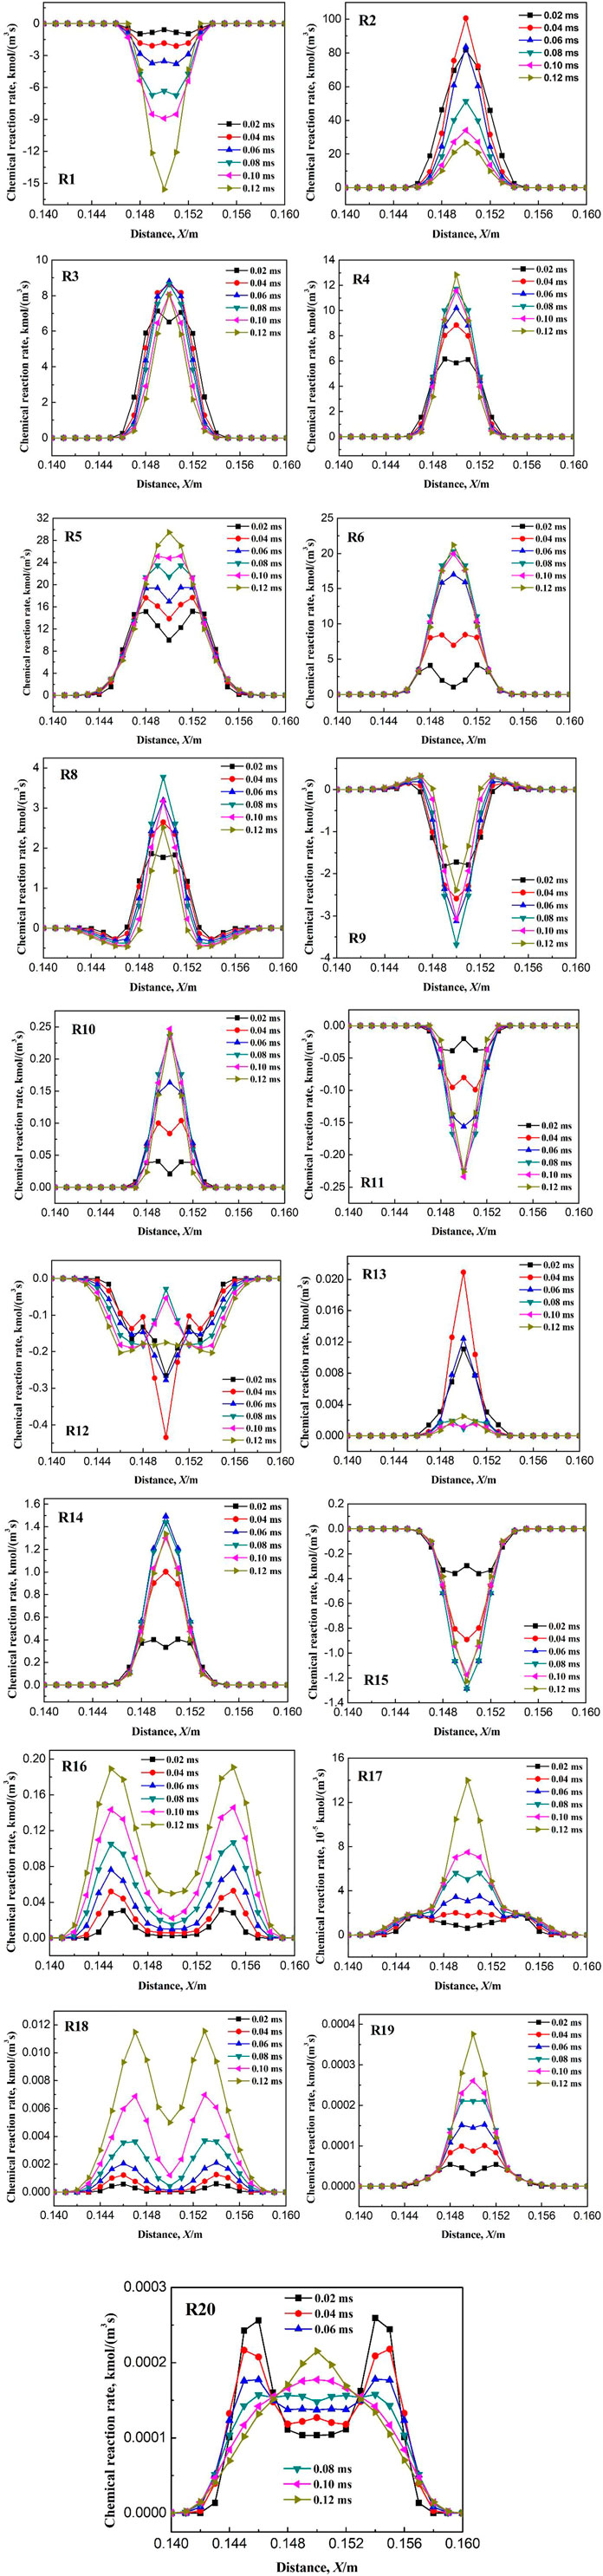
FIGURE 15. Variation of kinetic rate of elementary reactions with time when ignition radius is 4.5 mm.
As seen in Figure 15, after ignition, the chemical reaction rates of elementary reactions R1, R3, R4, R5, R6, R10, R11, R14, R15, R16, R17, R18, R19, and R20 increase gradually with the ignition time, or increase to a certain value and then maintain constants. However, the chemical reaction rates of the elementary reactions R2, R8, R9, R12, and R13 increase with ignition time to a certain value and then decrease greatly. Therefore, the elementary reactions R2, R8, R9, R12, and R13 may be the termination reaction for the failure of the ignition. Next, variation of the reaction rate of the above five elementary reactions with time are studied when the ignition radius is 4.6 mm (i.e., successful ignition), as shown in Figure 16. It can be seen that after ignition, variation of the chemical reaction rate of the elementary reaction R2 is the same as that when the ignition radius is 4.5 mm, therefore, R2 is not the terminated elementary reaction for the failure of ignition. In contrast, after ignition, the reaction rates of the elementary reactions R8, R9, R12, and R13 maintain at a high value and does not decrease, which is different from that when the ignition radius is 4.5 mm. To sum up, when the ignition radius is less than the critical value, the terminated elementary reactions resulting in the failure of ignition are R8, R9, R12, and R13.
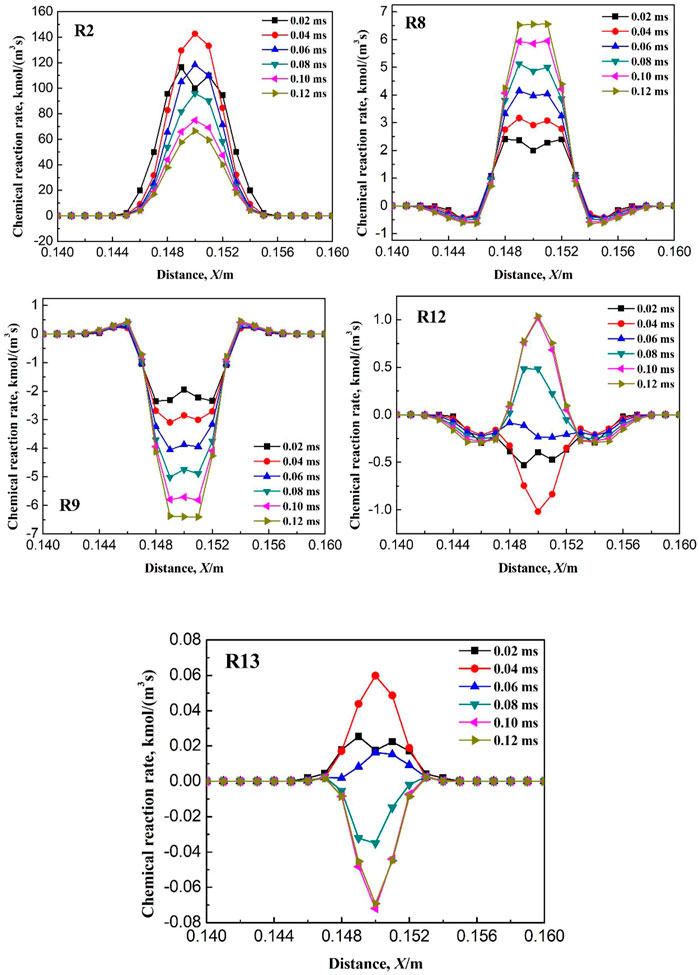
FIGURE 16. Variation of kinetic rate of elementary reactions with time when ignition radius is 4.6 mm.
3.4 Terminated elementary reactions when the ignition temperature is less than the critical value
Figure 17 shows the variation of flame temperature with ignition time at an ignition temperature of 1170 K. As seen in Figure 17, the flame temperature gradually decreases after ignition. When the time after ignition is greater than 0.14 ms, the flame temperature rapidly drops below 300 K. The continuous decrease in temperature indicates that no chemical reaction occurs after ignition. Figure 18 shows the variation of the mass fraction of some components with ignition time. It can be seen that the mass fraction of methane fluctuates after ignition. However, the volatility is only 0.00002, and it is assumed that CH4 has not been consumed after ignition. As seen in Table 1, the start of the chemical reaction chain is the dehydrogenation of CH4, and the corresponding elementary reactions are R1: CH4 = CH3 + H, R2: CH4 + OH = CH3 + H2O, R3: CH4 + O =CH3 + OH, and R4: CH4 + H = CH3 + H2. The initial stage does not exist H, OH, and O free radicals, therefore, the failure of ignition is due to the failure initiation of the elementary reaction R1. This is also confirmed by the fluctuations magnitude of the mass fractions of CH3 (10−8) and H (10−11), which is shown in Figure 18. Simply based on the elementary reaction, R1 is an endothermic reaction. Therefore, the occurrence of R1 needs enough energy to be provided. As seen from Table 1, the activation energy of the elementary reaction R1 is 455.06 kJ/mol, which induces a larger ignition energy, i.e., the reaction requires a sufficient ignition temperature.
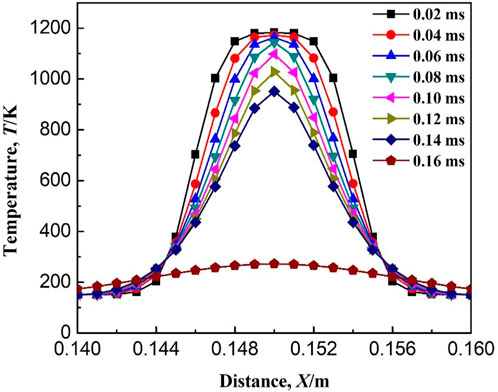
FIGURE 17. Variation of temperature with time when ignition temperature is 1170 K.
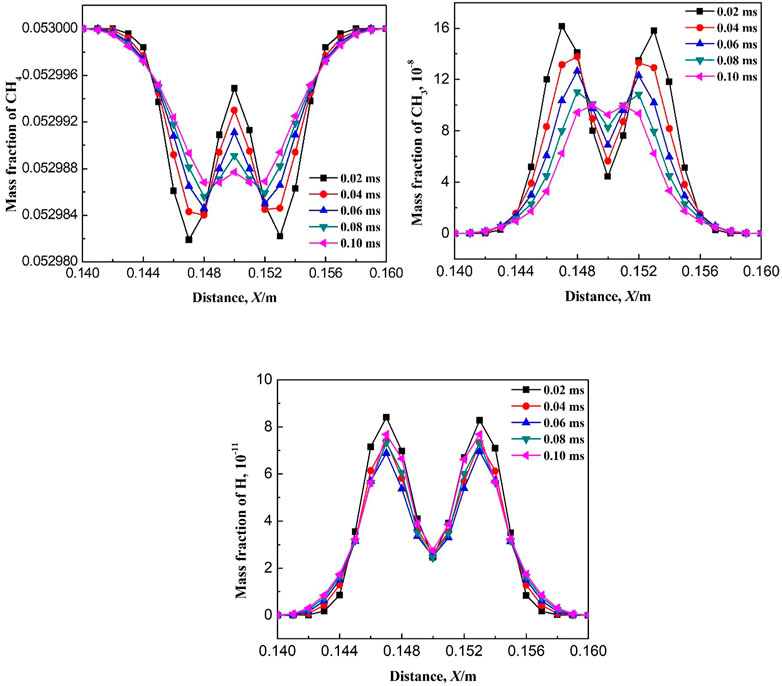
FIGURE 18. Variation of mass fraction of species when ignition temperature is 1170 K.
3.5 Validation of the numerical results based on experimental data
In this paper, the ignition source is set to a high temperature air mass, and it is proposed for the first time to study the critical value of methane combustion at low temperature by changing the radius and temperature of the high temperature air mass. As for whether the above processing method can accurately simulate the actual spark, it needs to be verified by previous experimental results. According to the results in Section 3.5 in this paper, when the ignition temperature is lower than the critical value, the failure of ignition is due to the failure initiation of the elementary reaction R1, which is the first reaction of the chemical reaction chain. Therefore, the initial temperature has no effect on the critical ignition temperature. However, the initial temperature has a large effect on the critical ignition radius, as shown in Figure 19A. After calculation using the numerical model in this paper, the critical ignition radius of methane is 4.6 mm at the low temperature of 150 K, while it is 3.9 mm at room temperature. Therefore, low temperature leads to an increase in the critical ignition radius. If the spark energy density of the ignition electrodes maintains a constant, the minimum ignition energy (MIE) increases with the increase in the critical ignition radius, which is consistent with the experimental results in Ref. (Cui et al., 2016b). In order to verify the correctness of the numerical simulation results, the MIEs based on the critical ignition radius are calculated. For the spark generator used in Ref. (Cui et al., 2016b), it is difficult to measure the spark energy density. At this point, at an initial temperature of 273 K, the calculated MIE is thought to be equal to the experimental value, which is 0.56 mJ. Therefore, the corresponding ignition energy density is calculated according to Equation 1, which is 0.002255 mJ/mm3. Based on this energy density value, the critical ignition energies (i.e., MIEs) of methane at different initial temperatures are calculated and compared with the experimental results, as shown in Figure 19B. As seen from the figure, with a decrease in initial temperature, the difference between the calculated and experimental results gradually increases. But overall, the maximum absolute error between those is 0.08 mJ. Therefore, the ignition initiation process of methane at low temperature can be well studied using the numerical model and the ignition method in this paper.
Here,
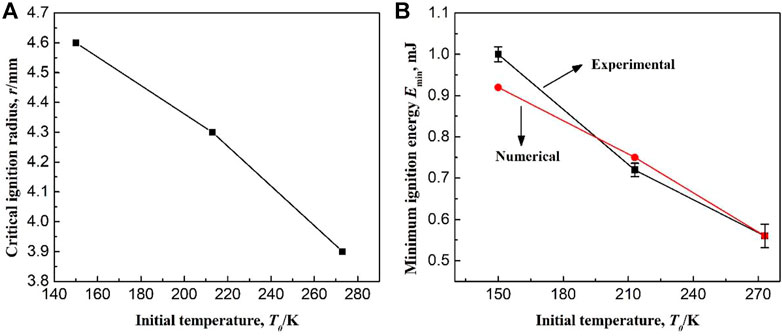
FIGURE 19. (A) Effect of initial temperature on the critical ignition radius; (B) Experimental and calculated minimum ignition energy at different initial temperatures.
4 Conclusion
In this paper, the initiation process of methane combustion at low temperature is studied and the following conclusion are drawn.
(1) At the initial time after ignition (within 0.5 ms), due to the lower concentration of free radicals, CH4 is consumed slowly and the mass fraction of CH4 in the flame core is not zero. As the combustion reaction proceeds, an increase in free radical concentrations lead to the increase in CH4 consumption rate. The consumption of CH4 directly affects the concentration distribution of CO during the ignition initiation period, which causes an inverse relationship between CO concentration distribution and CH4 concentration distribution.
(2) The mass fraction of the intermediate product in the burned area and the unburned area is low and reaches the maximum on the flame front. Moreover, as the reaction proceeds, the maximum concentration of the intermediate product on the flame front gradually decreases.
(3) Variations of the mass fraction of free radicals H and O are the same with those of the intermediate product: the mass fractions in the burned and unburned areas are both low and reach the maximum on the flame front. In the burned area, the OH mass fraction is not zero whereas maintains a high value. It indicates that OH is either a free radical which participates in the elementary reaction as a chain carrier, or a combustion reaction product remaining from the intermediate chain reaction.
(4) The ignition radius has a large effect on the initiation stage of methane combustion. With an increase in ignition radius, the combustion pressure increases. However, the ignition temperature has no effect on the initiation stage of methane combustion. At a low temperature of 150 K, the critical ignition radius for methane initiation is 4.6 mm, while it is 3.9 mm at room temperature. Therefore, the low temperature leads to a large increase in the critical ignition radius. The initial temperature has no effect on the critical ignition temperature, which is 1,180 K at low or normal temperatures. The numerical simulation results and the experimental results show a good agreement.
(5) When the ignition radius is less than the critical value, the failure of methane ignition is caused by the termination of the elementary reactions R8, R9, R12, and R13. However, when the ignition temperature is less than the critical value, methane is not ignited successfully because of the failed initiation of the elementary reaction R1.
Data availability statement
The original contributions presented in the study are included in the article/supplementary material, further inquiries can be directed to the corresponding author.
Author contributions
All authors listed have made a substantial, direct, and intellectual contribution to the work and approved it for publication.
Funding
This investigation has been supported by the Fundamental Research Funds for the Central Universities (No. 18CX02005A).
Conflict of interest
Authors CY, QH, HL, YW, and RC were employed by the company Shengli Oilfiled.
Publisher’s note
All claims expressed in this article are solely those of the authors and do not necessarily represent those of their affiliated organizations, or those of the publisher, the editors and the reviewers. Any product that may be evaluated in this article, or claim that may be made by its manufacturer, is not guaranteed or endorsed by the publisher.
References
Cui, G., Li, Z. L., Li, H. B., Bi, Z. X., and Wang, S. (2018). Numerical study on premixed methane-air flame propagation in a confined vessel at low initial temperature. Energy fuels. 32, 2465–2478. doi:10.1021/acs.energyfuels.7b03433
Cui, G., Li, Z. L., and Yang, C. (2016). Experimental study of flammability limits of methane/air mixtures at low temperatures and elevated pressures. Fuel 181, 1074–1080. doi:10.1016/j.fuel.2016.04.116
Cui, G., Li, Z. L., Yang, C., Zhou, Z., and Li, J. L. (2016). Experimental study of minimum ignition energy of methane-air mixtures at low temperatures and elevated pressures. Energy fuels. 30, 6738–6744. doi:10.1021/acs.energyfuels.6b00366
Cui, G., Li, Z. L., and Zhao, Y. L. (2015). Design and security analysis for the liquefaction and distillation process of oxygen-bearing coal-bed methane. RSC Adv. 5, 68218–68226. doi:10.1039/c5ra09143h
Dunn-Rankin, D., Barr, P. K., and Sawyer, R. F. (1988). Numerical and experimental study of “tulip” flame formation in a closed vessel. Symposium Combust. 21, 1291–1301. doi:10.1016/s0082-0784(88)80360-6
Gao, T., Lin, W. S., Gu, A. Z., and Gu, M. (2010). Coalbed methane liquefaction adopting a nitrogen expansion process with propane pre-cooling. Appl. Energy 87, 2142–2147. doi:10.1016/j.apenergy.2009.12.010
Hammond, G. P., and Grady, A. O. (2017). The life cycle greenhouse gas implications of a UK gas supply transformation on a future low carbon electricity sector. Energy 118, 937–949. doi:10.1016/j.energy.2016.10.123
Han, J. L., Yamashita, H., and Hayashi, N. (2010). Numerical study on the spark ignition characteristics of a methane–air mixture using detailed chemical kinetics. Combust. Flame 157, 1414–1421. doi:10.1016/j.combustflame.2010.02.021
Han, J. L., Yamashita, H., and Hayashi, N. (2011). Numerical study on the spark ignition characteristics of hydrogen-air mixture using detailed chemical kinetics. Int. J. Hydrogen Energy 36, 9286–9297. doi:10.1016/j.ijhydene.2011.04.190
Hu, J., Rivin, B., and Sher, E. (2000). The effect of an electric field on the shape of co-flowing and candle-type methane-air flames. Exp. Therm. Fluid Sci. 21, 124–133. doi:10.1016/s0894-1777(99)00062-x
Kaltayev, A. K., Riedel, U. R., and Warnatz, J. (2000). The hydrodynamic structure of a methane-air tulip flame. Combust. Sci. Technol. 158, 53–69. doi:10.1080/00102200008947327
Karim, G. A., Wierzba, I., and Boon, S. (1984). The lean flammability limits in air of methane, hydrogen and carbon monoxide at low temperatures. Cryogenics 24, 305–308. doi:10.1016/0011-2275(84)90139-5
Kravchik, T., and Sher, E. (1994). Numerical modeling of spark ignition and flame initiation in a quiescent methane-air mixture. Combust. Flame 99, 635–643. doi:10.1016/0010-2180(94)90057-4
Li, Z. M., Gong, M. Q., Sun, E. Y., Wu, J. F., and Zhou, Y. (2011). Effect of low temperature on the flammability limits of methane/nitrogen mixtures. Energy 36, 5521–5524. doi:10.1016/j.energy.2011.07.023
Marra, F. S., and Continillo, G. (1996). Numerical study of premixed laminar flame propagation in a closed tube with a full Navier-Stokes approach. Symposium Combust. 26, 907–913. doi:10.1016/s0082-0784(96)80301-8
Mikolajkov, M., Haikarainen, C., Saxen, H., and Pettersson, F. (2017). Optimization of a natural gas distribution network with potential future extensions. Energy 125, 848–859. doi:10.1016/j.energy.2016.11.090
Song, R., Cui, M. M., and Liu, J. J. (2017). Single and multiple objective optimization of a natural gas liquefaction process. Energy 124, 19–28. doi:10.1016/j.energy.2017.02.073
Wierzba, I., Harris, K., and Karim, G. A. (1992). Effect of low temperature on the rich flammability limits in air of hydrogen and some fuel mixtures containing hydrogen. Int. J. Hydrogen Energy 17, 149–152. doi:10.1016/0360-3199(92)90205-b
Wierzba, I., Harris, K., and Karim, G. A. (1990). Effect of low temperature on the rich flammability limits of some gaseous fuels and their mixtures. J. Hazard. Mat. 25, 257–265. doi:10.1016/0304-3894(90)85082-e
Xiao, H. H., Sun, J. H., and Chen, P. (2014). Experimental and numerical study of premixed hydrogen/air flame propagating in a combustion chamber. J. Hazard. Mat. 268, 132–139. doi:10.1016/j.jhazmat.2013.12.060
Keywords: methane, ignition, free radicals, critical conditions, elementary reactions, low temperature
Citation: Yang C, Han Q, Liu H, Wang Y and Cheng R (2023) Ignition characteristics of methane-air mixture at low initial temperature. Front. Energy Res. 10:1003470. doi: 10.3389/fenrg.2022.1003470
Received: 26 July 2022; Accepted: 13 September 2022;
Published: 05 January 2023.
Edited by:
Jiang Bian, China University of Petroleum, Huadong, ChinaReviewed by:
Guangchun Song, China University of Petroleum, ChinaShiyuan Zhan, Chengdu University of Technology, China
Copyright © 2023 Yang, Han, Liu, Wang and Cheng. This is an open-access article distributed under the terms of the Creative Commons Attribution License (CC BY). The use, distribution or reproduction in other forums is permitted, provided the original author(s) and the copyright owner(s) are credited and that the original publication in this journal is cited, in accordance with accepted academic practice. No use, distribution or reproduction is permitted which does not comply with these terms.
*Correspondence: Chao Yang, eWFuZ2NoYW8yMDEwMDFAMTYzLmNvbQ==