 Puming Wang
 Tianyi Diao1,2
 Xiaoqing Bai
- 1School of Electrical Engineering, Guangxi University, Nanning, China
- 2Guangxi Key Laboratory of Power System Optimization and Energy Technology, Guangxi University, Nanning, China
As the bridge between power companies and users, the integrated energy system has become one of the carriers of energy reform, energy-saving, and emission reduction. Based on this, a master–slave game bilevel optimization model considering power company–park-integrated energy system (PIES)–user is established. In the upper game, the power company, as the leader, takes the maximization of its interests as the goal to consider and formulate the price of purchasing and selling electricity with the park. As a follower, combined with the fluctuation of electricity price and the electricity demand of its equipment, the park determines the relationship between purchasing and selling electricity with the power company. In the lower-level game, the park becomes the leader, taking into account the energy needs of users and formulating a reasonable price for selling energy. Users, as followers, intend to maximize consumer surplus and adjust their energy demand strategies to achieve the best energy consumption experience. Analyzing the properties of the game, it is verified that there is a unique Nash equilibrium solution in the game model. At the same time, the idea of solving the distribution of the model is adopted, and the equilibrium solution of the model is obtained by using limited information. In addition, the output uncertainty of renewable energy in the park is dealt with by adjustable robust optimization. Finally, aiming at achieving a win–win situation among all stakeholders, the proposed game model is verified to effectively solve the equilibrium strategy problem among the PIES, the power company, and users through simulation analysis of an example.
1 Introduction
At present, with a series of problems such as energy exhaustion and environmental pollution becoming increasingly serious, the traditional energy distribution model has been unable to meet the production and living needs of the modern society. Therefore, it is urgent to accelerate the transformation of the energy development mode and solve the problem of sustainable supply of renewable energy. Based on this background, the park-integrated energy system (PIES), which combines cold, heat, electricity, and gas, came into being. It can improve the operating efficiency of the energy system and make full use of renewable energy (Xu et al., 2019). In the meantime, as the main platform for rational and efficient utilization of clean energy, the comprehensive energy system in the park helps to promote the complementary advantages of different types of energy and meet the diversified energy demand of users in the park (Tan et al., 2019). Therefore, it is of great significance to conduct an in-depth study on the connection and optimization scheduling between PIES and users of the power company (Yang et al., 2021).
With the further development of the integrated energy system and the gradual opening of the energy market, the fluctuation of energy prices will affect the energy demand of users. Through demand response, users are transformed from passive recipients of the scheduling results to participants, thus influencing the formulation of energy prices. In view of this conflict of interest, most scholars use the game theory method to deal with it. Huang et al. (2022) proposed a joint optimization scheduling model for the multi-park system and introduced a bargaining game mechanism to achieve win–win cooperation between parks. Fang et al. (2021) used game theory to solve the conflict between the overall optimal operation of the microgrid and the maximum profit of each investor and obtained the equilibrium solution to determine the optimal capacity allocation of the microgrid through the establishment of internal and external double-layer game iterative optimization. Wang et al. (2020) put forward a master–slave game optimization model of the community-integrated energy system. The authors constantly adjusted and optimized the pricing strategy of integrated energy vendors, generation arrangement of combined cooling and heat power (CCHP), and load demands of users and used an artificial intelligence algorithm to maximize the interests of each energy subject. Considering the distributed power generation-based sales companies and the participation of virtual power plants, Zhang et al. (2022) proposed the power transaction and optimal scheduling model based on the master–slave game optimization model. The establishment of the model made the main player get the maximum profit, while the secondary player represented by the virtual power plant (VPP) got the lowest internal scheduling cost. Taking into account the interests of all regions in the optimal dispatching of the comprehensive energy park, Chen et al. (2019) established a bilevel optimal dispatching model of the PIES based on the non-cooperative game theory, with the minimum daily cost as the upper goal and the highest energy efficiency of the cogeneration system as the lower goal. Then the optimal operation strategy of each region was obtained through the game. Li et al. (2021c) proposed a hierarchical and partitioned coordinated operation method of the distributed integrated energy system (DIES) based on a master–slave game for the energy internet system containing multiple communities. The city-integrated energy system hierarchy structure was given; to consider interaction energy between different communities and interests, city managers and operators, as the game of the leader and followers, established the DIES of the master–slave game optimization model and used the mixed-integer linear programming method to solve the model. However, the current research focused on the game between PIES and the power company or electricity sellers as well as the game interaction between the park and users, without considering the bilevel game between the power company and users. In addition, when studying the interactive transaction of the integrated energy system, most literature emphasized the use of electricity price to play the game and seldom considered the influence of price fluctuation of other energy in the energy hub such as cold and heat on the game.
PIES, however, can boost the consumption of renewable energy such as wind power and photovoltaics. Units with uncertain output in the park will seriously affect the economy of system operation. At present, stochastic optimization (SO) (Mei et al., 2021; Wang et al., 2015) and robust optimization (RO) (Zhang et al., 2017; Shen et al., 2020) are popular optimization methods to solve uncertainty. However, both optimization methods have their own defects: the SO requires a large amount of data to generate the scene with a deterministic probability density function (PDF), so the accuracy of probability density is reduced due to the lack of data (Ioannou et al., 2019). However, because the optimization results are too conservative, RO adopts adjustable robust optimization (ARO) (Mejía-Giraldo and McCalley, 2014), which can adjust the conservative degree, so that the decision can flexibly balance economy and security.
In summary, the main contributions of this paper are summarized as follows: while considering the fluctuation of energy prices, a two-layer master–slave game interaction model based on PIES is constructed, and the uncertain output of wind power and photovoltaics in the park is optimized through ARO. In the upper game, the power company is the leader and the PIES is the follower. The two play the game through coordination and interaction, finally achieving the balance between electricity purchasing and selling. In the lower game, PIES is the leader and users are followers. PIES adjusts energy prices to maximize profits. Users adjust their load demand according to the price provided by PIES to maximize consumer surplus. Considering power flow and uncertain output of the power system in PIES, an adjustable robust optimal power flow model is constructed. Finally, the robust optimization model is further transformed into a robust equivalence model by norm theory to eliminate the influence of uncertain forces on the optimal operation of the system.
2 The master–slave game model framework of PIES
The master–slave game model framework of PIES is shown in Figure 1. The power company is connected to a node in the power system, and the electricity price is adjusted according to the dispatching and distribution and actual operation to interact with PIES. By selling as much electricity as possible to maximize their profits, the PIES is directly connected with the power company through transmission lines. When the power supply of its equipment is insufficient, it can purchase power from the power company at a reasonable price to realize the normal operation of all equipment in the park and meet the load demand of users. Conversely, if the PIES produces excess electric energy, it can also be transmitted to the power company through the transmission line. Finally, as consumers, users can reasonably adjust the size of the energy consumption load to adapt to the energy selling price of the comprehensive energy system in the park and minimize the cost on the premise of meeting their energy consumption demands (Li et al., 2021b).
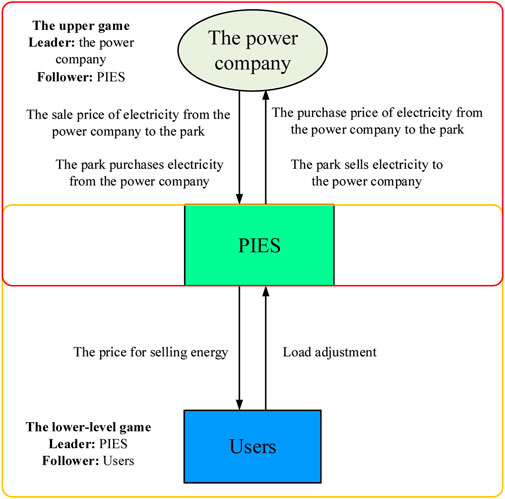
FIGURE 1. Master–slave game model framework of the PIES.
In brief, the upper-level game led by the power company is to realize the game with PIES through the transmission of electric power and the adjustment of the corresponding electricity price. The lower-level game is that PIES realizes game interaction with users by meeting their demands for electricity, cooling, and heat load and adjusting the corresponding energy price.
2.1 The power company model
2.1.1 The objective function
The objective function of the power company consists of transmission line power cost, equipment maintenance cost, generating cost, and benefits from electricity selling. The expressions are as follows:
where
2.1.2 Constraints of the power company
1) Electricity price constraints
where
2) Transmission line power constraintst
2.2 PIES model
The structure of the PIES (Gu et al., 2021) is shown in Figure 2. The abbreviations for specific components are shown in Table 1. PIES contains a range of renewable energy units such as wind power and photovoltaics as well as gas boilers, micro-turbines, and absorption cooling and energy storage units to meet the needs of all loads. Modeling is conducted for different energy sources to ensure that energy balance and their respective operating constraints are met at each moment (Tan et al., 2020).
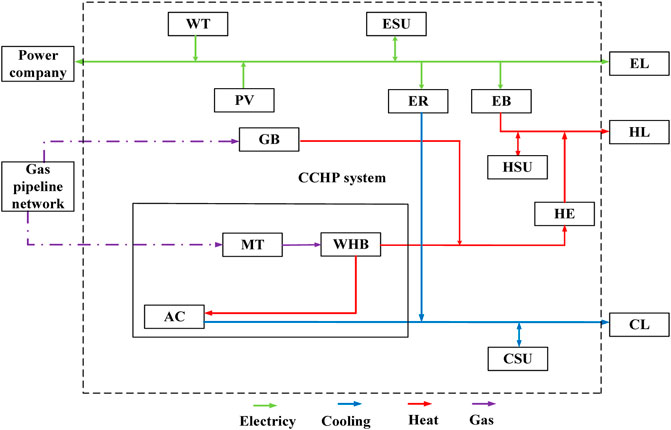
FIGURE 2. Master–slave game model framework of the PIES.
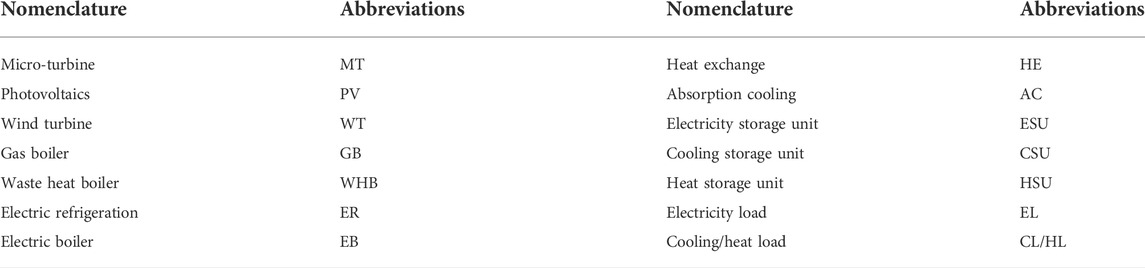
TABLE 1. Symbol definition of equipment in PIES.
2.2.1 The objective function
PIES takes the maximization of the park’s income as the objective function, where the objective function
where
2.2.2 The constraints of PIES
The busbar balance of each energy and safe operation constraints of each equipment should be considered when PIES operates. The second-order cone programming (SOCP) (Alizadeh and Goldfarb, 2003) is used to formulate the constraints on AC power flow in the power system. The detailed constraints are as follows:
1) Power balance constraints
where
2) Line security constraints
3) Cooling balance constraints
where
4) Thermal power balance
where
5) Gas node balance constraints
where
6) Energy conversion constraints
Electric refrigerating unit:
Absorption cooling:
Electric boiler:
Heat converter:
Heat recovery steam generator:
Gas boiler:
where
7) Energy storage unit constraints
where
8) Energy storage capacity constraints
where
9) Energy price constraints
where
10) Heat recovery steam generator and gas boiler constraints
where
11) The output of energy conversion constraints
where
2.3 The load model of users
Based on the known selling price of electricity, cooling, heat from PIES, and user satisfaction with energy, users adjust energy demands. The two points form users’ objective function, which is different between the utility function and energy cost of users (Li et al., 2021a).
where
where
The electricity load of the user side is divided into fixed electricity load and shifting electricity load (Huang et al., 2019), which can be expressed as
where
where
Moreover, the heat load can be divided as fixed heat load and reducing heat load, which can be expressed as
where
where
The cooling load is also composed of fixed cooling load and reducing cooling load, which can be expressed as
where
where
Summarily, although the model of the power company is a nonlinear model with nonlinear constraints, it is still a convex programming problem. Similarly, the PIES model and load model of users are both convex programming problems, and the global optimal solution can be obtained by selecting appropriate solution methods.
3 Model analysis and solution methodology
3.1 Game interaction and equilibrium
3.1.1 Analysis of game interaction
In the process of energy trading, variation in the real-time purchase and sale prices of power companies will affect the purchase and sale strategies of PIES. At the same time, PIES adjusts the selling price to users based on the output of each piece of equipment in the park. Affected by the fluctuation of energy price, users will adjust part reducing and interruptible loads and develop new energy purchasing strategies. These factors will trigger the interaction among participants, and participants constantly adjust their strategies to coordinate the interests of each other and finally maximize the interest of each subject to obtain the equilibrium solution of the game. In this game model, PIES serves as a bridge between the power company and users in a bilevel game. As the power company, PIES, and users have their interests, and there is no agreement among them. However, there is a sequence of decisions among the three; the game model is as follows:
Eq. 54 contains the three elements of the master–slave game, participants
1) Participants: The participants in the game are the power company, PIES, and users.
2) Strategies: In the upper game, the strategy set of the leading power company is the selling and purchasing prices of PIES at each moment
3) Utility: The utility of each participant is the objective function of the subject, which has been shown in the previous section.
3.1.2 The proof of game equilibrium
When all followers make the optimal response according to the strategy given by the leaders and the leader also accepts the response, the game reaches equilibrium, and the optimal solution is called Nash equilibrium.
Only when the master–slave game model satisfies the following three conditions can there be a unique master–slave game equilibrium solution (Liang and Su, 2018; Xiang et al., 2021):
1) In the game process, both the leader and follower’s strategy sets are non-empty sets and also satisfy to be closed and bounded;
2) In the game, if the leader determines the strategy, as a follower, there is only one optimal strategy;
3) In the game process, if the follower determines the strategy, the leader also has only one optimal strategy.
Then, we verify whether the above three conditions are satisfied from the lower game model.
a) Condition 1) is satisfied because the strategy sets of power companies, PIES, and users are all non-empty, closed, and bounded convex sets in Euclidean space.
b) Verify that the follower has a unique optimal strategy after the leader gives a strategy. Taking the following layer game as an example, the first-order partial derivative of the users’ objective function against the energy consumption load can be obtained:
Let the first-order partial derivative of the above equation equal 0. The optimal value of available energy consumption load is
Then take the second-order partial derivative of Eq. 56 concerning
Since the user energy preference parameters are generally positive, the second-order partial derivatives here are all less than 0, so Eq. 56 is the maximum value of the users’ objective function. As the sale energy price of PIES changes, the extreme value may be located on the boundary of the load, but no matter how the sale energy price changes, the unique optimal load solution can be obtained.
c) Verify that the leader has a unique optimal strategy when the followers of the game are given a strategy. Substitute the optimal energy consumption load Eq. 56 into the PIES objective function Eq. 9 and take the second-order partial derivatives of
According to Eq. 58, the second-order partial derivatives are all less than 0, and there is a maximum value. Therefore, when the energy consumption load is determined by the user, there is a unique optimal solution for the sale price of PIES.
The proof process of the upper game is similar to that of the lower, which is not described here. Since the upper and lower of the game are interrelated and affect each other, it is proved that both the upper and lower game models have a unique Nash equilibrium solution, which indirectly proves that the two-level master–slave game model proposed in this section has a unique Nash equilibrium solution.
3.2 Adjustable robust optimal power flow model
ARO (Mejia Giraldo and Mccalley, 2014) is used to process wind power and photovoltaics with large fluctuation. The feature of robust optimization is that it makes decisions in the worst case to minimize the influence of decision parameters, but it also has the disadvantage of being too conservative. The emergence of ARO improves this disadvantage, and it can make a better choice between conservatism and robustness according to its own needs.
ARO controls the size of the uncertain set by introducing uncertainty. Suppose uncertain parameter
The uncertain sets of photovoltaics and wind power are defined as follows:
where
Therefore, based on the optimal power flow of the PIES deterministic power system introduced above, wind power and photovoltaics with uncertain output are considered to build an adjustable robust optimal power flow model.
1) Power balance constraints
2) Line security operation constraints
In the above adjustable robust optimal power flow model, there are constraints with uncertain parameters, so the model cannot be solved directly. In this paper, the dual norm theory is used to transform the original model into a robust equivalence model. The constraints with uncertain parameters in the original model are Eqs 65–67. According to the dual norm theory,
Obviously, the constraint Eq. 73 no longer contains the constraint of uncertain parameters, and the model is transformed into a convex model that can be solved directly, which is convenient for a subsequent solution.
3.3 The idea of a distributed solution
In the process of the real transaction and game, transaction subjects do not want other participants to know their objective function and strategy (Lin et al., 2019). To better protect the information of each participant, the distributed solution of the game equilibrium of the power company, the PIES, and users is provided. In this way, the independent decision of each participant can be realized without disclosing the objective function information of both parties.
The idea of a distributed solution is as follows:
It is assumed that there is a control center in the middle of each participant, which is responsible for summarizing the real-time information provided by the participant, allowing other participants to obtain the information and accept their feedback decision information, and realizing the coordinated solution of game equilibrium through continuous iteration. The specific flow chart is shown in Figure 3.
FIGURE 3. Model distribution solution flow chart.
In the upper game, the power company initializes the unit purchase and sale prices, satisfies the purchasing and selling price constraints, and informs the control center of the initial price information. After obtaining the corresponding price from the control center, PIES determines the purchasing and selling relationship with the power company by taking into account the output of the equipment in the park.
In the lower game, PIES determines a reasonable initial selling price based on users’ energy usage and passes this information to the control center. After users obtain the energy price from the control center, they make an adjustment based on their actual situation and feedback the information to the control center. The park then makes new energy prices according to the strategy feedback from users from the control center and meets the energy price constraints. PIES achieves the Nash equilibrium by constantly updating the pricing strategy and purchasing and selling strategy, feeding back to the customer and the power company.
4 Simulation example
4.1 Analysis of the result of a calculation example
In this chapter, simulation results verify the rationality and economy of the proposed power company–PIES–user master–slave game model.
The simulation is carried out using Matlab 2021a combined with the Yalmip optimization toolbox (Lofberg, 2005) on a standard personal computer with an Intel Core i7-7700 CPU running at 16 GB RAM, and the Gurobi solver (Optimization, 2014) is used to solve the master–slave game model. In this section, the PIES uses an IEEE 30-bus system for example analysis. The simulation results are presented in the form of standard identity data, and the power reference value is 100 kW. The optimization results of electrical output, cooling output, and thermal output within PIES are shown in Figures 4–6, respectively. The comparison of user demand before and after the game of various loads is shown in Figures 7–9.
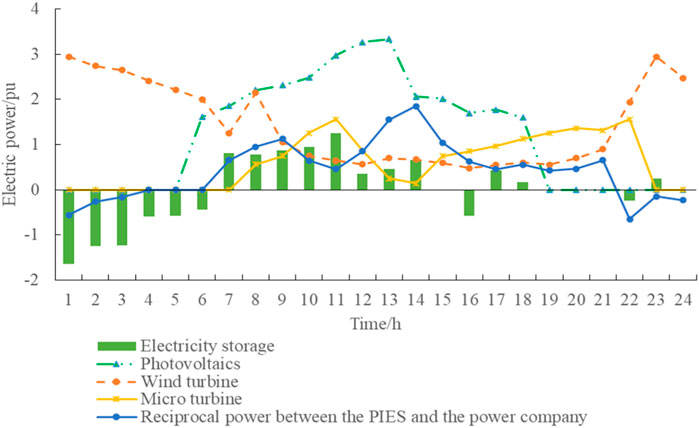
FIGURE 4. Optimization results of electricity output.
As shown in Figure 4, the PIES stores the excess electrical energy in the electrical energy storage unit and transfers it to the electrical power because the wind power output is high in the early morning and late night, and the users’ electricity loads are low. During the peak power consumption period from 7:00 to 11:00 in the daytime, the output of photovoltaic and micro-combustion units gradually increases, while the output of wind power gradually decreases, and energy storage units release energy to further meet the load demand. Nevertheless, the equipment in the park still fails to meet the load power demand of users, so the part of power shortage needs to be purchased from power.
As shown in Figure 5, the output of absorption cooling will be limited by the waste heat power, so the output gradually increases to the peak value during daytime working hours, and the output is less at night. The output of electric refrigeration changes with the fluctuation of cooling load demand. When the load demand is large from 8:00 to 11:00 and from 16:00 to 17:00, the output of electric refrigeration will be large, and the energy storage unit will also provide energy during this period to meet the energy demand.
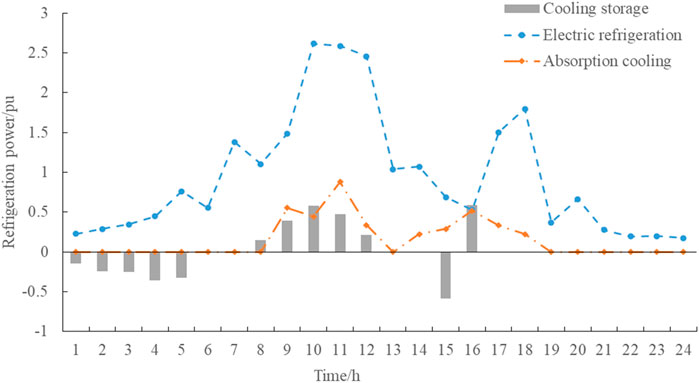
FIGURE 5. Optimization results of cooling output.
In Figure 6, the electric heating device provides heat according to the users’ demand, presenting a double-peak shape as a whole, reaching the peak value at 11:00 and 17:00, which matches the users’ energy usage habits. Heat exchange is mainly affected by the gas boiler and waste heat boiler, and the output is not much throughout the day, reaching the peak at 16:00. The thermal energy storage unit as a whole presents the characteristics of internal charging when the load demand is small and provides energy when the load demand is large.
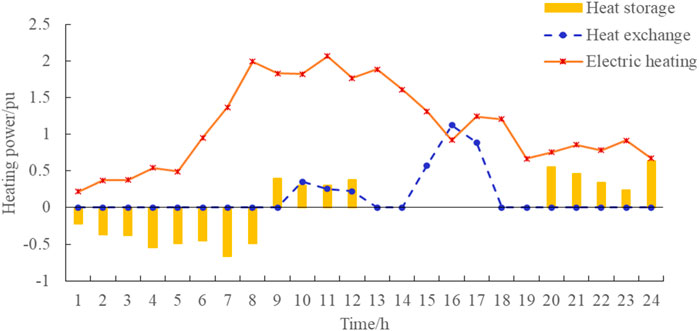
FIGURE 6. Optimization results of thermal output.
Figure 7 shows the comparison between the users’ initial electricity load and the electricity load demand after considering the game. As can be seen from the figure, after considering the game, the electricity price for users in the park keeps rising during the peak periods of 7:00–12:00 and 15:00–18:00. At this point, the load is significantly optimized, and the fluctuation range of electricity load becomes smaller, which plays a good role in peak load cutting and valley filling. It relieves the power supply pressure of the park during peak hours and also reduces the power purchase cost of users so that the system can operate more safely and reliably.
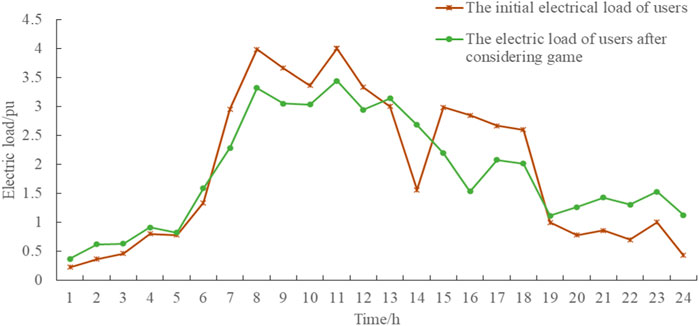
FIGURE 7. Comparison between the users’ initial electricity load and the electricity load after considering the game.
Figure 8 shows the comparison between users’ initial cooling load and cooling load demand after considering the game. As seen from the figure, to ensure users’ energy consumption experience and comfort, the cooling load is reduced by a small amount, which is mainly reflected in the load reduction near the peak energy consumption and when the energy sale price is high. In the stage of low energy consumption and relatively cheap cooling prices in the park, the load demand should be appropriately increased.
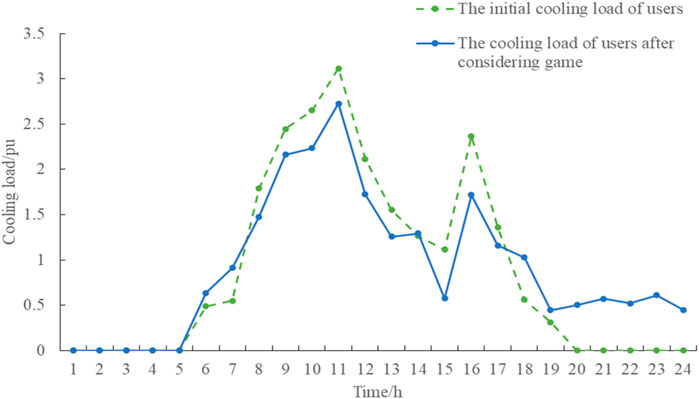
FIGURE 8. Comparison between users’ initial cooling load and cooling load after considering the game.
Figure 9 shows the comparison between the users’ initial heat load and the heat load demand after considering the game. As shown in the figure, after the game, the heat load is cut in the two stages of 8:00–12:00 and 15:00–17:00 to reduce the energy consumption cost and relieve the pressure on the equipment output of the comprehensive energy system in the park during the peak energy consumption period.
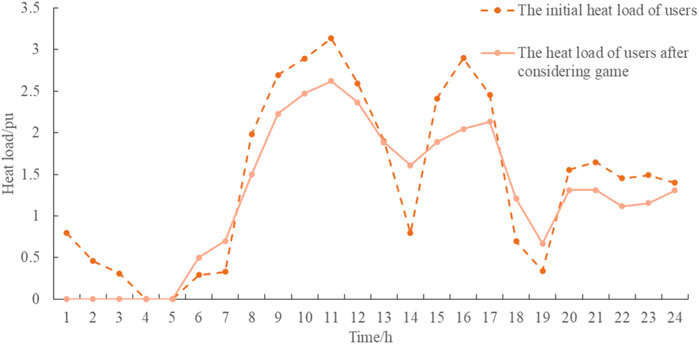
FIGURE 9. Comparison between users’ initial heat load and heat load after considering the game.
Figure 10 shows the price at which PIES buys and sells electricity to power companies. The dotted line in the figure represents the latest time-of-use price provided by electricity. As seen from the figure, PIES formulates the electricity purchase price strategy within the range of the dotted line. Compared with the time-of-use price, most of the periods are lower than the time-of-use price; that is, after considering the game, it has a better price advantage. At the same time, increasing the purchased and sale electricity price during peak electricity consumption encourages the equipment in the comprehensive energy system of the park to generate more electricity, therefore reducing the purchase of electricity from the power company to achieve the purpose of increasing the total income of the park.
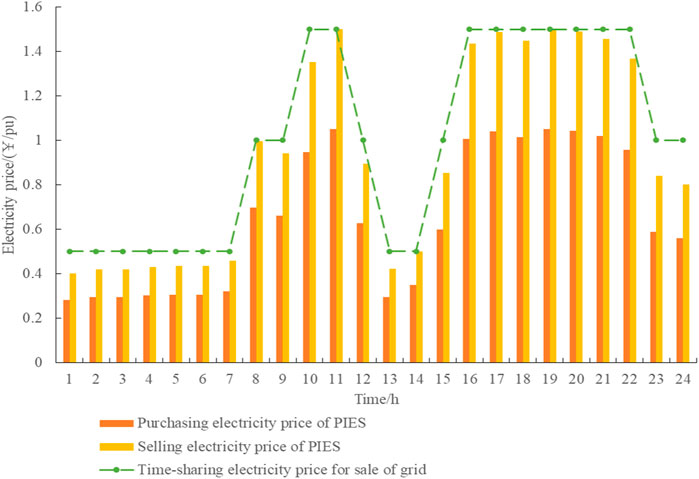
FIGURE 10. PIES purchases and sells electricity from the power grid.
Figure 11 shows the energy selling price of PIES to users. In order to maximize revenue, the energy selling price of each energy in the park is increased during peak energy consumption of users to obtain more excess revenue. In the low-energy-consumption period, the energy price of each energy in the park will be reduced to encourage users to increase energy consumption at this stage. Compared with the traditional time-of-use electricity price, it is smoother and easier to accept by users and ensures that the system runs more safely and stably.
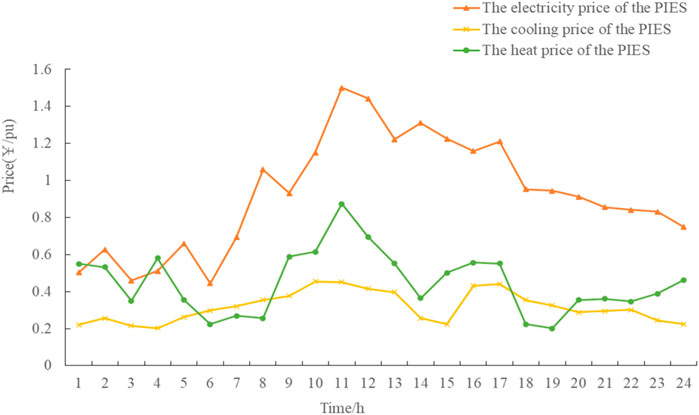
FIGURE 11. Price of PIES to users.
4.2 Contrastive analysis
4.2.1 The influence of game interaction on the income of each subject
In order to better reflect the influence of game interaction on the income of each subject, the following scenarios are set up in this paper:
Scenario 1: Consider the electricity price game between the power company and the PIES and the energy price game between the PIES and the users.
Scenario 2: The price game between the power company and the PIES is considered, but the energy selling price between the PIES and the users is fixed.
Scenario 3: The price game between the PIES and the users is considered, but the energy selling price between the power company and the PIES is fixed.
Scenario 4: Regardless of any game, the upper and lower levels are trading at fixed prices.
The fixed prices in scenarios 2, 3, and 4 are taken from the average prices of the corresponding variables in scenario 1.
Table 2 shows the income comparison between the power company and the PIES in different scenarios. Scenarios 2 and 3 with the only a single-layer game have significantly higher benefits than the traditional scenario 4 without considering the game. For scenario 1 with two games, the benefits are obviously higher than those of scenarios 2 and 3 with only a single game. Under the guidance of the price game, a variety of energy shows a more reasonable optimal allocation after participating in the game, so the best benefits for both sides of the game are achieved. Therefore, the game model proposed in this paper has a better economy.
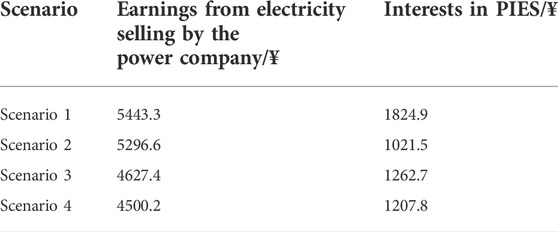
TABLE 2. Income comparison of the integrated energy system of the distribution network and park under different scenarios.
4.2.2 Influence of network power flow on PIES
To study the influence of power network flow on PIES, we set the following two scenarios:
Scenario 0: PIES ignoring the power flow of the power system.
Scenario 1: PIES in this paper considers the optimal power flow of the power system.
As shown in Table 3, scenario 1 takes into account the power flow constraints of the power system and the power of each line is within a reasonable operating range. In contrast, in scenario 0, lines 2–4 and 8–28 appear as power overload (The power overload is indicated in bold) because the line safety operation constraints are not considered. If such an overload problem appears in the actual system, it will bring unnecessary losses and make the scheduling plan not feasible. Therefore, PIES considering power system network flow is more feasible and stable.
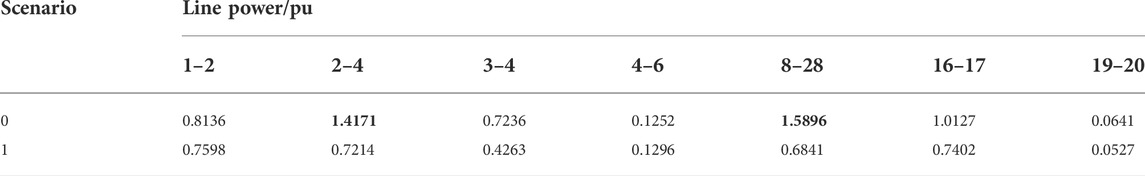
TABLE 3. Partial line power comparison.
4.2.3 The influence of uncertainty changes on model results
As shown in Table 4, when
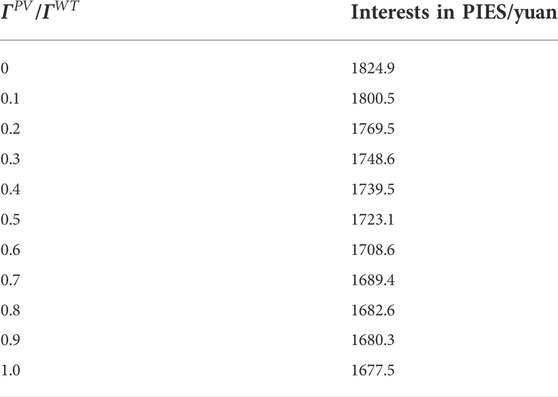
TABLE 4. Benefits of the PIES under different adjustable uncertainty levels.
4.2.4 User preference analysis
The influence of user preference parameters on the game equilibrium solution, that is, the influence of parameter value changes on the game solution, is observed.
Taking the transaction situation at a random time as an example, the user energy preference parameters are gradually increased from 20 to 200 to observe the influence of energy preference parameters on the game results.
As shown in Figure 12, when the energy preference parameter is below 40, users have low requirements for energy consumption experience and can reduce large amounts of various loads, so users are more sensitive to energy consumption experience. When the user preference parameters increase to more than 40, the users’ sensitivity to energy experience decreases obviously, and the users’ actual energy load increases with the increase of the preference parameters.
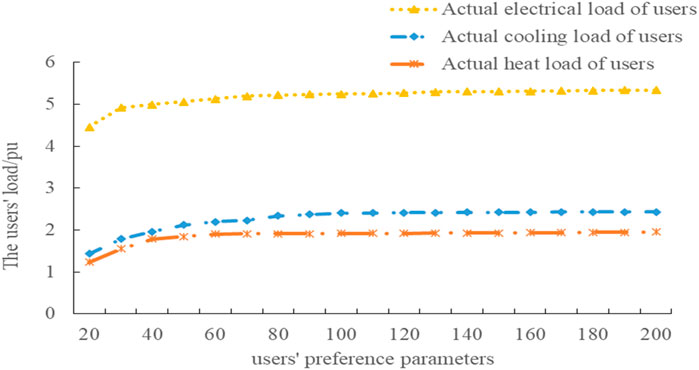
FIGURE 12. Influence of users’ preference parameters on game results.
5 Conclusion
In this paper, a two-level master–slave game optimization model of the power company, PIES, and users is proposed, and a distributed algorithm solution to protect the privacy of each participant is provided to solve the model. Finally, the cooperative optimization of PIES and other subjects is realized, and the game balance is achieved. At the same time, considering the existing renewable energy units in the park, the method of ARO is considered to deal with the uncertain output. Finally, the following conclusions are drawn through the analysis of calculation examples:
1) It is proved that the two-level master–slave game interaction strategy constructed in this paper has a Nash equilibrium solution. In addition, the feasibility of this strategy is verified by the method of distribution solution, and the purpose of protecting the privacy of participants is realized.
2) By comparing the proposed game model with the traditional optimization model, both sides of the game have better economic performance after introducing the price game of the power company and the energy sale price game.
3) Considering the ARO model, the conservatism of the traditional robust model is improved, and the adjustable robust optimal power flow model is established. In addition, this paper also studies the influence of user preference parameters on users. The difference in preference parameters will affect users’ energy consumption and then affect the game equilibrium solution.
Future work will consider not only the electricity price game between the power company and the PIES but also the gas price game between the natural gas company and the PIES. In addition, the cooperative optimization operation of source–load–storage will be focused on, and the multi-energy free trade among multi-PIES is considered to optimize the energy utilization rate further (Li et al., 2021c).
Data availability statement
The raw data supporting the conclusion of this article will be made available by the authors, without undue reservation.
Author contributions
PW, TD, and XB contributed to the concept and design of the study. WPM wrote the first draft of the manuscript. TD, XB, LZ, and GL wrote parts of the manuscript. All authors participated in revising the manuscript, reading, and approving the submitted version.
Funding
This research was funded by the National Natural Science Foundation of China (NSFC), grant number 51967001.
Conflict of interest
The authors declare that the research was conducted in the absence of any commercial or financial relationships that could be construed as a potential conflict of interest.
Publisher’s note
All claims expressed in this article are solely those of the authors and do not necessarily represent those of their affiliated organizations or those of the publisher, the editors, and the reviewers. Any product that may be evaluated in this article or claim that may be made by its manufacturer is not guaranteed or endorsed by the publisher.
References
Alizadeh, F., and Goldfarb, D. (2003). Second-order cone programming. Math. Program. 95 (1), 3–51. doi:10.1007/s10107-002-0339-5
Chai, B., Chen, J., Yang, Z., and Zhang, Y. (2014). Demand response management with multiple utility companies: A two-level game approach. IEEE Trans. Smart Grid 5 (2), 722–731. doi:10.1109/TSG.2013.2295024
Chen, F., Liang, H., Gao, Y., Yang, Y., and Chen, Y. (2019). Research on double-layer optimal scheduling model of integrated energy park based on non-cooperative game. Energies 12, 3164. doi:10.3390/en12163164
Chen, H., Mao, W., Zhang, R., and Yu, W. (2021). Power system source-charge coordination and low-carbon optimal scheduling based on carbon emission flow theory. Power Syst. Prot. Control 49 (10), 1–11. doi:10.19783/j.cnki.pspc.200932
Fang, F., Zhu, Z., Jin, S., and Hu, S. (2021). Two-layer game theoretic microgrid capacity optimization considering uncertainty of renewable energy. IEEE Syst. J. 15, 4260–4271. doi:10.1109/JSYST.2020.3008316
Gu, H., Jie, Y., Li, Y., Chen, W., Jingsong, Z., and Chen, C. (2021). Optimal economic dispatch for an industrial park with consideration of an elastic energy cloud model with integrated demand response uncertainty. IEEE Access 9, 52485–52508. doi:10.1109/ACCESS.2020.3008180
Huang, W., Zhang, N., Kang, C., Li, M., and Huo, M. (2019). From demand response to integrated demand response: Review and prospect of research and application. Prot. Control Mod. Power Syst. 4, 12. doi:10.1186/s41601-019-0126-4
Huang, H., Chen, X., and Zha, J. (2022). Partition autonomous energy cooperation community and joint optimal scheduling for multi park integrated energy system. Power grid Technol. 46 (08), 2955–2965. doi:10.13335/j.1000-3673.pst.2021.1499
Ioannou, A., Fuzuli, G., Brennan, F., Yudha, S. W., and Angus, A. (2019). Multi-stage stochastic optimization framework for power generation system planning integrating hybrid uncertainty modelling. Energy Econ. 80, 760–776. doi:10.1016/j.eneco.2019.02.013
Li, P., Wu, D., Li, Y., Liu, H., Wang, N., and Zhou, X. (2021a). Optimal dispatch of multi-microgrids integrated energy system based on integrated demand response and stackelberg game. Proc. csee 41 (4), 15. doi:10.13334/j.0258-8013.pcsee.201845
Li, Y., Wu, D., and Li, P. (2021b). “Multi-objective optimal dispatching algorithm for park integrated energy system considering starkberg game and energy cascade utilization,” in Proceeding of the 2021 IEEE 5th Conference on Energy Internet and Energy System Integration (EI2), Taiyuan, China, October 2021 (IEEE), 4429–4433. doi:10.1109/EI252483.2021.9713062
Li, P., Wang, Z., Yang, W., Liu, H., Yin, Y., Wang, J., et al. (2021c). Hierarchically partitioned coordinated operation of distributed integrated energy system based on a master-slave game. Energy 214, 119006. doi:10.1016/j.energy.2020.119006
Liang, Z., and Su, W. (2018). Game theory based bidding strategy for prosumers in a distribution system with a retail electricity market. IET Smart Grid 1, 104–111. doi:10.1049/iet-stg.2018.0048
Lin, K., Wu, J., Liu, D., Li, D., and Gong, T. (2019). Energy Management Optimization of micro energy Grid based on two-layer Stackelberg game. Electr. power Technol. 43 (03), 973–983. doi:10.13335/j.1000-3673.pst.2018.1379
Lofberg, J. (2005). “Yalmip: A toolbox for modeling and optimization in Matlab,” in Proceeding of the IEEE International Symposium on Computer Aided Control Systems Design, Taipei, Taiwan, September 2004 (IEEE), 284–289.
Maharjan, S., Zhu, Q., Zhang, Y., Gjessing, S., and Basar, T. (2013). Dependable demand response management in the Smart grid: A stackelberg game approach. IEEE Trans. Smart Grid 4 (1), 120–132. doi:10.1109/TSG.2012.2223766
Mei, F., Zhang, J., Lu, J., Lu, J., Jiang, y., Gu, J., et al. (2021). Stochastic optimal operation model for a distributed integrated energy system based on multiple-scenario simulations. Energy 219, 119629. doi:10.1016/j.energy.2020.119629
Mejía-Giraldo, D., and McCalley, J. (2014). Adjustable decisions for reducing the price of robustness of capacity expansion planning. IEEE Trans. Power Syst. 29 (4), 1573–1582. doi:10.1109/TPWRS.2013.2295166
Optimization, G. (2014). Gurobi Optimizer reference manual. Available at: https://www.gurobi.com/documentation/9.5/refman/index.html.
Shen, F., Zhao, L., Du, W., Zhong, W., and Qian, F. (2020). Large-scale industrial energy systems optimization under uncertainty: A data-driven robust optimization approach. Appl. Energy 259, 114199. doi:10.1016/j.apenergy.2019.114199
Tan, Z., Yang, S., Lin, H., De, G., Ju, L., and Zhou, F. (2019). Multi-scenario operation optimization model for park integrated energy system based on multi-energy demand response. Sustain. Cities Soc. 53, 101973. doi:10.1016/j.scs.2019.101973
Tan, Z., Yang, S., Lin, H., De, G., Ju, L., and Zhou, F. (2020). Multi-scenario operation optimization model for park integrated energy system based on multi-energy demand response. Sustain. Cities Soc. 53, 101973. doi:10.1016/j.scs.2019.101973
Wang, C., Zhou, Y., Wu, J., Wang, J., Zhang, Y., and Wang, D. (2015). Robust-index method for household load scheduling considering uncertainties of customer behavior. IEEE Trans. Smart Grid 6, 1806–1818. doi:10.1109/TSG.2015.2403411
Wang, H., Li, K., Zhang, C., and Ma, X. (2020). Distributed cooperative Optimal operation strategy of community integrated energy system based on master-slave game. Proc. csee 40 (17), 5435–5445. doi:10.13334/j.0258-8013.pcsee.200141
Xiang, E., Gao, H., Liu, C., Liu, Y., and Liu, J. (2021). Energy transaction optimization decision of multi-energy operators in park based on the Interaction of supply and demand Game. Proc. CSEE 41 (08), 2744–2757. doi:10.1109/TPWRS.2013.2295166
Xu, Q., Li, L., Chen, X., Huang, Y., Luan, K., and Yang, B. (2019). Optimal economic dispatch of combined cooling, heating and power‐type multi‐microgrids considering interaction power among microgrids. IET Smart Grid 2 (3), 391–398. doi:10.1049/iet-stg.2018.0161
Yang, S., Tan, Z., Zhou, J., Xue, F., Gao, H., Lin, H., et al. (2021). A two-level game optimal dispatching model for the park integrated energy system considering Stackelberg and cooperative games. Int. J. Electr. Power & Energy Syst. 130 (3), 106959. doi:10.1016/j.ijepes.2021.106959
Zhang, C., Xu, Y., Dong, Z., and Ma, J. (2017). Robust operation of microgrids via two-stage coordinated energy storage and direct load control. IEEE Trans. Power Syst. 32 (4), 2858–2868. doi:10.1109/TPWRS.2016.2627583
Keywords: adjustable robust optimization, bilevel optimization model, energy transaction, park-integrated energy system, master–slave game
Citation: Wang P, Diao T, Zheng L, Liu G and Bai X (2022) A master–slave game optimal scheduling strategy for park-integrated energy systems based on adjustable robust optimization. Front. Energy Res. 10:1002719. doi: 10.3389/fenrg.2022.1002719
Received: 25 July 2022; Accepted: 08 August 2022;
Published: 23 September 2022.
Edited by:
Xueqian Fu, China Agricultural University, ChinaReviewed by:
Ran Quan, Henan University of Technology, ChinaYayu Peng, University of Nebraska at Kearney, United States
Copyright © 2022 Wang, Diao, Zheng, Liu and Bai. This is an open-access article distributed under the terms of the Creative Commons Attribution License (CC BY). The use, distribution or reproduction in other forums is permitted, provided the original author(s) and the copyright owner(s) are credited and that the original publication in this journal is cited, in accordance with accepted academic practice. No use, distribution or reproduction is permitted which does not comply with these terms.
*Correspondence: Xiaoqing Bai, YmFpeHFAZ3h1LmVkdS5jbg==