 Qinran Hu
 Yufeng Zhou
 Haohui Ding
 Panhao Qin
 Yu Long2
- 1School of Electrical Engineering, Southeast University, Nanjing, China
- 2State Grid Jiangsu Electric Power Company Limited, Nanjing, China
Hydrogen is regarded as a promising fuel in the transition to clean energy. Nevertheless, as the demand for hydrogen increases, some microgrids equipped with P2H (MGH) will encounter the issue of primary energy deficiency. Meanwhile, some microgrids (MGs) face the difficulty of being unable to consume surplus energy locally. Hence, we interconnect MGs with different energy characteristics and then establish a collaborative scheduling model of multi-microgrids (MMGs). In this model, a federated demand response (FDR) program considering predictive mean voting is designed to coordinate controllable loads of electricity, heat, and hydrogen in different MGs. With the coordination of FDR, the users’ satisfaction and comfort in each MG are kept within an acceptable range. To further adapt to an actual working condition of the microturbine (MT) in MGH, a power interaction method is proposed to maintain the operating power of the MT at the optimum load level and shave peak and shorten the operating periods of MT. In the solution process, the sequence operation theory is utilized to deal with the probability density of renewable energy. A series of case studies on a test system of MMG demonstrate the effectiveness of the proposed method.
1 Introduction
From the last century to the present, fossil fuels as the world’s principal energy have facilitated rapid technological advancement (Arutyunov and Lisichkin, 2017). However, the burning of fossil fuels will result in tremendous pollution emissions that will precipitate a global climate disaster (Kovač et al., 2021; Pan et al., 2021). Under this circumstance, countries around the world are actively exploring environmentally benign energy options (Gielen et al., 2019; Hafner and Tagliapietra, 2020; Zhou et al., 2021). Recently, hydrogen has come into the spotlight again due to its benefits, including the competitive heating value of hydrogen, 142 kJ/g, which is second only to nuclear fuel (Wu et al., 2019), eradication of environmental harm, and diversified manufacturing approaches (Ishaq and Dincer, 2021). Among all the production approaches, power to hydrogen (P2H) has the advantages of high product purity and fewer by-products of pollutant emissions (Hu et al., 2020). In addition, because of the advantage of integrating various energy technologies and meeting multiple energy demands simultaneously, microgrids (MGs) will be a critical infrastructure for connecting P2H and serving hydrogen demand (so-called MGH) (Pan et al., 2020).
To promote MGH, most researchers have reduced the operating costs of P2H in two ways: 1) diversifying energy sources of P2H and profit channels of product to cut costs and 2) establishing coupling and controlling strategies among P2H and other devices in the microgrid (MG) to reduce energy dissipation. For example, Tostado-Véliz et al. (2021) used multiple energy, including microturbine (MT), grid, and renewable energy generations (RGs), to supply P2H. Meanwhile, MG profits from hydrogen sales to 5-min fueling vehicles. Eghbali et al. (2022) adopted the economic operation strategy of coordinating multiple storage systems, such as electricity storage system (ESS), heat storage system (HST), and hydrogen storage system (HGS). However, large-scale HGS access to MGs still faces technical barriers of high-pressure resistance and leakage prevention. Chahartaghi and Sheykhi, (2019) utilized hydrogen as a working gas of combined cooling, heating, and power generation driven by the Stirling engine (CCHPSE). By controlling the operating parameters of CCHPSE and P2H, pollutant emission reduction and primary energy saving of MG were achieved. Han et al. (2019), Kumar et al. (2020), and Zhang and Wei (2020) proposed a series of control strategies to improve the energy utilization rate and reduce the switching loss of devices in the hydrogen production–storage–distribution process.
It should be pointed out that the aforementioned studies underlie the hypothesis of multiple types of equipment accessing to MGHs. Nevertheless, the economic operation of single-function MGHs, for e.g., hydrogen refueling stations (HFSs), which are only equipped with P2H and a few units for a reserve, is still intractable. For this type of MGH, exploiting more inexpensive primary energy to supply P2H is the most direct and effective means to improve operating economics. Unfortunately, geography and infrastructure impose significant limitations on this approach (Fu et al., 2019) (Ma et al., 2019). In brief, the restrictions of the economic operation of MGH in this situation can be summarized as follows: 1) the distribution of different types of energy is restricted by geography. 2) The demand for hydrogen is not evenly distributed geographically, for example, when fossil fuels can be cheaply obtained and renewable energy is scarce in local, hydrogen will not be the first choice due to more pollutant emissions from the combustion of primary energy of energy-consuming P2H. 3) The infrastructure necessary to transport fossil fuels across regions is inadequate. For example, the transmission of natural gas within Gansu Province of China is tricky due to the much higher construction cost of the natural gas network than the power grid, which has been well built (Yunna and Ruhang, 2013), ambiguous property rights definition, and lack of unified gas storage standard. 4) It is difficult to transmit hydrogen across regions. The common transmission method, i.e., blending hydrogen into the gas pipeline, greatly degrades durability and integrity of the pipeline on account of hydrogen embrittlement (Pluvinage et al., 2019).
Fortunately, benefiting from the electric power industry with the extensive network coverage in some countries (Yang et al., 2021), the difficulties in the economic operation of MGH can be solved through clustering MGs with different characteristics into multi-microgrids (MMGs). In this context, Karimi and Jadid, (2020) modeled the uncertainty of RGs as a stochastic optimization and proved that off-grid MMGs perform better than grid-connected MMGs in reducing energy losses and pollutant emissions. However, without grid support, dramatic undulation of output of fossil fuel units and drastic fluctuations in the power channels (PCs) between MGs may be caused by load variation. As a result, the wear and tear of equipment and the cost of operation and maintenance also increase (Chapaloglou et al., 2019). Arefifar et al. (2017) designed an energy management success index according to the probability of RGs and load to measure operation cost optimization effect in different scenarios before and after the energy management process. Rezaei and Pezhmani, (2022) constructed an MMG coalition of MGHs with different types and capacities of RGs and utilized an electricity demand response program and carbon trading to reduce the operation cost covering the environmental cost. Nevertheless, there are still few studies on the impact of multiple loads integrated into demand response in the scheduling of MMG.
To solve the aforementioned challenges, a scheduling model considering the different energy structures of various MGs (including MGH) and a power interaction strategy adapting to an actual working condition of units in MGH is proposed in this study. The most significant contributions of this study are summarized as follows:
1) A collaborative scheduling model is established to reduce the operational cost of the off-grid MMG and maximize the utilization of renewable energy. Here, the typical three types of microgrids, namely, the energy-consuming integrating P2H with thermoelectric property, the energy-producing, and the hybrid) are depicted to participate in MMG scheduling. Moreover, the renewable energy with uncertainty is processed with the sequence operation theory, and the scheduling potential of multiple loads in various MGs is explored.
2) A federated demand response programming considering predictive mean voting (PMV) is designed to coordinate loads of schedulable electricity, heat, and hydrogen in different MGs. By this means, the multi-type demands are met, while the user satisfaction and comfort in each MG are kept within an acceptable range.
3) A power interaction method suitable for an actual scenario of constant transmission power on the power channels and weak power regulation capability of MT in MGH is proposed. By this method, the operating periods of MT are cut, and the peak is shaved. However, the MT operates at the optimum load level so that continual variation of the output of MT is alleviated and wear and tear of equipment is reduced.
The rest of the article is structured as follows: Section 2 illustrates the architecture of MMG; in Section 3, the collaborative scheduling model of MMG is established; a set of simulations on a test system is carried out in Section 4 to prove the effectiveness of the proposed method; and conclusions are drawn in Section 5.
2 Multi-microgrid architecture
As shown in Figure 1, MMG discussed in this study consists of three types of MGs: the energy-producing, the energy-consuming (ECM), and the hybrid. Among them, the energy-producing denotes the MG only exporting power; the ECM refers to the MG only importing power, and the hybrid is the MG supporting bidirectional power to other MGs. Each of them is equipped with wind turbines (WTs) or photovoltaic panels (PVs). In addition, electricity storage systems (ESSs), heat storage systems (HTSs), hydrogen storage systems (HDSs), electric boiler (EB), and MT are allocated in different MGs according to respective energy structures. The buildings have electricity or heat loads or both. The HFS in ECM sells the hydrogen power from P2H and HDS for profit.
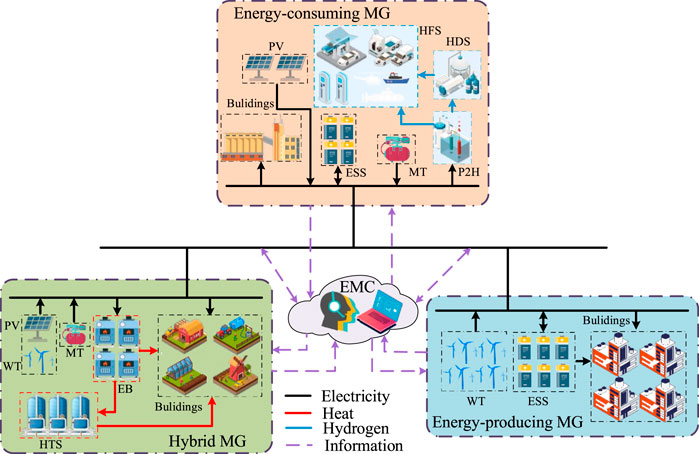
FIGURE 1. Multi-microgrid architecture.
The MGs are connected through power channels (PCs) and operate in off-grid with the regulation of a centralized energy management center (EMC). When the scheduling program is processed, EMC seeds commands to each MG and PC and monitors their real-time operating conditions. In this study, EMC adapts to two management modes: 1) in the liberty scheduling mode, power fluctuation on PC is free from control, and all devices in MMG are flexible enough to accept scheduling; and 2) in the constant power transmission mode, the weak power regulation ability of MG in ECM and constant power transmission with the assistance of high-voltage power transmission (Ambriz-Pérez et al., 2008; Okba et al., 2012) are considered, and EMC should conduct the operation command to MT and ESS of ECM in advance.
3 Methodology
3.1 Objective function
The objective function of scheduling of MMGs is to minimize the total operation and maintenance costs in the scheduling cycle T as follows:
where Ctotal is the total operation and maintenance costs of the MMG, Cfuel,j(t) is energy transaction cost of the jth MG in the period t, CFDR,j(t) is demand response compensation cost, CSPC,j(t) is degradation cost of the storage device including ESSs, HTSs, and HDSs, Cenv,j(t) is environmental cost, and CPC,l(t) is power interaction cost.
where the operating status and start–stop status of microturbine (MT) in the jth MG are denoted as UMT,j(t) and Sj(t), respectively; κj, σj, and ωj represent fuel consumption cost coefficient of start–stop, fixed operating, and operating statuses, respectively; PMT. j(t) is the output of the jth MT; ωhyd is the price of hydrogen; and QMT,j(t) and Ghyd,j(t) represent consumed natural gas and sold hydrogen in the jth MG, respectively.
where the compensation costs of interrupted electricity load PIE j(t), interrupted heat load HIH j(t), and interrupted hydrogen load GIG j(t) are expressed as λIE, λIH, and λIG, respectively; and λSE, λSH, and λSG are the compensation costs of shifted electricity load PSE j(t), shifted heat load HSH j(t), and shifted hydrogen load GSG j(t). Notably, only loads interrupted or shifted from the period t are compensated:
where the degradation costs of storage devices include switching degradation costs and discharge/charge degradation costs. UESSdis,j(t), UESScha,j (t), UHTSdis,j(t), UHTS cha,j (t), UHDS dis,j(t), and UHDS cha,j(t) are all binary and indicate the discharge and charge states of ESS, HTS, and HDS in the jth MG, respectively. The unit switching degradation costs of ESS, HTS, and HDS are ωESS,j, ωHTS,j, and ωHDS,j, respectively. PESSdis,j(t), PESS cha,j(t), HHTSdis,j(t), HHTScha,j(t), GHDSdis,j(t), and GHDScha,j(t) express the discharge and charge energy of ESS, HTS, and HDS in the jth MG, respectively. ηESS,j, ηHTS,j, and ηHDS,j are unit discharge/charge degradation costs.
where ρj and ωpen,j are pollution emission intensity of the MT and penalty cost of the pollutant and λexe,l and Pl(t) represent the unit power interaction cost and interacted power on the lth PC, respectively.
3.2 Constraints
a) Power to hydrogen
The P2H utilizes electricity for water splitting and produces hydrogen power and heat power, which can be expressed as follows (Pan et al., 2020):
where TPH(t) is the operating temperature of P2H; PPH(t), GPH(t), and HPH(t) denote input electricity, produced hydrogen power, and produced heat power, respectively; and a1, b1, a2, and b2 are parameters approximated by linearizing the operation region of P2H.
To avoid heat power build-up that would cause the temperature to exceed critically and destroy the devices, the fan assists in cooling. Meanwhile, similar to thermodynamic properties of buildings (Lu et al., 2020), this study considers the thermodynamic model of P2H, as shown in Figure 2.
where the thermal resistance and capacity of P2H are equal to RPH and TPH; Tamp(t) is the environment temperature; Hfan(t) is the heat extracted by the cooling fan; and Hloss(t) is heating loss. TPH,min and TPH,max are required for upper and lower operating temperatures.
b) Federated demand response
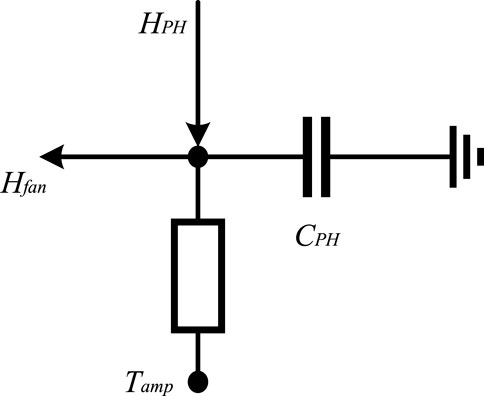
FIGURE 2. Thermodynamic model of P2H.
Federated demand response (FDR) integrates schedulable loads in all MGs so that demand response characteristics are present in the interior of each MG and the exterior of MMG. The schedulable electricity load can be expressed as
where P0j(t) and Pj(t) are electricity load before and after scheduling in the jth MG, PSE j,max denotes the upper bound of the shifted electricity load, and PIE j,max represents the upper bound of interrupted electricity.
The schedulable hydrogen load is similar to the electricity load as follows:
The heat load is related to indoor and outdoor temperature (Pan et al., 2017; Li et al., 2020). In this study, a transient heat balance equation is used to depict a connection between the heat load and temperature, which can be expressed as
where Tin,j(t) and Tamp,j(t) are indoor and outdoor temperatures (°C), respectively; Kj, Fj, and Vj denote integrated heat transfer coefficient (W·m−2·°C−1), surface area (m2), and volume (m3) for buildings, respectively; and cair and ρair are specific heat capacity (kJ·kg−1·°C−1) and density (kg·m−3) for air, respectively. Meanwhile, the PMV index (Mao et al., 2019) is introduced to describe the acceptable heat comfort range for users:
where M is the human energy metabolism rate, Icr is the heat resistance of clothing, and Ts is the average skin temperature. The variation range of PMV can be represented as
The interrupted and shifted heat load is similar to Eq. 11 given as
To consider the energy satisfaction of electricity, heat, and hydrogen in all MGs concurrently, a federated demand response satisfaction index (CDI) is designed, which is the average of the demand response satisfaction index of electricity (ESI), heat (HSI), and hydrogen (GSI), as follows:
c) Microturbine and electric boiler
The output of MT obeys the constraints as follows:
where ωgas, ηMT, and HCV denote the cost of per unit natural gas, efficiency coefficient of MT, and calorific value of natural gas and RAj,min and RAj,max are the lower and upper bound of ramping power of the MT in the jth MG, respectively.
The operation of electric boiler (EB) obeys the constraints as follows:
where PEB,j(t), ηEB, and HEB,j(t) denote the electric power consumed by EB, electrothermal efficiency of EB, and heat power output by EB, respectively.
d) Storage device
ESS, HTS, and HDS share similar charge/discharge characteristics. Taking ESS as an example, it satisfies the constraints of charge/discharge power and capacity as follows:
where CESS j(t) is the capacity of ESS in the jth MG; kloss, ηESSdis, and ηESScha are its loss rate, discharging, and charging efficiency, respectively; SESSj is rated capacity of ESS in the jth MG; and [αL, αU] is the SOC range allowed for charge and discharge.
e) Energy balance
The balance equations of electricity, heat, and hydrogen powers in each MG are expressed as Eqs. (21)–(23). In particular, Lej(t) is used to offset the energy imbalance caused by the excessive renewable energy generations’ (RGs’) output:
3.3 Model transformation
The nonlinear terms and the uncertainty of output of RGs in the proposed scheduling model pose a difficulty for the solution. In this section, linearization and sequence operation methods transform the original model to be a MILP which is solvable for CPLEX.
a) Elimination of maximum operators
To eliminate max{.} in Eq. 3, a set of continuous variables and binary variables are introduced. Taking max{-PSE j(t),0} as an example,
where ε1, ε2, and ε3 are continuous variables and θ1, θ2, and θ3 are binary variables.
b) Elimination of absolute operators
To eliminate |.| in Eqs. 6–17, a set of continuous variables and binary variables is introduced. Taking |Pj(t)-Pj0(t)| as an example,
c) Probabilistic sequence of RGs
The outputs of WT and PV are intermittent and random, and probability density functions (PDFs) are usually used to describe the uncertainty. WT output and PV output obey the Weibull distribution and Beta distribution, respectively. In the period t, the sequence operation (SO) (Kang et al., 2002; Li et al., 2020) is used to discretize their respective PDFs according to the preset discretization step length, and then the probabilistic sequences a (ia,t) are obtained. Taking the WT as an example, the length of the WT output sequence is as follows:
where [x] represents the largest integer less than x, PWTmax,t represents the maximum output of the WT in period t, and q denotes the discretization step length. The WT output sequence can be calculated as
where E (PWT t) is the expected output of WT in the period t. The expected output of PV is similar to the aformentioned equation.
3.4 Constant power interaction method
The violent power fluctuation on PCs will bring negative effects such as shortened equipment life, increased operation and maintenance costs, and increased construction costs of the channel and auxiliary devices. In addition, MT equipped in ECM like HFS is rarely equipped with a complete power regulating system, including fuel servo and speed control, so it is tough to accept dramatic changes in output. Under this circumstance, it is a popular method to set a fixed charge/discharge threshold (SFT) for the ESS in ECM according to the net load, thereby alleviating the power regulation pressure of the MT (Wang et al., 2013; Lucas and Chondrogiannis, 2016). However, the threshold is easy to increase the extra operating time of the MT. In order to improve operating efficiency and decrease operating periods of MT in ECM, we propose an MMG interaction method suitable for the scenario of the PC constant power:
The power of the PC connected to the ECM satisfies
where Poptl is the optimum transmission capacity on the lth PC connected to the ECM, which is allowed to fluctuate within [1-αl,1+αl], and the optimum total power transmitted to ECM is kept as PoptlEC.
We define optimum load capacity of MT in ECM as
where SECMT is the installed capacity of MT in ECM and μMT is the optimum load coefficient. In the PC constant power scenario, MT in ECM is off or operates at an optimum load capacity.
Algorithm 1. Constant power interaction method.
1: Initialization: input parameters of MMG, Set PECN = PEC + PPH,EC-E (PDGEC)
2: For t = 1:T
3: Switch ((PECN(t), CESSEC(t)))
{
4: Case A (PECN(t)>PoptlEC+PECOMT and CESSEC,min<CESSEC(t)<CESSEC,max): PESSdis,EC(t)=PECN(t)-PoptlEC; SEC(t) =1; break;
5: Case B (PoptlEC+PECOMT>PECN(t)>SESSEC+PoptlEC and CESSEC,min<CESSEC(t)<CESSEC,max): PESScha,EC(t)=PoptlEC+PECOMT -PECN(t); SEC(t)=1; break;
6: Case C (SESSEC+PoptlEC>PECN(t)>PoptlEC and CESSEC,min<CESSEC(t)<CESSEC,max): PESSdis,EC(t)=PECN(t)-PoptlEC; SEC(t)=0; break;
7: Case D (PoptlEC>PECN(t)>PoptlEC-SESSEC): PESSdis,EC(t)=0;PESScha,EC(t)=0; SEC(t)=0; break;
8: Case E (PECN(t)<PoptlEC-SESSEC and CESSEC,min<CESSEC(t)<CESSEC,max): PESSdis,EC(t)=PoptlEC- PECj(t); SEC(t)=0; break;
}
9: end for
10: Obtain {SEC, PESSdis,EC, PESScha,EC}
4 Case study
In this study, an MMG is used as a simulation system to examine the effectiveness of the proposed method, as shown in Figure 3. The MGH is an energy-consuming MG, the MGB is an energy-producing MG, and the MGC is a hybrid MG. All tests are carried out for 24 h, each time with an 1-h increment. The expected output of RGs in the three MGs processed in the method introduced in 3.3, the indoor and outdoor temperature of MGB, and loads in each period are shown in Figure 4. The maximum outputs of the PV in MGH and MGB are 500 and 300 kW, respectively. The maximum outputs of the WT in MGB and MGC are 600 and 500 kW, respectively. The discretization step length is 5 kW.
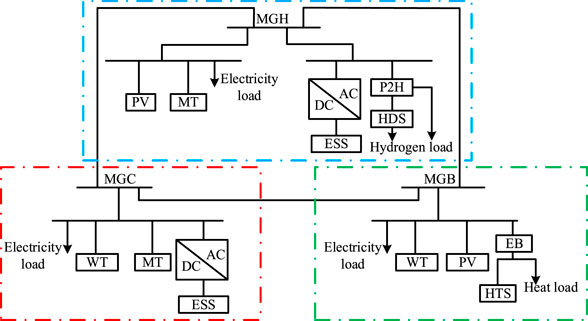
FIGURE 3. MMG test system.
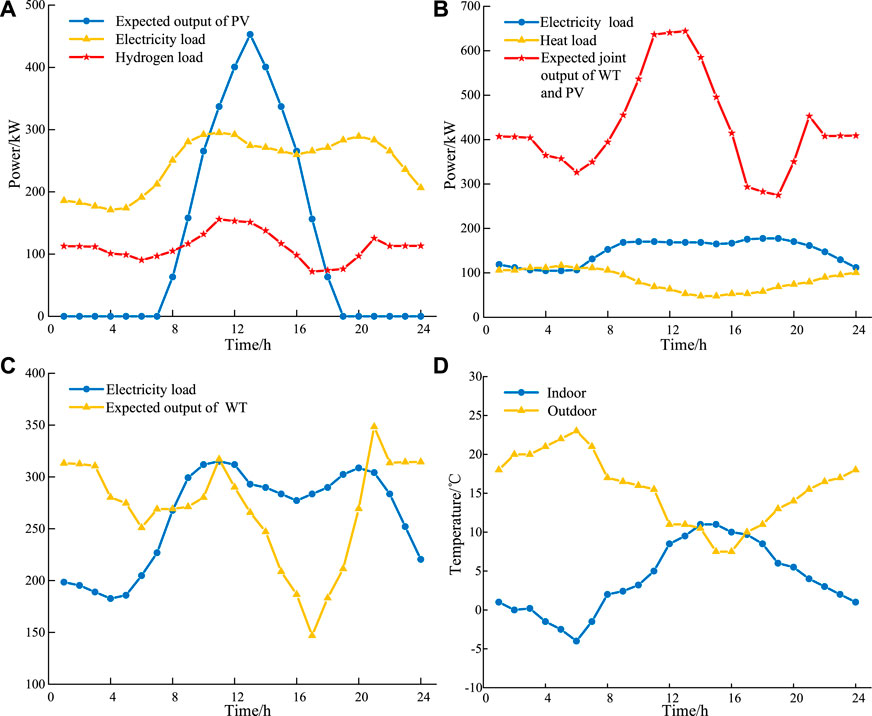
FIGURE 4. Parameters of MGs. (A) Parameters of load and RGs of MGH. (B) Parameters of load and RGs of MGB. (C) Parameters of load and RGs of MGC. (D) Indoor and outdoor temperature of MGB.
The parameters of main equipment in MMG are as follows: PESSdis,max = 25 kW, PESScha,max = 25 kW, SESS = 100 kW, ηESSdis = ηESScha = 0.9, PMT,max = 500 kW, RAj,max = 200 kW, RAj,min = −200 kW, GHDSdis,max = 100 kW, GHDScha,max = 100 kW, SHDS = 300 kW, HHTSdis,max = 60 kW, HHTScha,max = 60 kW, SHTS = 120 kW, HEB = 300 kW, and ηEB = 0.99. The upper bound of the time-shifted and the interrupted hydrogen load are 15% and 10% of the total hydrogen load, respectively. The upper bound of the time-shifted and the interrupted heat load in MGB are 15% and 10% of the total heat load, respectively. The upper bound of the time-shifted and the interrupted electricity load in MGC are 15% and 10% of the total electricity load, respectively. In addition, the parameters related to other equipment operating are referred to Li et al. (2019), Pan et al. (2020), and Huang et al. (2022).
4.1 The impact of the connection structure of MMG
To verify the effectiveness of the cluster mode in assisting the operation of MGH, four scenarios are set. Scenario 1: disconnect all PCs of MMG, i.e., MGH, MGB, and MGC operate in isolation. Scenario 2: connect MGB with MGC, and MGH operates in isolation. Scenario 3: based on Scenario 2, connect MGH with MGC. Scenario 4: interconnect MGH, MGB, and MGC.
Table 1 shows the total operation and maintenance costs, environmental cost, and RGs curtailment of MMG in different connection structures of MMG. It can be observed that, in scenario 1, when all PCs of MMG are disconnected, the three MGs can only supply loads through their own energy source, which results in excess RGs in the MGB. The energy of MGH is insufficient, and it is necessary to increase its own MT output to maintain the balance between supply and demand, resulting in a significant increase in pollutant emissions.
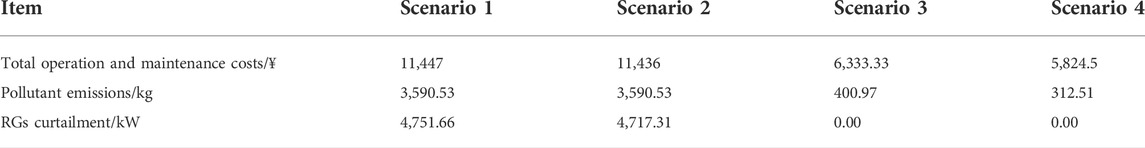
TABLE 1. Economic items under different scenarios.
Compared with Scenario 1 and Scenario 2, the addition connection of PC of MGB-MGC in Scenario 2 does not significantly improve the economy. The reason is that MGC is a hybrid system and does not need energy supply from MGB. Hence, it has little influence on improving the consumption of RGs in MGB and thus fails to improve the RG curtailment.
After connecting PC of MGB-MGC in Scenario 3, the MGA can be supplied by MGB through PCs of MGB-MGC and MGC-MGA to reduce the output of MT in the MGH and improve the RG consumption in MGB. Compared with scenario 3, total operation and maintenance costs and pollutant emissions of Scenario 4 are further reduced. The reason is that after connecting the PC of MGB-MGH in Scenario 4, the MGB can directly transmit the excess RGs to the MGC through the PC of MGB-MGH to reduce the transmission cost.
To evaluate the impact of PC capacity on the economic operation of MMG, 21 scenarios with different PC capacities are set, which are 0%, 10%, 20%,. . ., 200% of the default value, respectively.
It can be observed from Figure 5A that, with the increase in the transmission capacity of the PCs, the total operation and maintenance costs, environmental cost, and RG curtailment are gradually reduced and kept constant (extra construction costs are not included) after the transmission capacity of the PCs reaching 200 kW. The analysis shows that the appropriate set of transmission capacity of the PCs is conducive to the reduction of MMG operating cost, emissions, and the increase in RG consumption. Figure 5B compares the impact of the transmission capacity of different PCs. It can be seen that the transmission capacity of PC of MGH-MGB has a higher sensitivity to the total operating cost. The reason is that the MGB, the energy-producing, transmits energy to energy-consuming MGH to maintain a balance between the supply and demand. The analysis shows that the transmission capacity of PC of MGH-MGB has a greater impact on the transmission power, which results in a greater impact on the operating cost of MMG.
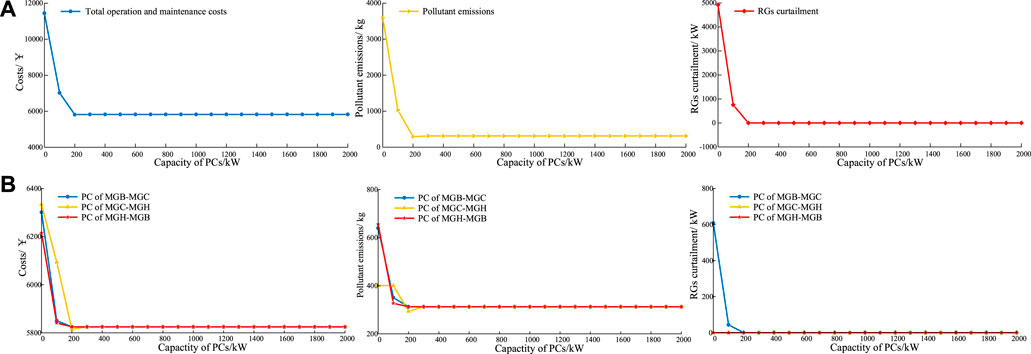
FIGURE 5. Sensitive test of transmission capacity of the PCs. (A) Impact of the transmission capacity on all PCs. (B) Impact of the transmission capacity on different PCs.
In terms of pollutant emissions, the transmission capacity of the PC of MGC-MGH is more sensitive. The reason is that pollutant is mainly emitted by MGH, and the expansion of transmission capacity of the PC of MGC-MGH increases the transmission of RGs to the MGH, thereby reducing pollutant emissions.
4.2 The impact of federated demand response
We illustrate the electricity, heat, and hydrogen load scheduling scheme before and after FDR in Figure 6. It indicates that the electricity, heat, and hydrogen load increases around 12:00 after the FDR. The reason is that the RG output is sufficient during this period, and the loads are shifted to consume RGs. The analysis shows that the loads are redistributed through FDR, and the consumption level of RG and the MMG operation economy are improved.
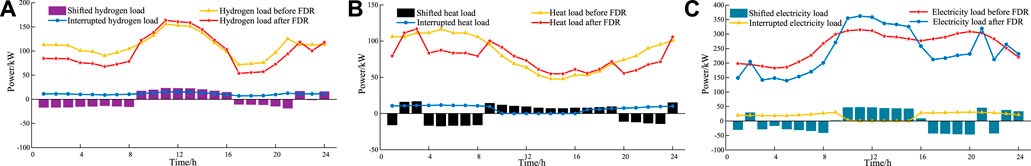
FIGURE 6. Load scheduling scheme before and after FDR. (A) Hydrogen load in MGH. (B) Heat load in MGB. (C) Electricity load in MGB.
Figure 7 shows the CDI of the MMG and satisfaction indexes of each MG in a scheduling cycle. It can be observed that the satisfaction of MGH is always at the lower bound, which is caused by the lack of its own energy. CDI reflects the overall satisfaction level of the MMG. On the basis of meeting the electricity, heat, and hydrogen demands of MMG, the energy supply pressure can be relieved, and the operation economics of MMG can be improved by reducing the CDI and adjusting the bounds of electricity, heat, and hydrogen demand response.
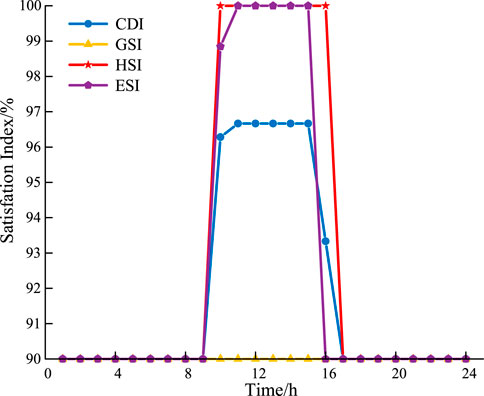
FIGURE 7. CDI of the MMG and satisfaction indexes of each MG.
To analyze the impact of the FDR on the operational costs of MMG, we design four scenarios as follows:
Scenario 1: not considering the demand response.
Scenario 2: considering the demand response of electricity and not considering the demand response of heat and hydrogen.
Scenario 3: considering the demand response of electricity and heat and not considering the demand response of hydrogen.
Scenario 4: considering FDR, that is, demand response of electricity, heat, and hydrogen simultaneously.
Table 2 shows that FDR reduces total operation and maintenance costs by 11.21%, 3.02%, and 1.08% compared with scenarios 1, 2, and 3. Meanwhile, FDR reduces pollutant emissions by 69.74%, 49.36%, and 39.69%, respectively. In addition, only in Scenario 1, RGs are curtailed. The analysis reveals that FDR can effectively save operating and maintenance costs, reduce pollutant emissions, and improve the consumption of RGs.

TABLE 2. Comparison of economy under different scenarios of demand response.
4.3 The impact of the constant power interaction method
In this section, the simulation results are presented to demonstrate the superiority of the proposed constant power interaction method over the SFT method on operating period reduction of MG and peak shaving. In the simulation, EC denoting MGH and PECN(t) is the original net load, which can be calculated using Algorithm 1.
Figure 8 shows the simulation results with the proposed and SFT methods. Here, the ESS in MGH discharges when the net load is above the threshold set by the SFT; otherwise, it charges (Wang et al., 2013). It can be observed from Figure 8A that SOC of ESS with the proposed method has fewer types of the slope than that with the SFC method. It means that the charge/discharge rate of ESS is more stable with the proposed method. The analysis reveals that the proposed method comprehensively considers the net load, load level of MT, and capacity of ESS to improve the charging/discharging efficiency.
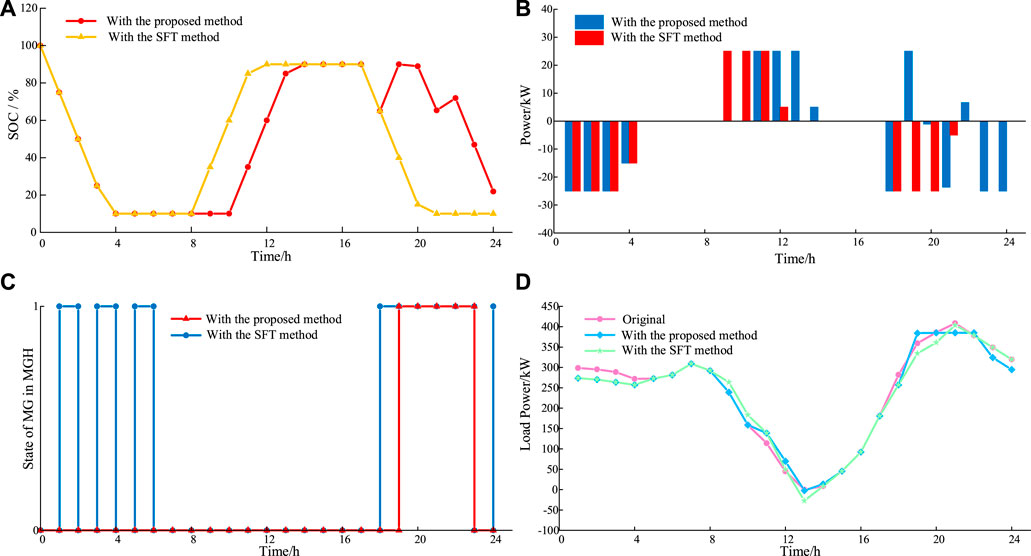
FIGURE 8. Simulation results with the proposed method and SFT method. (A) SOC of ESS in MGH. (B) Charge/discharge power of ESS in MGH. (C) On–off state of MG in MGH. (D) Net load power in MGH.
Figure 8B and Figure 8C indicate that, in the period of {1:00, 2:00, 3:00, 4:00, 5:00, 6:00, 7:00, 8:00, 18:00, 23:00, 24:00}, SESSEC+PoptlEC>PECN(t)>PoptLec and ESS in MGH start discharging to compensate for the lack of power. However, the capacity reaches its lower bound (0.1SESSEC) in the period of {5:00, 6:00, 7:00, 8:00} so that ESS refuses to discharge. In the period of {9:00, 10:00, 17:00}, PECN(t)<PoptlEC-SESSE and ESS neither charges nor discharges to prevent MG, not operating at optimum efficiency. In the period of {11:00, 12:00, 13:00, 14:00, 15:00, 16:00}, PECN(t)<PoptlEC-SESSEC and ESS start charging until the capacity reaches its upper bound (0.9SESSEC) in the period of 15:00. In the period of {19:00, 22:00}, PoptlEC+PECOMT>PECN(t)>SESSEC+PoptlEC and the charge power are the upper bound value and PoptlEC+PECOMT -PECN(t), respectively. In the period of {20:00, 21:00}, PECN(t)>PoptlEC+PECOMT and CESSEC,min<CESSEC(t)<CESSEC,max and discharge power of ESS are PECN(t)-PoptlEC.
The results of Figure 8C show that the proposed method reduces MT operating periods by 8 h compared with the SFT method. In addition, it can be seen from Figure 8D that the performance of peak shaving when using the proposed method is better than that using the SFT method. It means that the charge of ESS takes full advantage of the power of operating MT, and the discharge of ESS occurs during the peak load periods when the MT is most likely to be started. The analysis reveals the effectiveness of the cases divided in Algorithm 1.
5 Conclusion
To alleviate the primary energy shortage of some MGHs, we establish a collaborative scheduling model of MMG to coordinate the operation of MGH and other MGs with different characteristics and optimize the cross-regional interaction of energy. In the model, multi-type loads from various MGs participate in scheduling under the coordination of federated demand response. In addition, given the actual scenario of PC constant transmission power and weak power regulation capability of MT in MGH, a power interaction method is designed to improve MT operating efficiency. The simulation results demonstrate the following conclusions:
1) The established collaborative scheduling model of MMG significantly improves the total operating economy and reduces the RGs curtailment of the energy-producing MGB from 4,751.66 kW to 0 kW . Moreover, the total pollutant emissions decrease by 91.3%, and the operating costs decrease by 49.1%. The sensitivity analysis shows that the appropriate configuration of the capacity of PCs is conducive to the economic operation of MMG.
2) The proposed federated demand response program aggregates the loads within MMG as a schedulable grid asset, with CDI reflecting the collective satisfaction of all loads. By keeping the CDI in an acceptable range, the total operation and maintenance costs and pollutant emissions are reduced by 11.21% and 69.74%, respectively, while balancing energy supply and demand.
3) The designed interaction method under the scenario of constant power transmission of PCs efficiently controls the charge/discharge of the ESS and the start/stop of the MT in MGH. Compared with the SFT method, the suggested method enables the MT to operate at an optimum load capacity while reducing the operating time by 61.5% and improving peak shaving performance.
Data availability statement
The original contributions presented in the study are included in the article/Supplementary material. Further inquiries can be directed to the corresponding author.
Author contributions
QH and YZ conceived and designed the research. QH and YZ carried out the simulations and analyses. All authors contributed to the discussion on the method and the writing of this manuscript.
Funding
This work was supported by the Science and Technology Project of State Grid Corporation of China (5108-202218280A-2-0-XG).
Conflict of interest
YL was employed by company State Grid Jiangsu Electric Power Company Limited.
The remaining authors declare that the research was conducted in the absence of any commercial or financial relationships that could be construed as a potential conflict of interest.
Publisher’s note
All claims expressed in this article are solely those of the authors and do not necessarily represent those of their affiliated organizations or those of the publisher, the editors, and the reviewers. Any product that may be evaluated in this article, or claim that may be made by its manufacturer, is not guaranteed or endorsed by the publisher.
References
Ambriz-Pérez, H., Acha, E., and Fuerte-Esquivel, C. R. (2008). High voltage direct current modelling in optimal power flows. Int. J. Electr. Power & Energy Syst. 30, 157–168. doi:10.1016/j.ijepes.2007.06.010
Arefifar, S. A., Ordonez, M., and Mohamed, Y. A.-R. I. (2017). Energy management in multi-microgrid systems—development and assessment. IEEE Trans. Power Syst. 32, 1–922. doi:10.1109/TPWRS.2016.2568858
Arutyunov, V. S., and Lisichkin, G. V. (2017). Energy resources of the 21st century: problems and forecasts. Can renewable energy sources replace fossil fuels? Russ. Chem. Rev. 86, 777–804. doi:10.1070/RCR4723
Chahartaghi, M., and Sheykhi, M. (2019). Energy, environmental and economic evaluations of a CCHP system driven by Stirling engine with helium and hydrogen as working gases. Energy 174, 1251–1266. doi:10.1016/j.energy.2019.03.012
Chapaloglou, S., Nesiadis, A., Iliadis, P., Atsonios, K., Nikolopoulos, N., Grammelis, P., et al. (2019). Smart energy management algorithm for load smoothing and peak shaving based on load forecasting of an island’s power system. Appl. Energy 238, 627–642. doi:10.1016/j.apenergy.2019.01.102
Eghbali, N., Hakimi, S. M., Hasankhani, A., Derakhshan, G., and Abdi, B. (2022). Stochastic energy management for a renewable energy based microgrid considering battery, hydrogen storage, and demand response. Sustain. Energy, Grids Netw. 30, 100652. doi:10.1016/j.segan.2022.100652
Fu, J., Wei, X., Luo, S., Zuo, Z., Zhou, H., Liu, B., et al. (2019). Discovery and geological knowledge of the large deep coal-formed qingyang gas field, ordos basin, NW China. Petroleum Explor. Dev. 46, 1111–1126. doi:10.1016/S1876-3804(19)60267-3
Gielen, D., Gorini, R., Wagner, N., Leme, R., Gutierrez, L., Prakash, G., et al. (2019). Global energy transformation: A roadmap to 2050, Available at: https://www.h2knowledgecentre.com/content/researchpaper1605 (accessed May 29, 2022).
M. Hafner, and S. Tagliapietra (Editors) (2020). The geopolitics of the global energy transition (Cham: Springer International Publishing). doi:10.1007/978-3-030-39066-2
Han, Y., Zhang, G., Li, Q., You, Z., Chen, W., and Liu, H. (2019). Hierarchical energy management for PV/hydrogen/battery island DC microgrid. Int. J. Hydrogen Energy 44, 5507–5516. doi:10.1016/j.ijhydene.2018.08.135
Hu, G., Chen, C., Lu, H. T., Wu, Y., Liu, C., Tao, L., et al. (2020). A review of technical advances, barriers, and solutions in the power to hydrogen roadmap, Available at: https://www.h2knowledgecentre.com/content/journal2315 (accessed July 31, 2022).
Huang, Y., Wang, Y., and Liu, N. (2022). Low-carbon economic dispatch and energy sharing method of multiple Integrated Energy Systems from the perspective of System of Systems. Energy 244, 122717. doi:10.1016/j.energy.2021.122717
Ishaq, H., and Dincer, I. (2021). Comparative assessment of renewable energy-based hydrogen production methods. Renew. Sustain. Energy Rev. 135, 110192. doi:10.1016/j.rser.2020.110192
Kang, C., Xia, Q., and Xiang, N. (2002). Sequence operation theory and its application in power system reliability evaluation. Reliab. Eng. Syst. Saf. 78, 101–109. doi:10.1016/S0951-8320(02)00048-0
Karimi, H., and Jadid, S. (2020). Optimal energy management for multi-microgrid considering demand response programs: A stochastic multi-objective framework. Energy 195, 116992. doi:10.1016/j.energy.2020.116992
Kovač, A., Paranos, M., and Marciuš, D. (2021). Hydrogen in energy transition: A review. Int. J. Hydrogen Energy 46, 10016–10035. doi:10.1016/j.ijhydene.2020.11.256
Kumar, K., Alam, M., Verma, S., and Dutta, V. (2020). Effect of hysteresis band control strategy on energy efficiency and durability of solar-hydrogen storage based microgrid in partial cloudy condition. J. Energy Storage 32, 101936. doi:10.1016/j.est.2020.101936
Li, Y., Yang, Z., Zhao, D., Lei, H., Cui, B., and Li, S. (2019). Incorporating energy storage and user experience in isolated microgrid dispatch using a multi-objective model. IET Renew. Power Gener. 13, 973–981. doi:10.1049/iet-rpg.2018.5862
Li, Y., Wang, C., Li, G., Wang, J., Zhao, D., and Chen, C. (2020). Improving operational flexibility of integrated energy system with uncertain renewable generations considering thermal inertia of buildings. Energy Convers. Manag. 207, 112526. doi:10.1016/j.enconman.2020.112526
Lu, S., Gu, W., Meng, K., Yao, S., Liu, B., and Dong, Z. Y. (2020). Thermal inertial aggregation model for integrated energy systems. IEEE Trans. Power Syst. 35, 2374–2387. doi:10.1109/TPWRS.2019.2951719
Lucas, A., and Chondrogiannis, S. (2016). Smart grid energy storage controller for frequency regulation and peak shaving, using a vanadium redox flow battery. Int. J. Electr. Power & Energy Syst. 80, 26–36. doi:10.1016/j.ijepes.2016.01.025
Ma, L., Chen, M., Fang, F., and Che, X. (2019). Research on the spatiotemporal variation of rural-urban transformation and its driving mechanisms in underdeveloped regions: Gansu Province in Western China as an example. Sustain. Cities Soc. 50, 101675. doi:10.1016/j.scs.2019.101675
Mao, N., Hao, J., He, T., Song, M., Xu, Y., and Deng, S. (2019). PMV-based dynamic optimization of energy consumption for a residential task/ambient air conditioning system in different climate zones. Renew. Energy 142, 41–54. doi:10.1016/j.renene.2019.04.099
Okba, M. H., Saied, M. H., Mostafa, M. Z., and Abdel- Moneim, T. M. (2012). High voltage direct current transmission - a review, part I. IEEE Energytech 2012, 1–7. doi:10.1109/EnergyTech.2012.6304650
Pan, Z., Guo, Q., and Sun, H. (2017). Feasible region method based integrated heat and electricity dispatch considering building thermal inertia. Appl. Energy 192, 395–407. doi:10.1016/j.apenergy.2016.09.016
Pan, G., Gu, W., Lu, Y., Qiu, H., Lu, S., and Yao, S. (2020). Optimal planning for electricity-hydrogen integrated energy system considering power to hydrogen and heat and seasonal storage. IEEE Trans. Sustain. Energy 11, 2662–2676. doi:10.1109/TSTE.2020.2970078
Pan, G., Hu, Q., Gu, W., Ding, S., Qiu, H., and Lu, Y. (2021). Assessment of plum rain’s impact on power system emissions in Yangtze-Huaihe River basin of China. Nat. Commun. 12, 6156–6210. doi:10.1038/s41467-021-26358-w
Pluvinage, G., Capelle, J., and Meliani, M. H. (2019). Pipe networks transporting hydrogen pure or blended with natural gas, design and maintenance. Eng. Fail. Anal. 106, 104164. doi:10.1016/j.engfailanal.2019.104164
Rezaei, N., and Pezhmani, Y. (2022). Optimal islanding operation of hydrogen integrated multi-microgrids considering uncertainty and unexpected outages. J. Energy Storage 49, 104142. doi:10.1016/j.est.2022.104142
Tostado-Véliz, M., Arevalo, W., and Jurado, F. (2021). A comprehensive electrical-gas-hydrogen microgrid model for energy management applications. Energy Convers. Manag. 228, 113726. doi:10.1016/j.enconman.2020.113726
Wang, Y., Tan, K. T., and So, P. L. (2013). “Coordinated control of battery energy storage system in a microgrid,” in 2013 IEEE PES Asia-Pacific Power and Energy Engineering Conference (APPEEC), Hong Kong, China, 8-11 Dec. 2013, 1–6. doi:10.1109/APPEEC.2013.6837211
Wu, J., Dong, L., Zhou, C., Liu, B., Xing, D., Feng, L., et al. (2019). Enhanced butanol-hydrogen coproduction by Clostridium beijerinckii with biochar as cell’s carrier. Bioresour. Technol. 294, 122141. doi:10.1016/j.biortech.2019.122141
Yang, B., Swe, T., Chen, Y., Zeng, C., Shu, H., Li, X., et al. (2021). Energy cooperation between Myanmar and China under one belt one road: current state, challenges and perspectives. Energy 215, 119130. doi:10.1016/j.energy.2020.119130
Yunna, W., and Ruhang, X. (2013). Current status, future potentials and challenges of renewable energy development in Gansu province (Northwest China). Renew. Sustain. Energy Rev. 18, 73–86. doi:10.1016/j.rser.2012.09.038
Zhang, Y., and Wei, W. (2020). Model construction and energy management system of lithium battery, PV generator, hydrogen production unit and fuel cell in islanded AC microgrid. Int. J. Hydrogen Energy 45, 16381–16397. doi:10.1016/j.ijhydene.2020.04.155
Keywords: multi-microgrids, power to hydrogen, demand response, microgrid interaction, energy management
Citation: Hu Q, Zhou Y, Ding H, Qin P and Long Y (2022) Optimal scheduling of multi-microgrids with power to hydrogen considering federated demand response. Front. Energy Res. 10:1002045. doi: 10.3389/fenrg.2022.1002045
Received: 24 July 2022; Accepted: 23 August 2022;
Published: 29 September 2022.
Edited by:
Bin Zhou, Hunan University, ChinaReviewed by:
Dongliang Xiao, South China University of Technology, ChinaMingfei Ban, Northeast Forestry University, China
Copyright © 2022 Hu, Zhou, Ding, Qin and Long. This is an open-access article distributed under the terms of the Creative Commons Attribution License (CC BY). The use, distribution or reproduction in other forums is permitted, provided the original author(s) and the copyright owner(s) are credited and that the original publication in this journal is cited, in accordance with accepted academic practice. No use, distribution or reproduction is permitted which does not comply with these terms.
*Correspondence: Qinran Hu, cWh1QHNldS5lZHUuY24=