 Renjie Luo
 Hanyi Wang
 Hui Deng2
 Zhiyi Li
- 1College of Electrical Engineering, Zhejiang University, Hang Zhou, China
- 2Electric Power Research Institute of State Grid Zhejiang Electric Power Co., Ltd., Hang Zhou, China
- 3Power Dispatching and Control Center, State Grid Heilongjiang Co., Ltd., Harbin, China
Recently, the interaction between power generation and load has been continuously strengthened, providing a new method for realizing the decarbonization of the power system. An auction method that enables a low-carbon economic dispatch is designed in this study, where blockchain technology is employed to record the whole process data credibly. According to the regional division of market entities, carbon emissions are allocated to regions and entities by using the Owen value method. In order to reduce the expected carbon emission of entities, an additional carbon price is added to the original quotation through the allocation results. Case studies are conducted based on the typical output characteristics of wind and photovoltaic power generation in the bilateral bidding market hourly. The results have validated that the proposed method can reduce expected carbon emissions in the power system by prioritizing zero-carbon and low-carbon generation units.
1 Introduction
Global warming is becoming more obvious with the intensification of greenhouse gas emissions (Zhongming et al., 2021). Hence, how to reduce carbon is an important topic. Among the carbon emissions of energy, the power system accounts for about 40% so that electricity will play an increasingly important role in the future. In building a power system with a higher proportion of renewable energy, how to realize renewable energy consumption is also crucial. In the first 5 months of 2022, China’s entire society consumed 3,352.6 billion kWh of electricity. As of the end of May 2022, coal-fired thermal power accounted for 49.3% of the installed capacity of power plants. At the same time, gas-fired power generation accounted for 4.8%, and grid-connected wind power and photovoltaic power generation accounted for only 15.1% and 9.3%, respectively. Currently, China has established a carbon market to meet the checks and balances on the proportion of renewable energy and thermal power units through carbon trading(Yue et al., 2021). The emission reduction of the power industry is a vital and challenging task, and people are constantly exploring solutions (Wang and Feng, 2017; Zhang D et al., 2017; Zhang X et al., 2017; Zhang Y.-J et al., 2017; Cheng Z et al., 2018). Therefore, in this study, it is significant to allocate the carbon cost to each entity and guide each entity to reduce emissions and actively participate in renewable energy consumption by means of a market mechanism.
Since the power industry and carbon emissions coexist, figuring out how to achieve decoupling between power and carbon emissions is a critical step in evaluating carbon properties. Some of the methods currently start from the input–output model to track the emission flow through the power grid and quantify the pollution, which is reflected in the power production, exchange, and final consumption of the corresponding institutions (De Chalendar et al., 2019). Some studies use input–output analysis (EIOA) to calculate the implied emission intensity or use a top-down approach to assess the environmental footprint (Gao et al., 2022), while other studies convert electricity into emissions by using the EIA factor to convert fuel into emissions where energy carbon emissions are imputed (Goldstein et al., 2020). Furthermore, some studies decouple the two models by introducing the concept of carbon emission flow attached to the power flow (Kang et al., 2015; Tian et al., 2015). In addition, relevant operating scenarios also include quantifying carbon emissions related to energy transmission (Cheng Y et al., 2018) and conversion processes in multi-energy systems, coordinating energy generation, transmission, conversion, and utilization across different energy sectors, paths, and time scales, and implementing a hierarchical process (Huang et al., 2020). Some studies start from the perspective of cooperative games. At first, the Shapley value method can be used for the benefit distribution of internal members in the electricity market (Lei et al., 2020). Later studies regard the whole process of carbon allocation as a cost allocation process and use the Shapley value to share carbon emissions on the load and power generation sides (Chen et al., 2017). However, since the entire system is time-varying and carbon emissions are spatially and temporally different, a reasonable distribution cannot be achieved by simply describing them with fixed parameters.
At present, the existing research hardly allocates the carbon emissions to the power generations and loads. It changes the current trading cycle of quotations by considering the allocation to promote the realization of carbon reduction on both sides of power generation and loads. At the same time, in the current ideas of cooperative games, all market entities are regarded as the same class for cost allocation. However, due to the different geographical distribution of each entity as well as issues such as administrative divisions and policies, it does not take into account the impact of the division of the major leagues. Thus, they belong to cooperative games with coalition structure constraints, which is consistent with the characteristics of Owen’s value method. The research (Fiestras-Janeiro et al., 2015) proves the hypothesis of the Owen value. Moreover, the design of a bilateral bidding mechanism considering carbon allocations on both sides starts from the problems mentioned previously by adopting the two-level structure of region-entity. According to the Owen value method and the rules of bilateral bidding, the carbon allocation is set for the entity in each game. The carbon allocation result is transmitted as a price signal to original quotations of entities, and the final transaction is cleared according to the quotation after considering the change of carbon allocations.
Due to the process of quotation changing in the middle, in order to guarantee the traceability of the data, blockchain technology is used to realize the whole process recording on the chain. At present, some research studies have designed the transaction and settlement framework in the electricity market by blockchain (Xu et al., 2021), as well as simplified the transaction process and realized mutual trust between users (Zhou et al., 2021). At the same time, a decentralized trading market is designed in the distribution market for bilateral energy trading (Morstyn et al., 2018). Due to the blockchain consensus mechanism, various information silos are connected (Hamouda et al., 2020), and the problem of information tampering in distributed energy transactions is prevented (Tonev and Nikolaev, 2020). Some studies use private key encryption to protect the privacy of the auctioneer in the bidding process (Zhang et al., 2019). At the same time, there is also a two-level structure of the agent and transaction settlement in the transaction (Luo et al., 2018). It also establishes a regional structure for many types of entities and realizes inter-regional and cross-regional transactions (Li et al., 2021). In order to fit with the aforementioned region-entity two-level structure, a two-level blockchain structure with the main chain of the whole system and sub-chains of each region is designed. Blockchain technology is used in the overall process, and cross-chain between multiple blockchains is used. A blockchain is set up in the overall system to realize the traceability record of regional data and critical data in the transaction, and the aforementioned method is written into the smart contract to transmit the optimal unit output across the chain to each regional blockchain for scheduling. The innovations are as follows:
1) The Owen value method is used to allocate carbon emissions in two levels. The Shapley method is used between regions, and the improved Shapley method is used for each entity in the region to achieve a reasonable allocation.
2) The process of carbon allocation is integrated into the quotations of the current trading bilateral market. In that case, the factor of carbon allocation can be fully considered while satisfying social welfare in the final transaction.
3) Blockchain technology is used to record the corresponding data of the whole process to the chain and realizes the operability and achievability of the process by adopting a two-level blockchain structure.
The remaining contents of this article are as follows: Section 2 introduces the operation process of the whole market mechanism. Section 3 introduces the main models and methods. Section 4 analyzes the results through simulation. Section 5 gives the conclusion and summarizes the whole article.
2 Bilateral electricity market framework with carbon emission allocation
The article follows the general idea of using carbon emissions as a price signal to change the auction before the completion of the current transaction. A cooperative game method is used to allocate carbon emissions to the power generation and load entities participating in the market. A new quotation is formed, taking into account the allocation results and the original quotation.
As shown in Figure 1, in the traditional bilateral bidding model in the electricity market, each entity quotes according to its economic cost while ignoring the environmental value, which is the impact of greenhouse gas emissions. In bilateral electricity trading considering carbon attributes, reasonable carbon allocation should be carried out according to the marginal effect of carbon emissions caused by the participation of each entity in the market. Market organizers make revisions based on the original quotation and the allocation results before the transaction. It considers not only the physical value of electricity but also its environmental value, which can promote the development of low-carbon generation and make the entire system develop toward the goal of a low-carbon and economical operation.
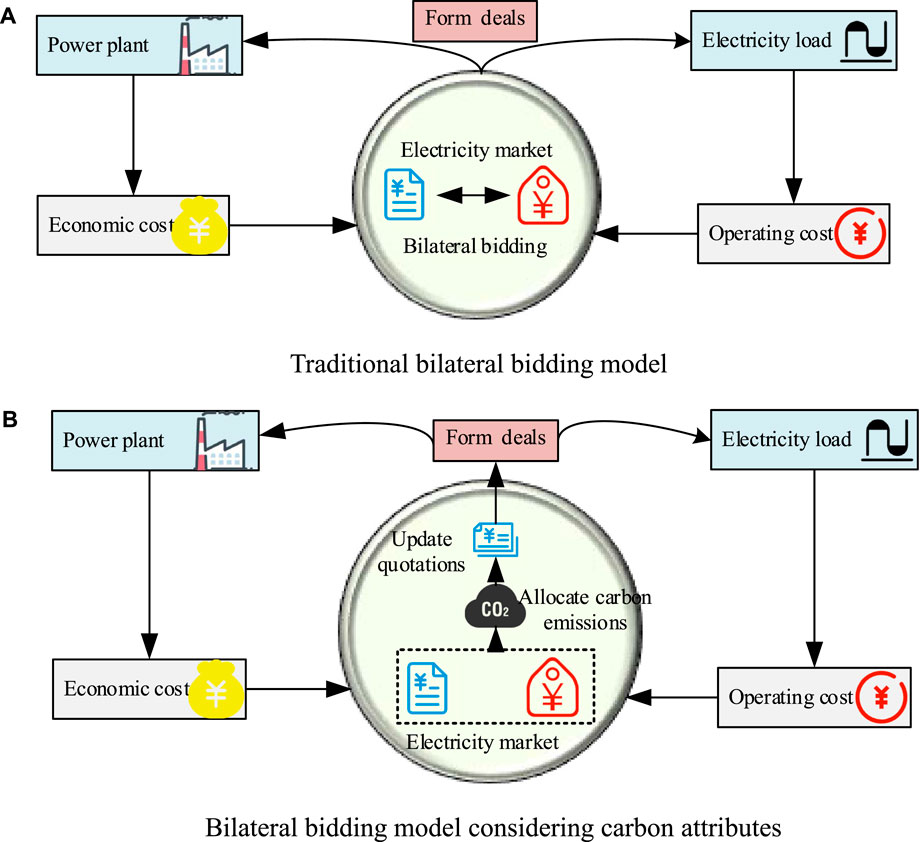
FIGURE 1. Schematic diagram of the change in the bilateral bidding model. (A) Traditional bilateral bidding model. (B) Bilateral bidding model considering carbon attributes.
The whole framework is divided into four parts, namely, transaction preparation, modification of quotations, final market transaction, and transaction data recording. The whole framework is shown in Figure 2.
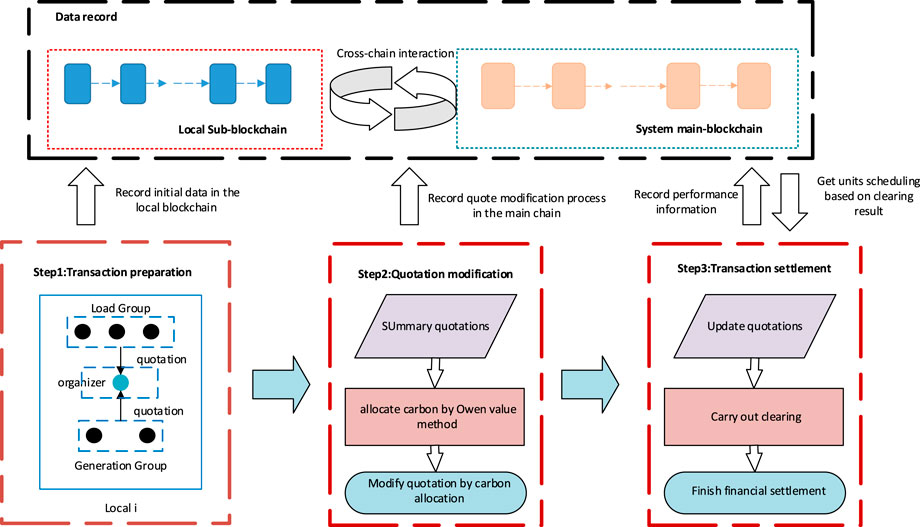
FIGURE 2. Schematic diagram of the overall framework.
In the transaction preparation process, each power generation entity reports data, including the upper and lower limits of output
In the modification of the quotation process, the Owen value method is used to allocate carbon emissions to each market entity by integrating the previously reported data. The allocation is to divide regional carbon emissions on the basis that each market entity is divided into regions. Then, the entities are divided according to the regional division results, and a ladder carbon price is set according to the allocation results, so as to make a new quotation. At the same time, according to the characteristics of the bilateral bidding market mechanism, in order to promote the low-carbon economic dispatch of the whole system, the additional quotation of the load entities should be negatively correlated with their carbon allocation. The additional quotation of the power generation entities should have a positive correlation with their carbon allocation.
In the final market transaction process, the latest quotation can be obtained based on the quotation of the market entity in the first step and the revised quotation in the second step. Based on the latest quotation, clearing is carried out according to the bilateral bidding model, and the output of each generation and the consumption of each load are distributed.
In the transaction data recording process, its aim is to record the data of the previous three steps, respectively, and realize the automatic implementation of the process through smart contracts. This process establishes a two-level blockchain system. First, the sub-chains in each region are used for the record of report data of market entities and the settlement after the final transaction. Then, the main chain for all regions is used to integrate the report data of each sub-chain to form and record a new quotation.
3 Model and methodology
In this section, detailed modeling regarding the whole mechanism is introduced.
3.1 Bilateral bidding market model
The electricity market clearing model based on bilateral bidding is as follows:
where
Since in the bilateral bidding model, the buyer’s quotations are sorted from high to low, the buyer can get more advantage in the auction if his bid is higher. The seller’s quotation is sorted from low to high, so the lower the seller’s quotation, the more the transaction will be prioritized, as shown in Figure 3.
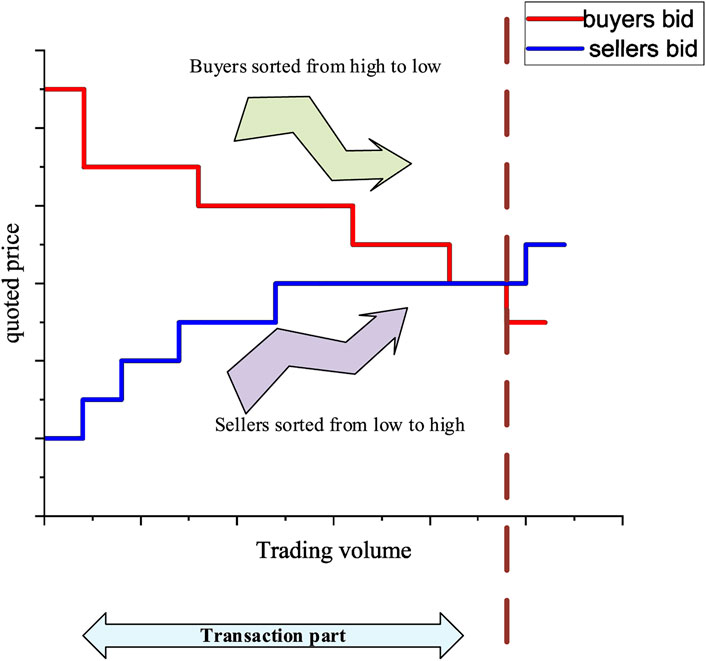
FIGURE 3. Bilateral bidding curve.
3.2 Carbon allocation model based on the Owen value method
At present, the carbon emission allocation method is adopted from the perspective of a cooperative game. Under the premise of considering axiomatic standards, the Shapley method has good fairness and consistency. At the same time, considering that each entity is divided according to administrative regions, it follows the priority alliance’s structure. Therefore, when allocating carbon emissions, it is necessary to separate them from the regional level first and then carry out the allocation of market entities according to the regional allocation results. In summary, this section adopts a two-level structure of the Owen value, and each level is allocated by the Shapley method. Each region can be treated as a priority alliance, and each market entity can be treated as a player in the game.
The carbon allocation of the entity is the additionally expected carbon emissions after the entity joins the bilateral market trading. However, the transaction is based on the modified quotations, which consider every allocation of the entity. The result of carbon allocation can be seen as a factor in the final transaction.
Assume that all market players form a set
where
1) First, use the Shapley value method to allocate carbon among regions, which is a priority alliance. The method is as follows:
where
When considering that all regions are randomly arranged, the probability of the region L is as follows:
where m represents the number of alliance structures and
2) According to the idea of the first step, the market players in a certain regional structure are first considered. The Shapley value method is used to calculate the marginal effect of additional allocation to the area when an entity joins the area. The method is as follows:
where
where
Specifically, the combinations of entities need to be considered in order to calculate all the marginal effects. When calculating the carbon allocation of the entity
1) Since the carbon allocation of the target entity is calculated by the marginal effect of the region when the entity participates in each combination, we need to calculate the carbon allocation of the region ζk in each combination of the entities. When some combination of set L after removing ζk is chosen, we can get the total carbon emissions of the system if a bilateral transaction is carried out in this combination. When we add the region ζk to the set L, we can get the total carbon emissions of the system again. In this way, the marginal effect of one combination case is obtained. Finally, we can get all the case results and add them to get the region of the target entity allocation, shown in Figure 4A.
2) When some combination R is chosen, the distribution of the entities in the region will change. Thus, Eq. 3 is used to calculate the allocation of the region, which is where the target entity is located. Then, since the previous combinations did not contain the target entity, the combination R is mixed with the target entity
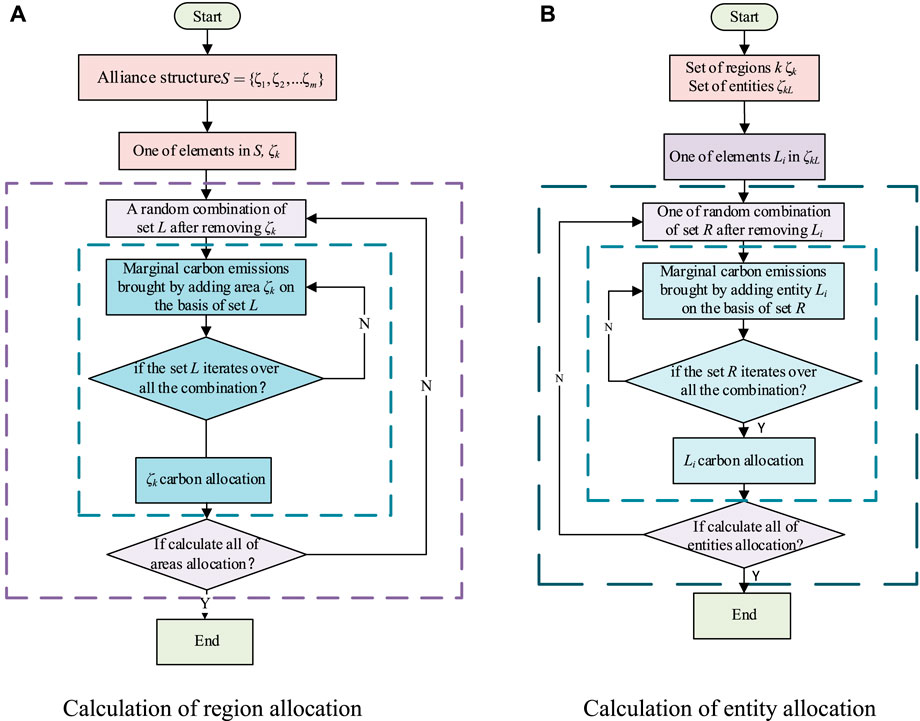
FIGURE 4. Flowchart of the Owen value method calculation process. (A) Calculation of region allocation. (B) Calculation of entity allocation.
In calculating the marginal effect, this method needs to consider all the combinations of the entities and the marginal effect of the target entity in each combination. However, in the calculation steps of the Owen method, it needs to consider combinations of regions and entities in the region. It means that minimum supply exceeds maximum demand or minimum demand exceeds maximum supply. Hence, the improved Shapley method will exclude the inappropriate combination to reduce computational complexity. The improved method adds a filter function of combinations compared with the original method.
3.3 Design of auction rules
This subsection introduces a method to add the carbon cost based on the allocation of the Owen value method on the quotation in the bilateral market. This mechanism changes the clearing sequence to make low-carbon generations or loads preferentially traded. Considering the characteristics of bilateral auction market clearing, it is necessary to design the quotations of load and power generation entities accordingly.
Then, considering the carbon emissions of load allocation and the additional carbon price, there is a negative correlation, so that the load with more carbon emissions will be ranked lower in the auction, which is consistent with the original goal. The expected additional carbon price for the carbon emissions shared by power generation is positively correlated, so that the units with fewer carbon emissions will accumulate less additional carbon price, and the rank will be relatively high.
The total amount is first calculated through the stepped carbon price in the extra carbon price setting. The carbon price is set to transmit the carbon price of the entity’s allocation to its quotation. In this way, the quotation in the final transaction includes economic and environmental factors. If the carbon price is too low, it is impossible to achieve low carbon by changing the quotation order. Therefore, the setting of carbon price should satisfy such that the low-allocation entity can gain an advantage in the quotation. In Section 3.3, the carbon price(40$/t) is a relatively acceptable empirical value obtained by many experiments, which is close to the international carbon price. The detailed method is as follows:
where c represents the whole cost for the carbon allocation,
where
3.4 Application of blockchain technology
In the market transaction of the proposed model, blockchain technology is used in the whole transaction process. Since the transaction process involves multiple regions, many transaction entities, steps, and blockchain technology makes the whole process traceable and simple while preventing tampering, which is suitable for the intermediate quotation change step.
Due to the previous calculation of the Owen value method, the blockchain application is divided into a two-level structure. The target of the sub-chain is to collect the quotation information and deliver the transaction results. Thus, it is aimed at the primary users, such as generation or load entities. The target of the main chain is to evaluate the allocation and supervise the performance of the users. Thus, it is aimed at the market organizers. Meanwhile, it can reduce the risk by setting up a separate sub-chain in each region when some sub-chain encounters a mistake.
Therefore, when building the blockchain and establishing a two-level structure, the main chain of the total area and the sub-chain of a single region are set, respectively, as shown in Figure 5. The members of the sub-chain consist of load entities, generation entities, and market organizers in the region, while the members of the main chain consist of market organizers of all regions. They all have a set of the ledger separately and, by using a consensus mechanism, all the members keep the ledgers identical when the transaction is finished. The Kafka algorithm used in the Fabric 1.4 version of the consensus mechanism is adopted. After the peer node requests endorsement, all transaction information is sorted through the Kafka cluster, and then the block is packaged through the order node. Finally, each peer node verifies the correctness of the block (Androulaki et al., 2018).
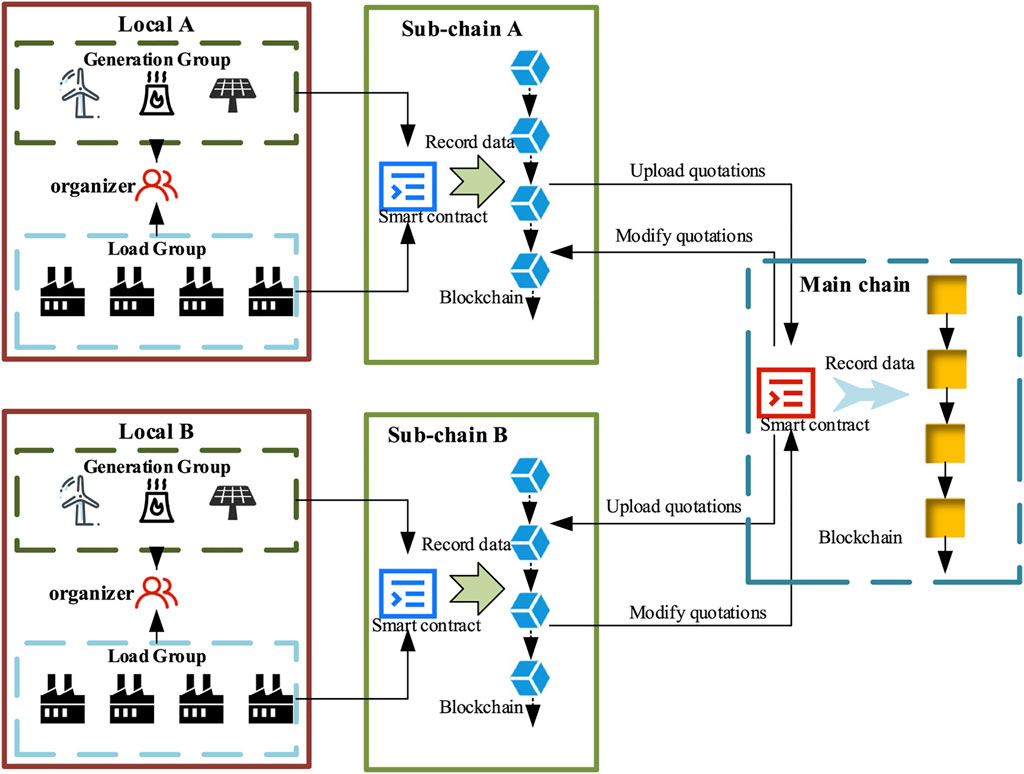
FIGURE 5. Schematic diagram of a two-level blockchain.
In the sub-chain of each region, each market entity represents a node in the blockchain system. At the same time, a super node is saved, which is the market organizer of every region for the information interaction with the main chain and the supervision and management of the sub-chain. The functions in the smart contract of the sub-chain are as follows:
1) Record the public key of the market organizer on the sub-chain.
2) Realize the quotations and relevant data of users reporting and record the information after encrypting the aforementioned data with the public key.
3) Record the modification quotation and the transaction results on the chain.
4) Realize query of final results for all users and decoding of quotations for market organizers through their private key.
The main chain comprises market organizers, mainly used to record the data interacted through the cross-chain and change the quotation through the smart contract in the main chain. Since market organizers join both blockchains, they can be seen as the bridge between the main chain and sub-chain. Relevant operations are implemented through smart contracts. The functions in the smart contract of the main chain are as follows:
1) Record the quotations of all regions on the main chain through market organizers.
2) Calculate the carbon allocation of all entities according to the reporting data through the Owen method and modify the quotation based on allocation.
3) Fulfill the final transaction by the modification quotations.
4) Realize the query of final results for market organizers.
The process is divided into three steps: the quotation report, the quotation modification, and the transaction settlement.
In the first step as shown in Figure 6, by querying transaction notifications in the main chain, the information is transmitted to each market entity in the sub-chain through cross-chain operations of market organizers. The organizers in each region use the RSA algorithm to generate a new public and private key and broadcast the public key to the region by sub-chain. Each market entity reports the quotation and the maximum and minimum values of its demand or output according to its situation and encrypts it with the public key of the super node.
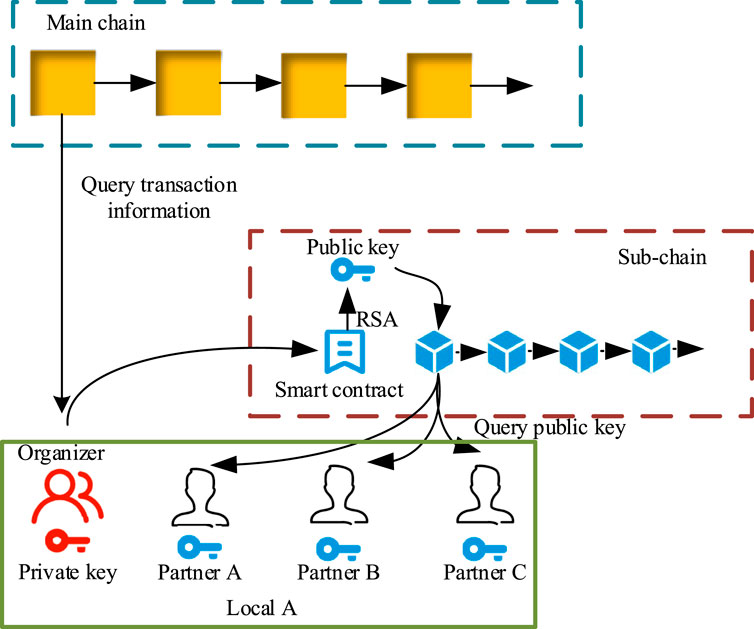
FIGURE 6. Schematic diagram of the first step.
In the second step as shown in Figure 7, the super node of each regional sub-chain decrypts the reporting data by the market entity through its private key and uploads it to the main chain. The smart contract in the main chain uses the data to modify the quotation and record those in the main chain. Then, the transaction is carried out according to the new quotation. Finally, super nodes will transmit the clearing result and the changed quotation to the sub-chain.
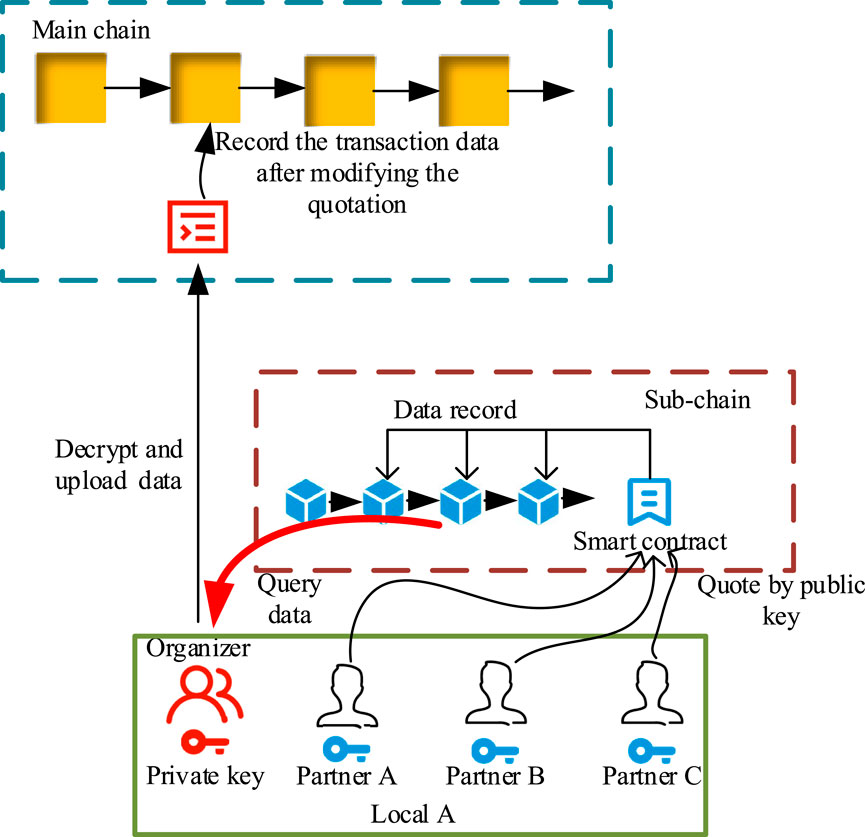
FIGURE 7. Schematic diagram of the quotation modification step.
In the last step, the clearing results are transferred from the main chain to each sub-chain. Each market entity on the sub-chain finishes the settlement of electricity or funds according to the final result. Relevant power generation entities are dispatched according to requirements. The settlement of the final electricity and the funds’ performance is written into each region’s blockchain.
4 Case study
The example analysis in this section is divided into two parts. The first part is in the PJM-5 system simulation, using five nodes to simulate five areas. Then, each power generation entity and load entity are set up in different groups. Carbon allocation is carried out through the Owen value method and transmitted to the quotations of each entity as a price signal. Considering the typical daily output characteristics of renewable energy units, the transactions of 24 times a day are simulated. After adopting this method, the impact on the overall carbon emissions and the changes in the dispatch of low-carbon or zero-carbon units are analyzed. The second part implements the aforementioned process in the blockchain by using the Hyperledger Fabric and verifies the practicability of blockchain technology by setting up a two-level structure of the main chain and sub-chain.
4.1 PJM-5 node example
The network structure of the PJM-5 system is shown in Figure 8, where each node is regarded as a region. G3 and G14 are photovoltaic power generation; G4, G9, and G15 are wind power generation; and G11 and G12 are natural gas generators. The remaining units are conventional thermal power units. The AB and ED lines’ capacity is 400 and 240 MW, respectively. There is no capacity limit on other lines.
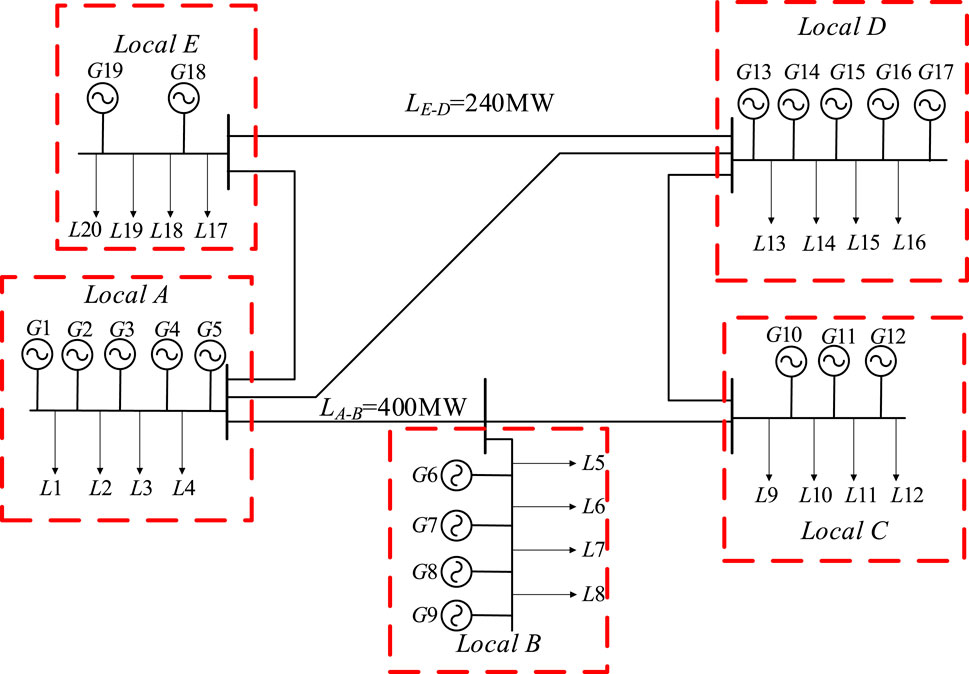
FIGURE 8. PJM-5 node system.
The capacity of two photovoltaic power generations is 200 MW; and the capacity of three wind power generations is 200 MW. Their typical day output curves are shown in Figure 9.
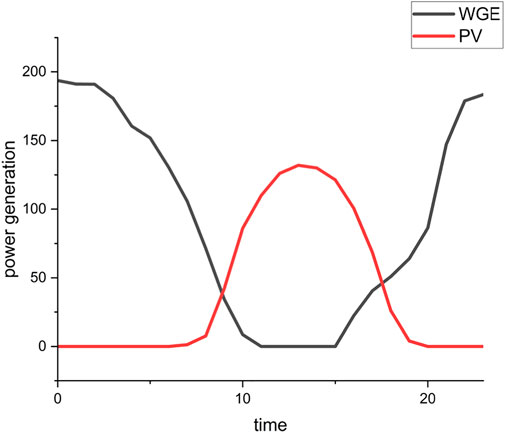
FIGURE 9. Output characteristic curve of the renewable energy unit.
Within 24 h, the load and power generations declare the quotations separately. If the transaction is formed according to the bilateral bidding mode, the consumption of each load and the output of each unit are shown in Figures 10A, C and through the Owen value method, carbon allocation is carried out on 24 trading points. The results are shown in Figures 10B, D. It can be seen that the carbon allocation result is positively correlated with the assumed original bilateral market clearing result. Loads with higher power consumption have higher carbon allocation results, and thermal power units with higher power generation also have higher carbon allocations. The results show that the hydropower units have a negative allocation lower than the photovoltaic or wind power. The reason is that the calculation of carbon allocation is based on the marginal carbon effect in the hypothetical bilateral bidding scenario. Due to the lower quotation of hydropower units, hydropower units are easier to be traded in the bilateral market. The participation of the hydropower unit will reduce the carbon emissions of the entire system, so its allocation is lower. However, due to their high quotations of renewable units, they are not easily traded in the bilateral market. Its participation will not change the output distribution of units, so its allocation is higher than that of hydropower units.
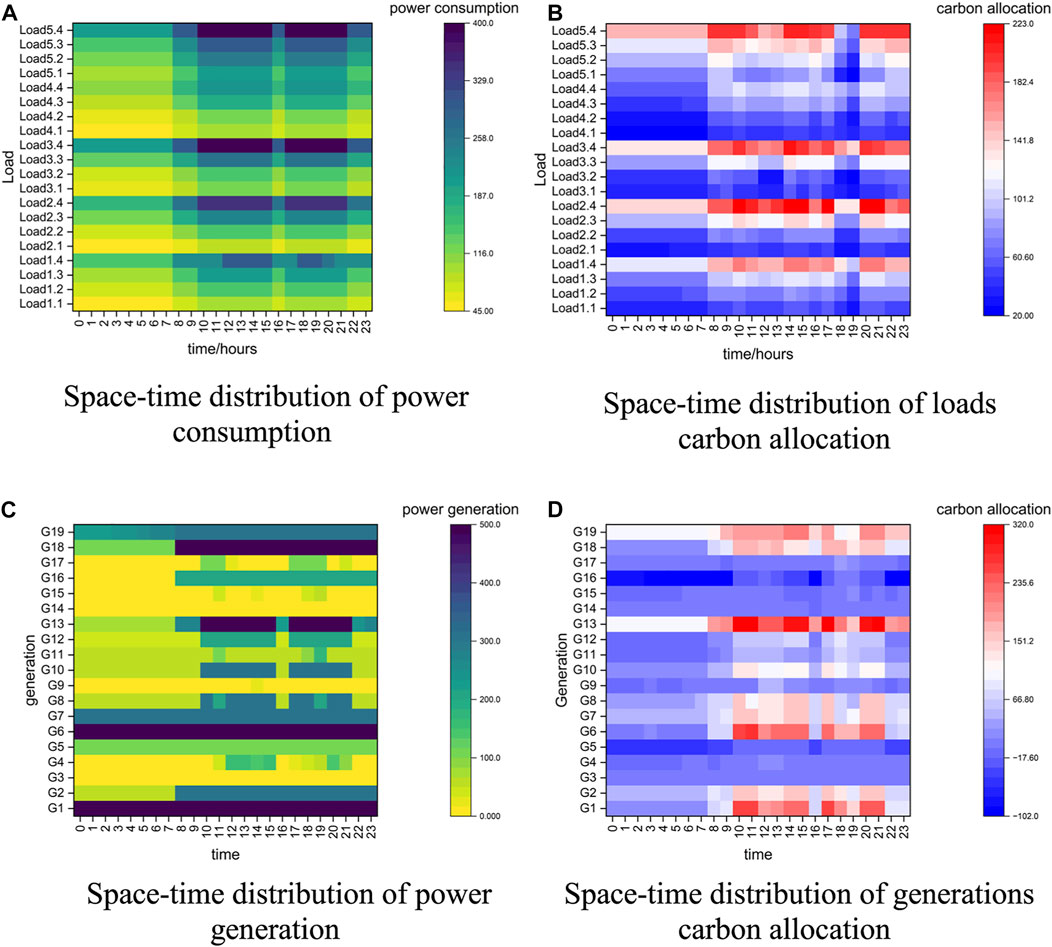
FIGURE 10. Consumption or generation of entity and carbon allocation result comparison. (A) Space-time distribution of power consumption. (B) Space-time distribution of load carbon allocation. (C) Space-time distribution of power generation. (D) Space-time distribution of generation carbon allocation.
Next, each entity will tier carbon prices based on the Owen value allocation in each trading period. A ladder carbon price of 40$/t, 20$/t, and 0$/t is set according to the maximum allocation, average allocation, and minimum allocation among entities of the same type, respectively. The subsequent clearing is carried out by adding the ladder carbon price to the original quotation. The change in carbon emissions of the entire system is shown in Figure 11. It can be seen that this method can promote the utilization rate of the low-carbon and zero-carbon units and reduce the carbon emissions of the system effectively. The results show that calculating the carbon allocation and considering it as a cost to loads and power generations. On the one hand, an additional carbon price is added to the quotation of power generations so that the environmental value of zero-carbon or low-carbon generators can be exerted and their priority dispatch can be realized. On the other hand, after allocating carbon to loads and attaching a carbon price, according to the results of their quotations, the expected usage of loads with excessively allocated carbon emissions will be reduced in the bilateral market, so as to guide load entities to energy conservation and emission reduction.
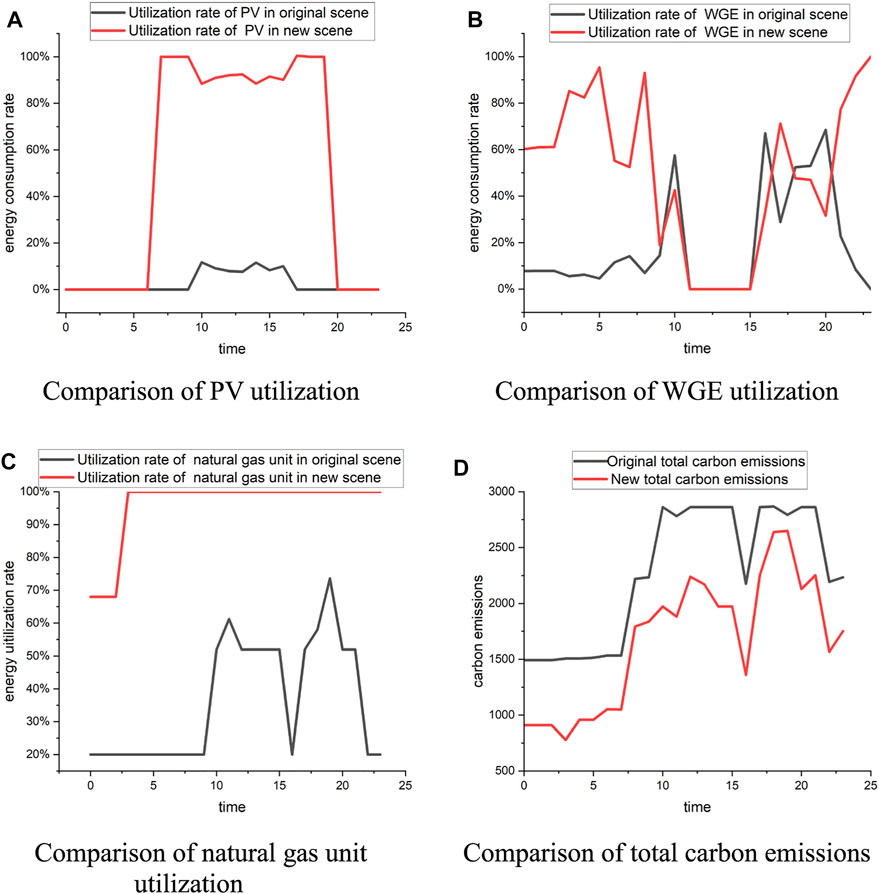
FIGURE 11. Parameters after considering carbon attributes and the initial market. (A) Comparison of PV utilization. (B) Comparison of WGE utilization. (C) Comparison of natural gas unit utilization. (D) Comparison of total carbon emissions.
4.2 Implementation based on blockchain technology
Hyperledger Fabric 1.4 version is used in the process of building a blockchain. The operating environment is Linux CentOS 7.5. According to the operation characteristics of the fabric, the smart contract and ledger in each channel will be shared. Therefore, different nodes will be grouped into other channels to realize the construction of different blockchains. As shown in Figure 12, P1 represents the nodes of the power generation entity, P2 represents the nodes of the load entity, and the number of entities determines the number of nodes. P0 represents the organizational nodes in each region. Channels 1–5 represent the sub-chains of five regions; Channel 0 represents the total chain for the entire region. At the same time, because the market organizer in each region is located in the sub-chain of its region and the general chain of the whole region, it has not only the account book of its region but also the account book of the general chain. So it acts as a bridge between the total chain and the sub-chain.
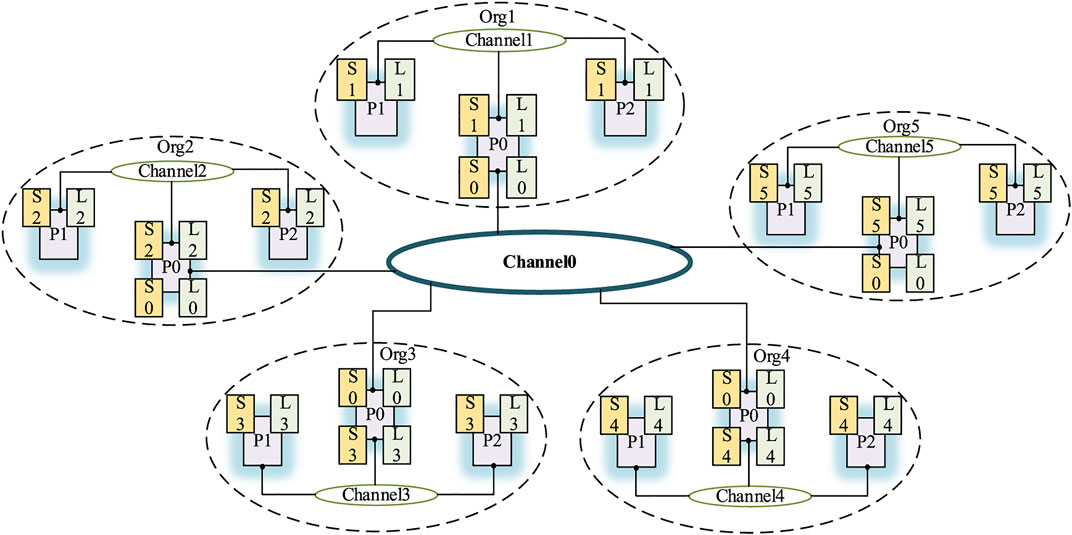
FIGURE 12. Schematic diagram of the blockchain network structure.
In the application of the sub-chain, it mainly involves the transaction information reporting step and the last transaction step. Therefore, region A was taken as an example to display the relevant results. In region A, there are five power generation nodes, four load nodes, and an organizer’s super node. The simulation method is a single machine with a multi-node network. Each node port is set as follows in Table 1.
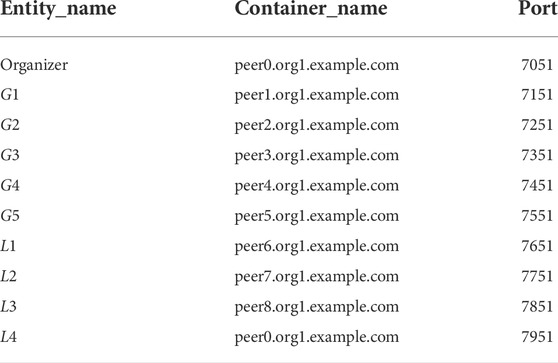
TABLE 1. Configuration of each node port.
Two blocks representing two steps in the sub-chain are selected, as shown in Figure 13. A block consists of a header, data, and metadata in blockchain technology. The relevant hash value and block number are displayed in the header. The data in the middle show the signature and value, etc., where the value is parsed by converting the relevant data into the JSON format. Metadata have little effect on the application, which is not shown in the figure.
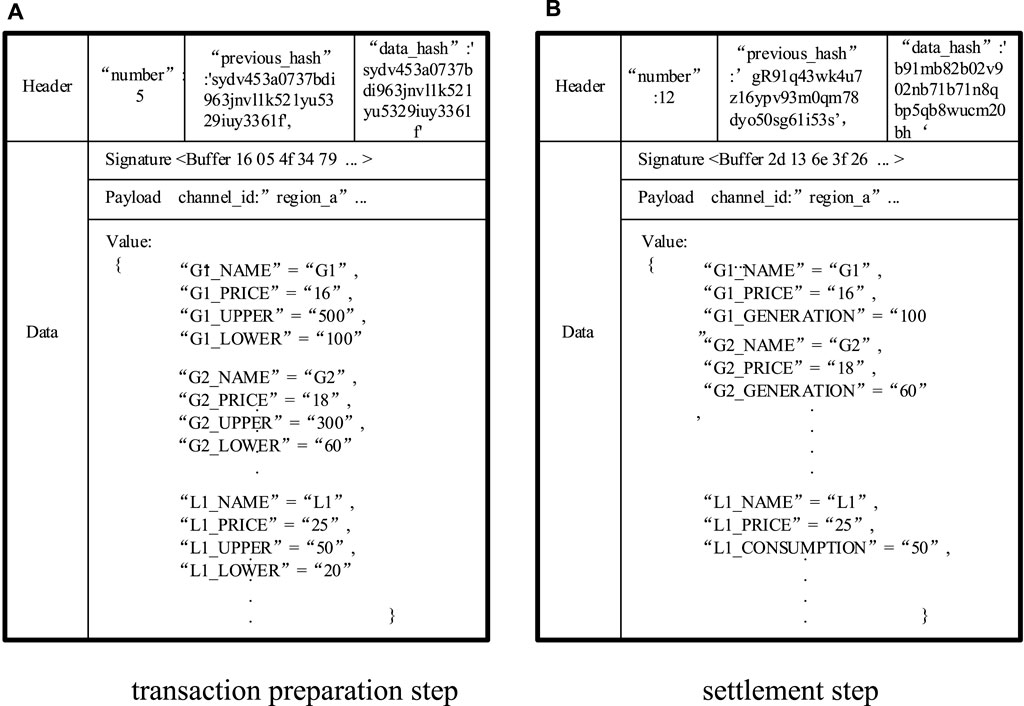
FIGURE 13. Schematic diagram of block information. (A) Transaction preparation step. (B) Settlement step.
According to the analysis of the results, it can be seen that the adoption of blockchain technology can automate the entire process. The process involves multiple steps, but it can be finished quickly. In addition, the data of the whole process are recorded on the blockchain. This makes the entire quote change process traceable and credible. Finally, due to the consensus mechanism, all data are tamper-proof, thus ensuring the secure and smooth operation of the market.
5 Conclusion
This article proposes a method to allocate the carbon emissions of the power system to the power generation entities and load entities according to the Owen value method region-entity principle and establish a model that can realize the transaction of the allocation result as a price signal in the bilateral trading market in this period. Based on the example analysis, the following conclusions are drawn:
1) The allocation results of the Owen value method show that its allocation to the power generation and load sides is more reasonable. For different generation units The allocation results correspond to the different generation units' carbon emissions from electricity generation. For other loads, the allocations are consistent with their consumption behavior. At the same time, the difference in carbon emissions caused by geographical factors caused by line capacity is also considered.
2) In the bilateral bidding scene, the allocation calculated by the Owen value method is used as a price signal to update entity quotations, which can realize the combination of policy and market mechanisms to realize the dispatch of low-carbon and zero-carbon generators so as to realize the low-carbon economic operation of the whole system.
3) The two-level blockchain structure can fit with the entire process. On the one hand, it realizes the contract by a code during the entire process, thereby simplifying the process. On the other hand, during changes in the quotation, it realizes the record of the overall data on the chain to ensure the credibility and traceability of the entire process.
Data availability statement
The raw data supporting the conclusion of this article will be made available by the authors, without undue reservation.
Author contributions
RL and ZL contributed to the conception and design of the study. RL organized the simulation, analyzed the results, and wrote parts of the manuscript. HW gave suggestions to technical support. HD and HJ contributed to writing parts of the manuscript. CX contributed to the improvement of the study design.
Funding
This work was supported by the Zhejiang Provincial Public Welfare Technology Application Research Project (LGJ21E070001).
Conflict of interest
Authors HD and CX was employed by the company Electric Power Research Institute of State Grid Zhejiang Electric Power Co., Ltd., Hangzhou, China. HJ was employed by the company Power Dispatching and Control Center, State Grid Heilongjiang Co., Ltd., Harbin, China.
The remaining authors declare that the research was conducted in the absence of any commercial or financial relationships that could be construed as a potential conflict of interest.
Publisher’s note
All claims expressed in this article are solely those of the authors and do not necessarily represent those of their affiliated organizations, or those of the publisher, the editors, and the reviewers. Any product that may be evaluated in this article, or claim that may be made by its manufacturer, is not guaranteed or endorsed by the publisher.
References
Androulaki, E., Barger, A., Bortnikov, V., Cachin, C., Christidis, K., De Caro, A., et al. (2018). “Hyperledger fabric: A distributed operating system for permissioned blockchains,” in Proceedings Of The Thirteenth Eurosys Conference, Portugal, April 23–26, 2018, 1–15.
Chen, L., Sun, T., Zhou, Q., and Feng, D. (2017). “A Shapley value based method for allocating carbon obligation between generation side and demand side in power system,” in Iecon 2017-43rd Annual Conference Of The Ieee Industrial Electronics Society, China, 29 Oct-01 Nov, 56–60.
Cheng, Y., Zhang, N., Wang, Y., Yang, J., Kang, C., and Xia, Q. (2018). Modeling carbon emission flow in multiple energy systems. IEEE Trans. Smart Grid 10, 3562–3574. doi:10.1109/tsg.2018.2830775
Cheng, Z., Li, L., and Liu, J. (2018). Industrial structure, technical progress and carbon intensity in China's provinces. Renew. And Sustain. Energy Rev. 81, 2935–2946. doi:10.1016/j.rser.2017.06.103
De Chalendar, J. A., Taggart, J., and Benson, S. M. (2019). Tracking emissions in the us electricity system. Proc. Natl. Acad. Sci. U. S. A. 116, 25497–25502. doi:10.1073/pnas.1912950116
Fiestras-Janeiro, M. G., Gallardo, J. M., Jiménez-Losada, A., and Mosquera, M. A. (2015). Cooperative games and coalition cohesion indices: The choquet–owen value. IEEE Trans. Fuzzy Syst. 24, 444–455. doi:10.1109/tfuzz.2015.2459761
Gao, T., Jin, P., Song, D., and Chen, B. (2022). Tracking the carbon footprint of China's coal-fired power system. Resour. Conservation And Recycl. 177, 105964. doi:10.1016/j.resconrec.2021.105964
Goldstein, B., Gounaridis, D., and Newell, J. P. (2020). The carbon footprint of household energy use in the United States. Proc. Natl. Acad. Sci. U. S. A. 117, 19122–19130. doi:10.1073/pnas.1922205117
Hamouda, M. R., Nassar, M. E., and Salama, M. (2020). A novel energy trading framework using adapted blockchain technology. IEEE Trans. Smart Grid 12, 2165–2175. doi:10.1109/tsg.2020.3045662
Huang, W., Zhang, N., Cheng, Y., Yang, J., Wang, Y., and Kang, C. (2020). Multienergy networks analytics: Standardized modeling, optimization, and low carbon analysis. Proc. IEEE 108, 1411–1436. doi:10.1109/jproc.2020.2993787
Kang, C., Zhou, T., Chen, Q., Wang, J., Sun, Y., Xia, Q., et al. (2015). Carbon emission flow from generation to demand: A network-based model. IEEE Trans. Smart Grid 6, 2386–2394. doi:10.1109/tsg.2015.2388695
Lei, R., Zhou, M., Wu, Z., Sha, Y., Zhang, Y., and Liu, X. (2020). “The optimal operation and revenue allocation method of virtual power plant considering carbon trading,” in 2020 Ieee 4th Conference On Energy Internet And Energy System Integration (Ei2)China, Oct 30-Nov 1, 2396–2402.
Li, J.-F., Lu, X., Zhang, D., and Sheng, J. (2021). “A review on the blockchain technique applied in cloud energy storage power system,” in 2021 Ieee 6th International Conference On Cloud Computing And Big Data Analytics (Icccbda), China, Apr 24 26, 415–422.
Luo, F., Dong, Z. Y., Liang, G., Murata, J., and Xu, Z. (2018). A distributed electricity trading system in active distribution networks based on multi-agent coalition and blockchain. IEEE Trans. Power Syst. 34, 4097–4108. doi:10.1109/tpwrs.2018.2876612
Morstyn, T., Teytelboym, A., and Mcculloch, M. D. (2018). Designing decentralized markets for distribution system flexibility. IEEE Trans. Power Syst. 34, 2128–2139. doi:10.1109/tpwrs.2018.2886244
Tian, D., Li, Y., Cai, Y., Cao, Y., Xin, J., and Fan, R. (2015). “A hierarchical and partition low-carbon evaluation model for active power distribution grid,” in 2015 Ieee 15th International Conference On Environment And Electrical Engineering (Eeeic), Rome, June 10-13, 1448–1452.
Tonev, I., and Nikolaev, N. (2020). “Review on blockchain applications for electric power systems,” in 2020 21st International Symposium On Electrical Apparatus & Technologies (Siela), Balgaria, June 3-6, 1–4.
Wang, M., and Feng, C. (2017). Decomposition of energy-related Co2 emissions in China: An empirical analysis based on provincial panel data of three sectors. Appl. Energy 190, 772–787. doi:10.1016/j.apenergy.2017.01.007
Xu, Y., Hu, J., and Zhou, H. (2021). “Blockchain-based trading and settlement framework for electricity markets,” in 2021 International Conference On Communications, Information System And Computer Engineering (Cisce), China, May 27-29, 243–246.
Yue, B., Guo, C., Guo, Y., Feng, B., Ding, X., and Wang, S. (2021). “Review on the development of carbon transaction in China and analysis on the participation strategy of electric power industry,” in 2021 Ieee Sustainable Power And Energy Conference (Ispec), China, Dec 23-25, 717–724.
Zhang, D., Wang, J., Lin, Y., Si, Y., Huang, C., Yang, J., et al. (2017). Present situation and future prospect of renewable energy in China. Renew. and Sustain. Energy Rev. 76, 865–871. doi:10.1016/j.rser.2017.03.023
Zhang, S., Pu, M., Wang, B., and Dong, B. (2019). A privacy protection scheme of microgrid direct electricity transaction based on consortium blockchain and continuous double auction. Ieee Access 7, 151746–151753. doi:10.1109/access.2019.2946794
Zhang, X., Zhao, X., Jiang, Z., and Shao, S. (2017). How to achieve the 2030 Co2 emission-reduction targets for China's industrial sector: Retrospective decomposition and prospective trajectories. Glob. Environ. Change 44, 83–97. doi:10.1016/j.gloenvcha.2017.03.003
Zhang, Y.-J., Peng, Y.-L., Ma, C.-Q., and Shen, B. (2017). Can environmental innovation facilitate carbon emissions reduction? Evidence from China. Energy Policy 100, 18–28. doi:10.1016/j.enpol.2016.10.005
Zhongming, Z., Linong, L., Xiaona, Y., Wangqiang, Z., and Wei, L. (2021). New climate predictions increase likelihood of temporarily reaching 1.5°C in next 5 years. Available at: http://119.78.100.173/C666/handle/2XK7JSWQ/328222.
Keywords: carbon allocation, cooperative game, low carbon electricity, Owen value, blockchain
Citation: Luo R, Wang H, Deng H, Jiang H, Xu C and Li Z (2022) Blockchain-based bilateral bidding market mechanism with carbon allocation on both supply and demand sides. Front. Energy Res. 10:1000582. doi: 10.3389/fenrg.2022.1000582
Received: 22 July 2022; Accepted: 10 August 2022;
Published: 02 September 2022.
Edited by:
Nantian Huang, Northeast Electric Power University, ChinaReviewed by:
Yang Li, Northeast Electric Power University, ChinaMingfei Ban, Northeast Forestry University, China
Copyright © 2022 Luo, Wang, Deng, Jiang, Xu and Li. This is an open-access article distributed under the terms of the Creative Commons Attribution License (CC BY). The use, distribution or reproduction in other forums is permitted, provided the original author(s) and the copyright owner(s) are credited and that the original publication in this journal is cited, in accordance with accepted academic practice. No use, distribution or reproduction is permitted which does not comply with these terms.
*Correspondence: Zhiyi Li, emhpeWlAemp1LmVkdS5jbg==