 Liu Yang1
 Zhili Ma
95% of researchers rate our articles as excellent or good
Learn more about the work of our research integrity team to safeguard the quality of each article we publish.
Find out more
ORIGINAL RESEARCH article
Front. Energy Res. , 03 February 2022
Sec. Sustainable Energy Systems
Volume 9 - 2021 | https://doi.org/10.3389/fenrg.2021.838852
Energy-based economic development brings about some environmental problems, and as China’s economy shifts from rapid growth to high-quality development, the implementation of environmental regulation is crucial to achieving environmental protection and high-quality economic development. Based on the panel data of 14 prefectures and cities from 2000 to 2018 in Xinjiang, this study explored the impact of environmental regulation on high-quality economic development by constructing a comprehensive evaluation index system and using entropy method and Tobit regression model. The results show that 1) overall, each 1% increase in environmental regulation is associated with a 0.037% rise in high-quality economic development level; 2) regionally, each 1% increase in environmental regulation is associated with a 0.119% rise in high-quality economic development level in northern Xinjiang, but the effect on the southern Xinjiang is not significant; 3) each 1% increase in environmental regulation, the level of high-quality economic development decreased by 0.034% from 2000 to 2010 and increased by 0.061% from 2011 to 2018. In general, this study adds to the theoretical and empirical study on the influence of environmental regulation on high-quality economic development while providing a methodology for other economies to assess the relationship between the two.
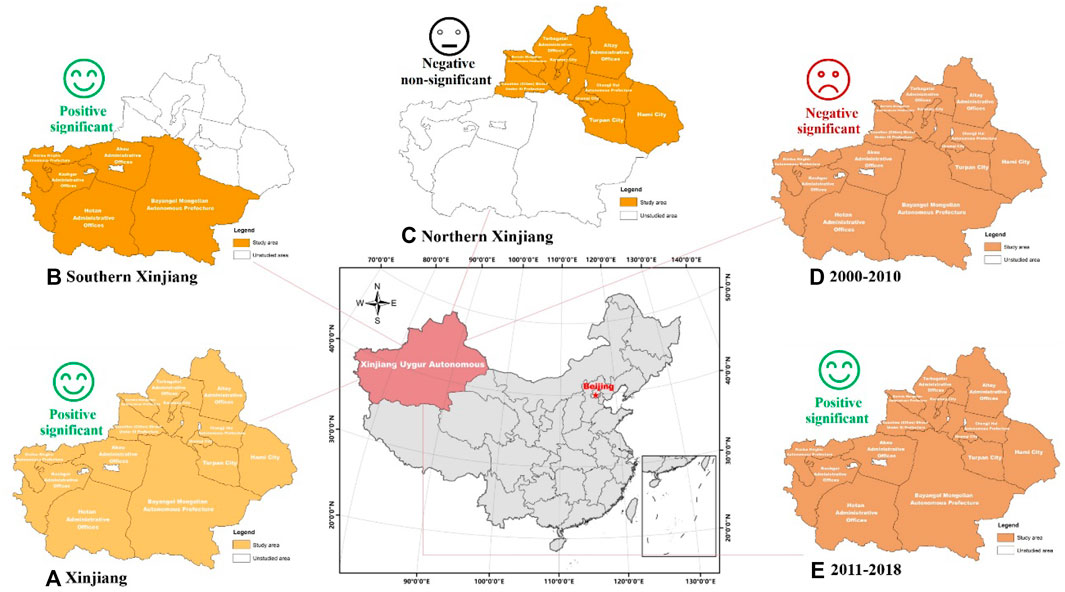
GRAPHICAL ABSTRACT. (A) the overall impact of environmental regulation, (B,C) the impact of regional heterogeneity, and (D,E) the impact of temporal heterogeneity on high-quality economic development in Xinjiang.
• Construct a system of indicators to break the limitations of a single index.
• Propose research hypotheses and use the Tobit regression model for empirical testing.
• A 1% increase in environmental regulation will cause a 0.037% increase in economic development.
• Environmental regulation is a way to improve high-quality economic development.
The consumption of a large amount of fossil energy in economic development leads to an increase in global greenhouse gas emissions (Ma et al., 2018a; Chen et al., 2022). Data from the China Statistical Yearbook show that from 2000 to 2018, the Chinese economy grew rapidly, total energy consumption increased significantly (Jing et al., 2018b; Zhao et al., 2021), and total energy consumption grew from 1469.64 to 4719.25 million tons of standard coal, with an average annual growth rate of 6.7%. The increase in energy consumption has led to problems such as energy shortages and environmental pollution, which have gradually become a constraint on China’s high-quality economic development (Zhao et al., 2020; Geng et al., 2021). At present, China is increasingly focusing on the harmonization of the environment and economy under the goal of carbon peak and carbon neutrality (Ma and Cai, 2019; Zhang S et al., 2021). There is evidence that low-carbon energy transition has promoted green and sustainable development in China (Ma et al., 2018b; Dong et al., 2021). Therefore, the mode of China’s economic development has gradually changed from extensive to intensive, and the economy has also transitioned from a phase of high-speed growth to a phase of high-quality development (Zhou B et al., 2020).
Xinjiang is the window of China’s opening to the west, as well as an important resource province and strategic energy base in China (Cui et al., 2019). Xinjiang’s economic growth is mainly supported by heavy industries, such as the coal, iron and steel, and chemical industries, leading to an increase in industrial waste water, gas and residue emissions. As a result, the economic development in Xinjiang is characterized by the high expenditure of energy and high-carbon emissions (Xu et al., 2017; Zhang X et al., 2019). Data from the Xinjiang Statistical Yearbook show that from 2000 to 2018, total energy consumption in Xinjiang grew from 33.16 million tons of standard coal to 176.94 million tons of standard coal, with an average annual growth rate of 9.7%. Although the crude development pattern brings economic prosperity, it also makes the Xinjiang economy face the dual constraints of environmental pollution and energy shortages.
With the slowdown of China’s economic growth and environmental problems worsening (Cai et al., 2020; Chen et al., 2020), reconciling high-quality economic development (HQED) and environmental protection has become one of the main economic propositions. Environmental regulation (ER), as one of the government’s instruments for environmental management, has achieved certain achievements in guiding enterprises to reduce pollution. Under the background that China’s economic development has entered the new normal, HOED and ER have gradually become a hot topic of research. However, few studies have directly explored how ER affects HQED. Therefore, this study focuses on the following three issues with ER and HQED in Xinjiang:
• What are the directions and magnitude of the impact of ER on HQED and its subsystems?
• Is there regional and temporal heterogeneity in the effect of ER on HQED in Xinjiang?
• Is it possible to make targeted recommendations from the viewpoint of improving ER to be able to contribute to enhancing the HQED level in Xinjiang?
To answer the abovementioned questions, this study constructs a comprehensive assessment indicator system of ER intensity and the HQED level in Xinjiang and measures the comprehensive evaluation index of both using the entropy value method. Then, the Tobit regression model is used to explore the impact of ER on HQED. Finally, by analyzing the empirical results, some policy recommendations are proposed that are beneficial to realizing a win-win complexion for both environmental protection and HQED in Xinjiang.
The main contributions of the research are discussed as follows. First, this paper proposes corresponding research hypotheses based on theoretical analysis. Second, this paper constructs a comprehensive assessment indicator system, breaks through the limitation of single index measurement, and improves the comprehensiveness and accuracy of measurement. Third, this paper utilizes the panel data from 2000–2018 for 14 prefectures and cities in Xinjiang to examine the specific influence of ER on the high-quality development of Xinjiang’s economy and expands the research from multiple levels and perspectives.
The rest of the study is divided into the following sections: Section 2 presents the literature review. Section 3 offers the research methodology, covering the influence mechanism analysis and research hypothesis, construction of econometric model, definition of variables and data collection. The results are given in Section 4. In Section 5, three issues are discussed: Section 5.1 analyzes the effect of ER on the subsystem of the HQED; Section 5.2 tests the robustness of the regression model; and Section 5.3 discusses the countermeasures and suggestions. The core findings and recommendations for further research are shown in Section 6.
More research has been done on ER and economic development, to date, the relationship between ER, and economic development continues to attract widespread academic attention. China is currently facing tremendous environmental pressures (Zhou D et al., 2020; Shum et al., 2021), through the study of relevant literature, it is found that there are three main theories about the effect of ER on economic growth.
First, follow the cost theory. According to this theory, the enforcement of environmental regulations augments the operating cost and environmental cost for enterprises, squeezes the investment of enterprises in technological innovation, leads to the loss of competitive advantages of enterprises, reduces the operating income of enterprises, and is not beneficial to economic development (Korhonen et al., 2015). Shen et al. (2019) studied the nonlinear dynamic effects of various categories of ER on environmental total factor productivity (ETFP) in the industrial sector using a threshold model and found that a high strength of environmental regulations undermines technological innovation in these firms. Xie et al. (2021) explored the impact of ER fluctuations on a country’s economic growth, and the research results showed that both formal ER fluctuations and informal ER fluctuations had significant negative impacts on economic growth.
Second, innovation compensation theory. The representative figure of this theory is Porter (1991), who argues that ER can spur firms to carry out technological innovation, partly or even fully counteract the cost of ER, improve enterprise competitiveness and promote economic growth. For example, by constructing an endogenous economic growth model, Tang et al. (2019) discovered that strict ER could significantly facilitate technological innovation in the production sector and enhance the mean labor productivity in the production sector. Yu and Wang (2021) found that ER has a marked positive influence on industrial structural upgrades and believes that it is indispensable to diversify ER policy tools to further promote industrial structure upgrading and enhance the HQED level. Du et al. (2021) shows that ER will facilitate industrial structure upgrades and green technology innovation. Dong et al. (2022) found that charging pollution fees can effectively promote the technological innovation of enterprises, thus further reducing pollutant emissions.
Third, the theory of uncertainty. The theory holds that there could be a nonlinear relationship between ER and economic growth due to different environmental regulation tools and regional development. Cao et al. (2020b) used the Yangtze River Delta region as the study area and investigated the inverted U-shaped relationship between ER and economic growth. Ouyang et al. (2020) discovered a U-shaped relationship between ER and technological innovations. In the short term, ER has decreased the research and development (R&D) expenditures of firms and has a “counteract effect” on the research and innovation ability of industrial sectors. In the long term, the intensification of environmental regulations will lead to a “compensation effect” on the industry and promote HQED and the growth of the green economy (Liu et al., 2021). Cao et al. (2020a) found an inverted U-shaped relationship between green economic growth and ER, and it has a notable effect on energy-intensive, high-polluting, and medium-polluting industries.
Through the review of relevant literature, it is found that academic circles have conducted more studies on the impact of ER on economic development, but the following deficiencies remain. First, most of the existing studies have discussed the relationship between environmental regulation and one aspect of economic development at the national level, such as economic growth (Ouyang et al., 2020), technological innovation (Song et al., 2021), and environmental pollution (Wang A et al., 2021). Second, most of the existing researches use a single index to measure economic development, which has some limitations. Third, the HQED is richer in content and broader in scope than economic growth, but unit now, few theoretical analyses and empirical studies have explored the relationship between ER and HQED, and in addition, there is a lack of studies at the prefecture level. Thus, to cover these gaps, this study discusses the impact of ER on HQED in Xinjiang. The main contributions of this study are as follows:
• The influence of ER on HQED in Xinjiang is studied for the first time.
Xinjiang occupies an important position in China’s energy security and ecological security. At this stage, Xinjiang’s economy faces the twin constraints of environmental pollution and energy shortages, but there is still a gap in the relevant study on the correlation between ER and the high-quality development of Xinjiang’s economy, and this study fills this gap.
• Analyze the impact of ER on HQED from multiple perspectives.
Based on the review of relevant literature, it is found that the impact of ER on economic development includes positive, negative and non-linear effects. Therefore, drawing on previous research results, this paper not only studies the overall impact of ER on HQED, but also discusses whether there is regional and temporal heterogeneity in its impact.
• A set of methods for studying the influence of ER on HQED is proposed.
This study constructs a comprehensive assessment indicator system of ER intensity and the HQED level in Xinjiang, breaking the limitations of single index measurement, and the comprehensive index of ER intensity and high-quality economic development was calculated using the entropy method. Then, the Tobit regression model is applied to examine the impact of ER on the HQED level in Xinjiang.
Section 3 introduces the research methods. This section analyzes the mechanism of ER affecting high-quality economic development, proposes research hypotheses Section 3.1, establishes an impact model, and introduces the variables and datasets of this study Section 3.2.
The connotation of HQED is more abundant than economic growth, its requirements are higher and its scope is wider. Environmental regulation often does not affect high-quality economic development through one path. Thus, this research will analyze the mechanism of the influence of ER on HQED in Xinjiang and propose research hypotheses.
On the one hand, the enforcement of ER will raise the enterprise’s production costs and make the supply curve shift to the left. In the case of constant demand, the total profit of enterprises will be reduced, restricting enterprises to expand reproduction, and achieve scope economies. An increase in production costs will limit investment in innovation and R&D, which will greatly reduce the R&D investment intensity and innovation output level of enterprises. Meanwhile, it will form capital barriers, hinder the flow of production factors to higher industries, and be detrimental to industry coordination. To maintain production and operation, some businesses may reduce employee pay or even lay off staff, which reduces people’s happiness (Jing et al., 2018a). Furthermore, the implementation of environmental regulations will raise the threshold of foreign investment, resulting in trade barriers between regions and hindering some companies from entering the local market, thus affecting the improvement of the open development level. Simultaneously, enterprises may allocate the increased costs due to environmental regulations to product prices, hindering their export trade and reducing the degree of openness, which is not conducive to promoting the HQED level in Xinjiang.
Based on this, the corresponding hypothesis is proposed:
H1 : ER is not conducive to promoting the HQED level in Xinjiang.
On the other hand, based on “innovation compensation theory”, the augmentation of production costs and the decline in competitiveness brought by enterprises following environmental regulation policies will be fully compensated by the dividend brought by technological innovation. An important premise of this hypothesis, of course, is that firms can survive the losses that come with technological innovation. Faced with the increase in production costs, enterprises urgently need to improve production technology and resource utilization, and reduce production costs to maximize profits. Therefore, strong and suitable environmental regulations can encourage enterprises to innovate technologically. Enterprises’ technological innovation has improved production efficiency and promoted economic growth, which in turn has prompted the government to increase investment in public services, improve infrastructure construction, education, medical care, social insurance and other public service systems, and greatly improve residents’ happiness (Lu et al., 2021a; Xiang et al., 2022b). Simultaneously, enterprises carry out low-carbon environmental protection technology innovation, promote technological progress in industrial production and upgrade environmental protection technology, increase the replacement rate of nonenergy production factors with energy production factors, improve urban sustainability (Jing et al., 2019), reduce pollution emissions, and reduce the damage of enterprise production activities to the ecological environment (Ma et al., 2019a; Xiang et al., 2020). Furthermore, enterprises reduce environmental costs by changing the direction of investment and prompting a shift of production factors from pollution-intensive industries to cleaner production industries. The research and development of clean energy and technology raise the percentage of high-tech industries and promote upgrading and transforming of the industrial structure.
Based on this, the corresponding hypothesis is proposed:
H2: ER is conducive to promoting the HQED level in Xinjiang.
The composite index of the HQED level in Xinjiang calculated via the entropy method is the core dependent variable in this study. China’s economic development is facing rapidly growing energy demands, further increasing CO2 emissions, and which is not conducive to environmental improvement (Ma et al., 2020; Li et al., 2022). At present, under the background of the new development concept, economic growth in China is more focused on quality development (Xiang et al., 2022a; Lin and Zhou, 2022). HQED is an inevitable requirement for adapting to the changes in the main contradictions of Chinese society and achieving stable development (Lu et al., 2021b; Jiang et al., 2021). Therefore, this paper is rooted in the connotation of the HQED and follows the principles of comprehensiveness, scientificity and topicality in the construction of the indicator system, the reference of the existing research results at the same time (Chen and Wang, 2021; Li et al., 2021). Based on China’s new development concepts, this paper constructs a comprehensive assessment indicator system for HQED in Xinjiang from five dimensions: innovation, green, coordination, sharing and openness, and including 16 specific indicators supported by five subsystems, as shown in Table 1.
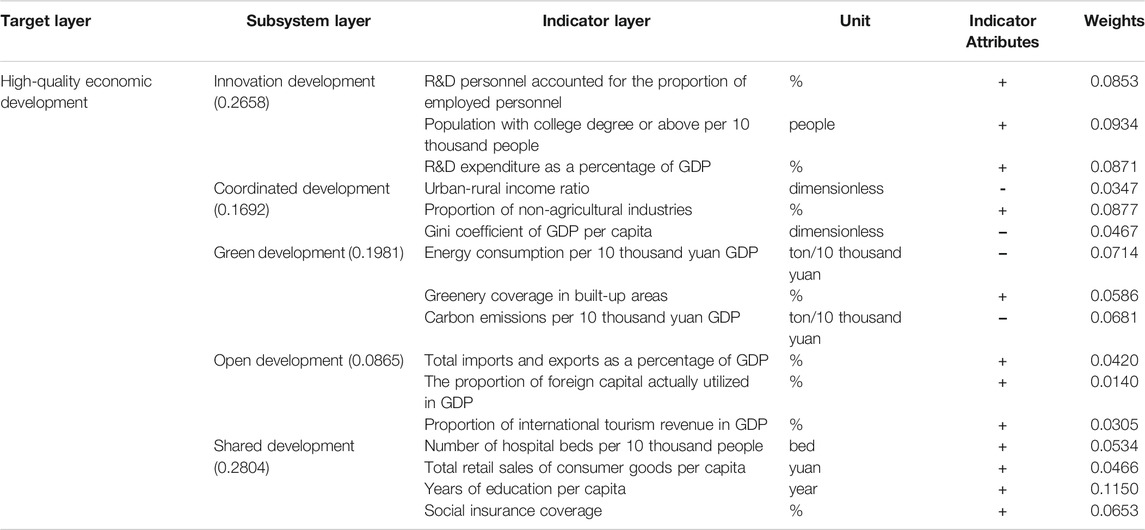
TABLE 1. High-quality economic development index system in Xinjiang.
The dependent variable is the composite index of environmental regulation intensity calculated via the entropy method. At present, the methods for measuring the intensity of environmental regulations are not uniform. Some scholars measure it using a single indicator (Zhang M et al., 2019; Wang A et al., 2021), some scholars divide environmental regulations into different types of tools to measure separately (Yang and Song, 2019; Zhang J et al., 2021), and some scholars have measured it from the aspects of industrial solid waste composite utilization rate, industrial soot removal rate, and industrial wastewater discharge compliance rate (Liu et al., 2018). Considering that Xinjiang’s industries are dominated by heavy chemical industries, and industrial development will bring a large amount of pollutant emissions. Therefore, constructing a comprehensive evaluation system of Xinjiang’s environmental regulatory intensity from the three aspects of industrial wastewater, waste gas and waste residues can more comprehensively reflect the discharge of various pollutants. At the same time, comparing the emissions of “three wastes” with GDP can ensure the comparability of environmental regulation intensity, as shown in Table 2.
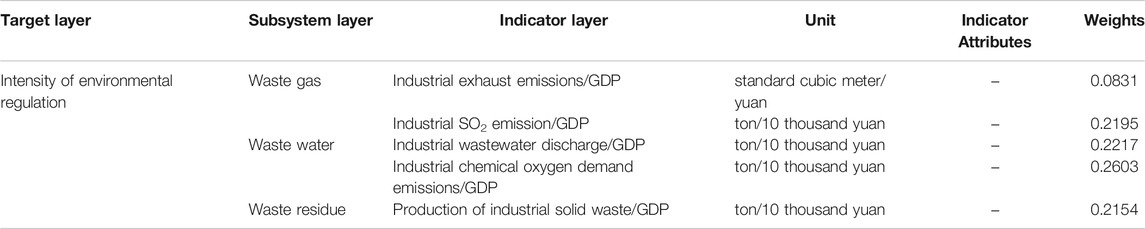
TABLE 2. Index system of environmental regulation intensity in Xinjiang.
Various factors affecting HQED in Xinjiang were taken into account to prevent the omission of relevant variables leading to biased evaluation results. This study draws on relevant research results to control for as many factors as possible that affect high-quality economic development. 1) Government regulation (GR): calculated as local government financial expenditure as a percentage of local GDP in prefectures and cities of Xinjiang; 2) capital density (CD): measured by per capita investment in fixed assets; 3) human capital (HC): human capital is the resource for socioeconomic growth, measured in terms of employment per 10,000 people; 4) industrial production level (IPL): measured by industrial added value as a proportion of GDP; 5) science and technology innovation (STI): innovation is a key factor in driving HQED, measured by the innovation index.
Due to the different data units and positive and negative attributes of each indicator, this paper adopts the max-min standardization method to quantify the initial data. Assuming a sample size of n and m indicators
Where
According to the weights of the obtained indicators, the comprehensive evaluation index of ER intensity and HEQD of 14 prefectures and cities in Xinjiang is calculated. The formula is as follows:
Where
To explore the relationship between ER and HQED in Xinjiang, a Tobit regression model (Du et al., 2020; Lin and Chen, 2020; Xiude et al., 2021) was constructed on the basis of theoretical analysis. The specific expression is as follows:
Where i denotes region, t denotes year. HQED refers to the comprehensive index of high-quality economic development in Xinjiang. β1 is constant term and β1n is regression coefficient corresponding to each variable in Model (7) (n = 1, 2, 6), ER denotes the intensity of environmental regulation in Xinjiang, GR, CD, HC, IPL, and STI denote “government regulation”, “capital density”, “human capital”, “industrial production level”, and “science and technology innovation”, respectively, εit is random error perturbation term.
To deeply investigate the path of ER on HQED in Xinjiang, the relationship between ER and subsystems will be further discussed. The regression model is constructed as follows:
Where Innovation, Coordination, Greenness, Openness, and Share denote the innovation development index, coordinated development index, green development index, open development index and shared development index, respectively. β2—β7 represents the constant term from Model (8) to Model (12), β2n—β7n represent the regression coefficient corresponding to each variable in Model (8) to Model (12).
The research region of this study is 14 prefectures and cities in Xinjiang, including Urumqi City, Changji Hui Autonomous Prefecture, Karamay City, Counties (Cities) Direct Under Ili Prefecture, Hami City, Bortala Mongolian Autonomous Prefecture, Turpan City, Tarbagatai Administrative Offices and Altay Administrative Offices in northern Xinjiang; Aksu Administrative Offices, Bayangol Mongolian Autonomous Prefecture, Kashgar Administrative Offices, Kizilsu Kirghiz Autonomous Prefecture, and Hotan Administrative Offices in southern Xinjiang (Figure 1).
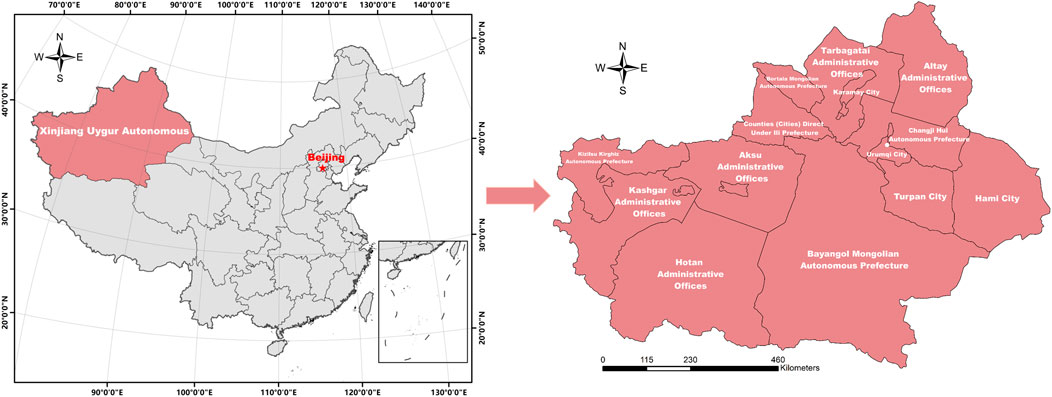
FIGURE 1. Map of China and studied areas.
The original data for each indicator were principally obtained from the “China Regional Statistical Yearbook”, “Xinjiang Statistical Yearbook”, “China Urban Statistical Yearbook”, “Xinjiang Statistical Yearbook of Science and Technology”, “China County Statistical Yearbook”, and the statistical yearbooks and statistical bulletins of 14 prefectures and cities from 2001 to 2019 in Xinjiang. Furthermore, some of the missing data were interpolated using the trend extrapolation method or the mean value method.
Moreover, energy consumption per 10 thousand yuan GDP = total energy consumption/real GDP, and the total energy consumption is calculated by summing the standard coal converted from the 181 types of energy consumption in each prefecture and city. Evidence suggests that reducing carbon dioxide emissions is key to China achieving its 2030 carbon peak target (Ma et al., 2019c; Wang M et al., 2021), so this paper includes indicators for carbon emissions in the green development subsystem. Carbon emissions per 10 thousand yuan GDP = CO2 emissions/real GDP, and carbon dioxide emissions were estimated using the conversion method provided in the IPCC Guidelines for National Greenhouse Gas Inventories. The formula is
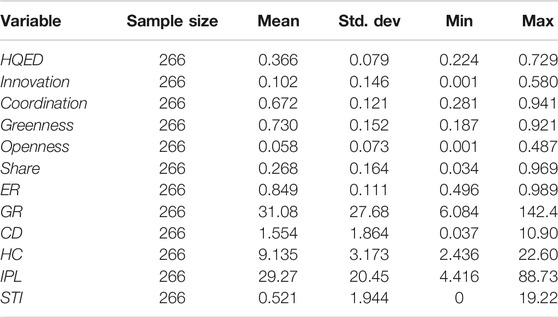
TABLE 3. Descriptive statistics.
To fully investigate the influence of ER on the HQED level in Xinjiang, overall regression was carried out using the Tobit regression model. Furthermore, further regression by region and time was conducted to explore the regional and temporal differences in the effect of ER on the HQED level in Xinjiang. The specific regression results are listed in Table 4.
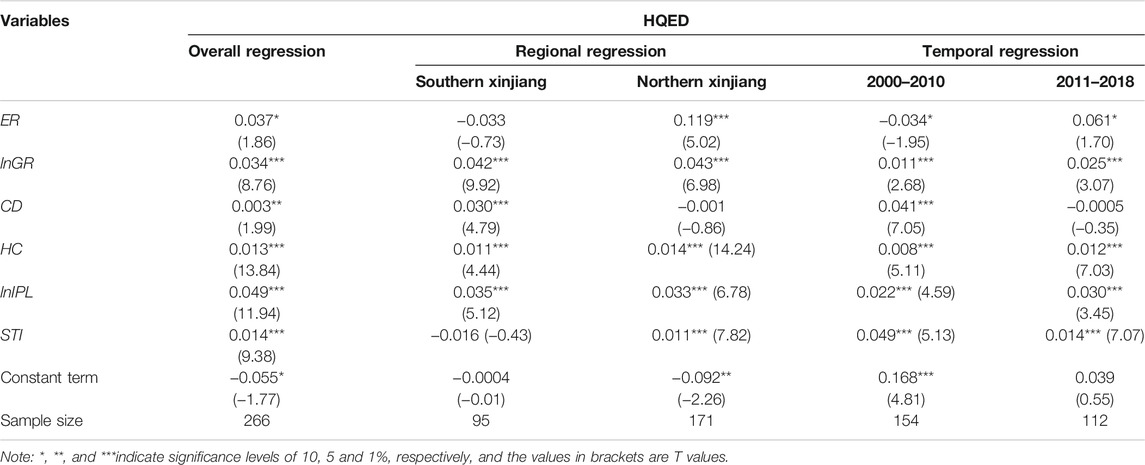
TABLE 4. The impact of environmental regulation on high-quality economic development in Xinjiang.
The results show that ER is obviously positive at the 10% level of significance. For every 1% increase in the composite index of ER intensity, the coefficient of HQED increases by 0.037%, indicating that ER has notably promoted the level of HQED in Xinjiang. This conclusion confirmed Hypothesis H2 of this paper. The effective implementation of ER will encourage technological innovation, and the adoption of clean energy and recycling technology by enterprises will not only gradually reduce pollutant emissions but also improve the resource utilization rate. Ultimately, the “innovation compensation effect” of the impact of ER on HQED is higher than the “cost compliance effect”, which contributes to improving the level of HQED in Xinjiang.
From the control variables, government regulation, capital density, human capital, industrial production level, and scientific and technological innovation all have a noticeable positive influence on HQED in Xinjiang. Specifically, the estimated coefficient of government regulation and capital intensity is obviously positive at the 1 and 5% levels, respectively. Compared to the estimated coefficients of the other variables, capital intensity has the smallest contribution to HQED. This may be explained by the fact that the marginal contribution of extensive investment in fixed assets will gradually weaken when high-quality economic development reaches a certain level. Every 1% increase in the level of human capital and industrial production level will cause a 0.013 and 0.049% increase in the HQED level in Xinjiang, respectively. Xinjiang’s current economic development is still dominated by energy and heavy chemical industries, and the higher the industrial production level is, the greater the marginal contribution to promoting the HQED level in Xinjiang. Scientific and technological innovation is obviously positive at the 1% level, and every 1% increase will cause a 0.014% increase in the HQED level in Xinjiang.
In China, Xinjiang is the largest provincial administrative region in terms of land area. Because of the differences in natural resources, economic development, geographical location, development, and others, the HQED level varies among prefectures and cities in Xinjiang. Thus, there is also some regional heterogeneity in the effect of ER. Considering this situation, this study takes two different regions of southern Xinjiang and northern Xinjiang as the analysis objects and further explores the effects of ER on these different regions.
As shown in Table 4, the coefficient of the effect of ER on HQED in southern Xinjiang is negative but does not pass the test of the significance level. This suggests that ER does not have a significant inhibiting effect on southern Xinjiang. The possible reason lies in the relatively backward economic development of Southern Xinjiang, which is in the critical period of industrial cultivation and economic development. The petrochemical, mineral exploration and development industries in Aksu and Bayingol Mongolian Autonomous Prefecture are gradually developing and expanding. However, the increase in environmental regulation intensity will make some enterprises in southern Xinjiang increase their pollution control budget and reduce their operating benefits. Therefore, environmental regulation may inhibit the improvement of the high-quality development level in Southern Xinjiang’s economy, but due to the small variation range of environmental regulation intensity in Southern Xinjiang, the inhibitory influence of environmental regulation is not obvious at present. For northern Xinjiang, the ER is obviously positive at the 1% level, and every 1% increase in the coefficient of ER will cause a 0.119% increase in the HQED level in northern Xinjiang. As northern Xinjiang has a higher level of economic development and the industrial structure is more reasonable, an increase in environmental regulation intensity can encourage companies to engage in technological innovation, improve the efficiency of resource utilization and reduce pollutant emissions, thus promoting an increase in the HQED level in northern Xinjiang. In a word, to discuss the regional heterogeneity, we divide Xinjiang into southern Xinjiang and northern Xinjiang with Tianshan Mountains as the boundary. The results show that the environmental regulation has no significant effect on the high-quality economic development of southern Xinjiang, but has a significant promotion effect on the northern Xinjiang.
In terms of control variables, government regulation, human capital and industrial production level all facilitate the high-quality development of Northern and Southern Xinjiang’s economies at the significance level of 1%. From the magnitude of the variable estimation coefficient, government regulation and human capital promote HQED in northern Xinjiang slightly more than that in southern Xinjiang. The level of industrial production in southern Xinjiang promotes high-quality economic development slightly more than that in northern Xinjiang. For every 1% growth in government regulation, the high-quality development level of Southern and Northern Xinjiang’s economies will increase by 0.042 and 0.043%, respectively. Every 1% increase in the level of human capital and industrial production level, the high-quality development of Southern and Northern Xinjiang’s economies will increase by 0.011 and 0.014% and 0.035 and 0.033%, respectively. The promotion of HQED in southern Xinjiang by capital intensity is significant, while the impact on northern Xinjiang is not significant. The impact of scientific and technological innovation on HQED in southern Xinjiang is not significant, but it has a remarkable boost to northern Xinjiang. The main reason is that compared with southern Xinjiang, northern Xinjiang is home to a large number of energy industries, and technological innovation can upgrade the industrial structure, develop clean and environmentally friendly industries, and ultimately drive the high-quality development of northern Xinjiang’s economy.
2011 was the opening year of Xinjiang’s “12th Five-Year Plan”. The “12th Five-Year Plan” has provided directions for environmental protection and HQED in Xinjiang. During this period, Xinjiang should innovate its development model, promote coordinated regional development, strengthen ecological and environmental protection, further expand its openness to the outside world, and make safeguarding and improving people’s livelihood the primary goal of economic development. Therefore, this study takes 2011 as the time point and divides the study period 2000–2018 into two time periods, 2000–2010, and 2011–2018, to empirically test the temporal heterogeneity of the effect of ER on HQED in Xinjiang.
From the empirical results (Table 4), environmental regulation was obviously negative at the 10% level between 2000–2010, and every 1% increase in ER caused a 0.034% decrease in the HQED level in Xinjiang, indicating that ER inhibited the increase in the HQED level in Xinjiang. From 2011 to 2018, every 1% increase in ER caused a 0.061% increase in the coefficient of HQED, indicating that environmental regulation promoted the improvement of the HQED level in Xinjiang. According to the coefficient of ER, the promotion impact of ER on HQED in Xinjiang from 2011 to 2018 was greater than the inhibition effect from 2000 to 2010. The main reason is that the Xinjiang government has emphasized the priority of environmental protection and sustainable economic development, while with the emphasis on building an ecological civilization, Xinjiang’s economy has gradually changed from extensive development to intensive and efficient development, and the industrial structure has become increasingly reasonable. Therefore, the impact of ER on HQED in Xinjiang has shifted from negative to positive and has promoted it more significantly.
In a word, to discuss the temporal heterogeneity, we divide the research time into two time periods 2000–2010 and 2011–2018 based on the beginning year of Xinjiang’s “Twelfth Five-Year Plan”. we divided the study into two time periods: 2000–2010 and 2011–2018, using the opening year of Xinjiang’s 12th Five-Year Plan as the dividing line. The results show that environmental regulation is not conducive to the improvement of high-quality economic development level in the early stage, but promotes it in the later stages.
In terms of control variables, government regulation, human capital, industrial production level, and scientific and technological innovation were positively correlated with HQED in Xinjiang in 2000–2010 and 2011–2018. Capital density significantly promoted HQED in Xinjiang from 2000–2010, and its estimated coefficient was negative from 2011 to 2018 but not significant. From the perspective of the magnitude of the variable estimation coefficients, the promotion of government regulation, human capital, and industrial production level to the level of HQED in Xinjiang is further enhanced.
Environmental issues pose a threat to China’s ambitious low-carbon transition goals and are also a stumbling block on the road to high-quality economic development (Lin and Zhou, 2022). To further discuss the influence path of ER on the level of HQED in Xinjiang, regression estimation was conducted using the Tobit regression method with the five subsystem composite indices as the dependent variables.
From the results in Table 5, ER has an obvious positive impact on the innovation development index and shared development index. The coefficient of environmental regulation intensity increases by 1%, and the innovation and shared development indexes increase by 0.348 and 0.126%, respectively. It can be noted that ER has the greatest effect on the promotion of the innovation development index. The main reason is that with the enforcement of ER and under the guidance of relevant policies, enterprises are encouraged to continuously increase R&D investment, innovate development models, and encourage industrial optimization and upgrading. Meanwhile, enterprises themselves have placed greater emphasis on technological innovation and are eagerly seeking high-efficiency and low-polluting production methods and equipment. Therefore, ER has the most obvious promoting effect on the innovation development index. Furthermore, ER has an obvious negative inhibitory effect on the coordinated development index, green development index and open development index. For every 1% increase in the composite index of ER intensity, the coordinated, green and open development index will decrease by 0.170, 0.270 and 0.105%, respectively.
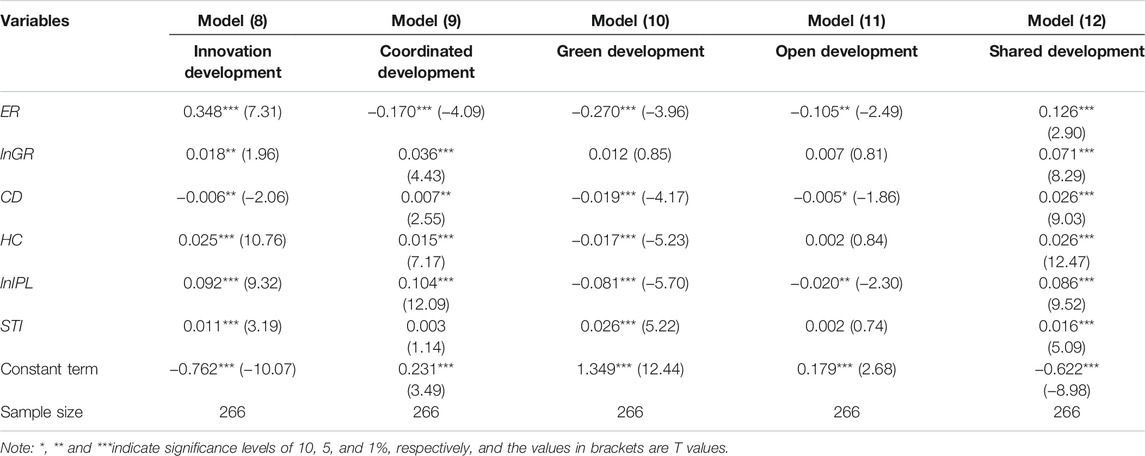
TABLE 5. Estimation results of environmental regulation on the high-quality development subindex.
From the control variables, government regulation has a positive impact on the coordination, innovation and shared development index but has no obvious influence on the green, and open development index. Capital density promotes the shared development index more than the coordination development index, while it has a negative inhibitory influence on the innovation, green and open development index. Human capital has no significant influence on the open development index and is negatively correlated with green development but positively associated with other development indices at the 1% significance level. The level of industrial development has a positive promoting effect on innovation, coordination and the shared development index and a negative inhibiting effect on the green and open development index. Science and technology innovation has a promoting impact on innovation and green and shared development at a significance level of 1% and has no significant impact on the coordination and open development index.
To ensure the stability and accuracy of the results, three methods are used to test the robustness of the research results:
1) Exclude special years. The international financial crisis, which erupted in 2008, has had a huge effect on the global economy (Ma et al., 2019b). Considering the influence of the financial crisis on HQED in Xinjiang, the Tobit regression model was again employed for estimation after eliminating the 2008 data. The regression results are presented in Table 6. There is no change in the significance and direction of the core explanatory variables compared to the results of previous empirical tests.
2) Added control variables. Urbanization is an influential force driving high-quality development. Therefore, the urbanization rate (UR) is increased as a control variable, and the urbanization rate is measured using the urban population as a percentage of the total population. The Tobit regression model was used for estimation, and the estimation results are shown in Table 7. There is no change in the significance and direction of the core explanatory variables compared to the results of previous empirical tests after the addition of control variables.
3) Change the regression method. The robustness of the regression results was further tested by the ordinary least squares (OLS) method. The regression results are presented in Table 8. Compared to the earlier empirical test results, the significance and direction of the core explanatory variables have not changed. Overall, the above three test methods show that the text results of this research are robust.
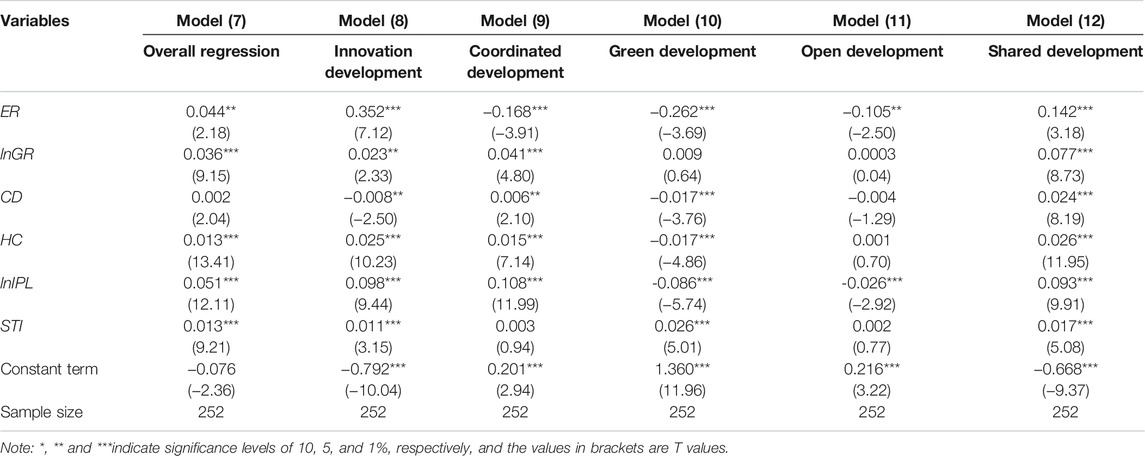
TABLE 6. Robustness test estimates - exclude 2008 data.
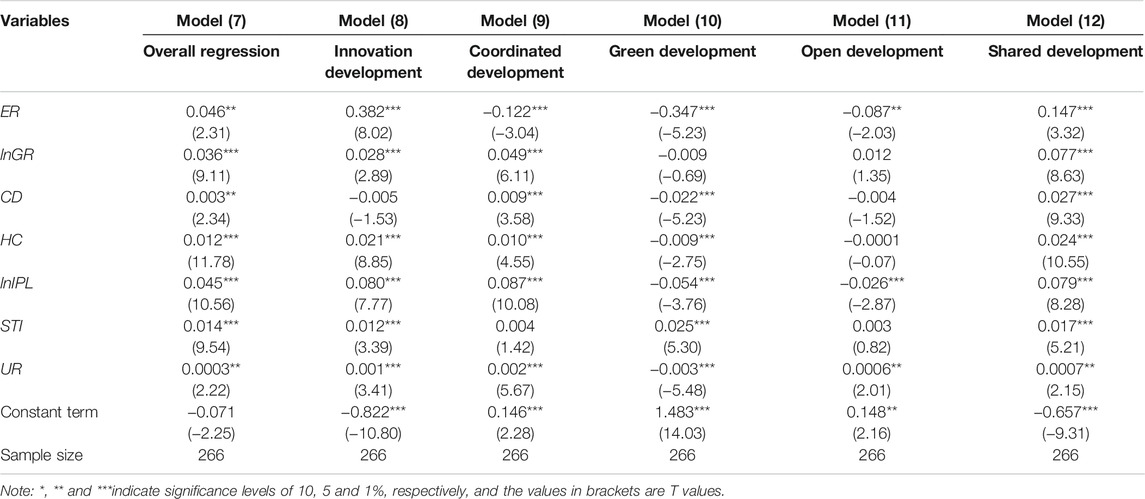
TABLE 7. Robustness test estimates - add control variables.
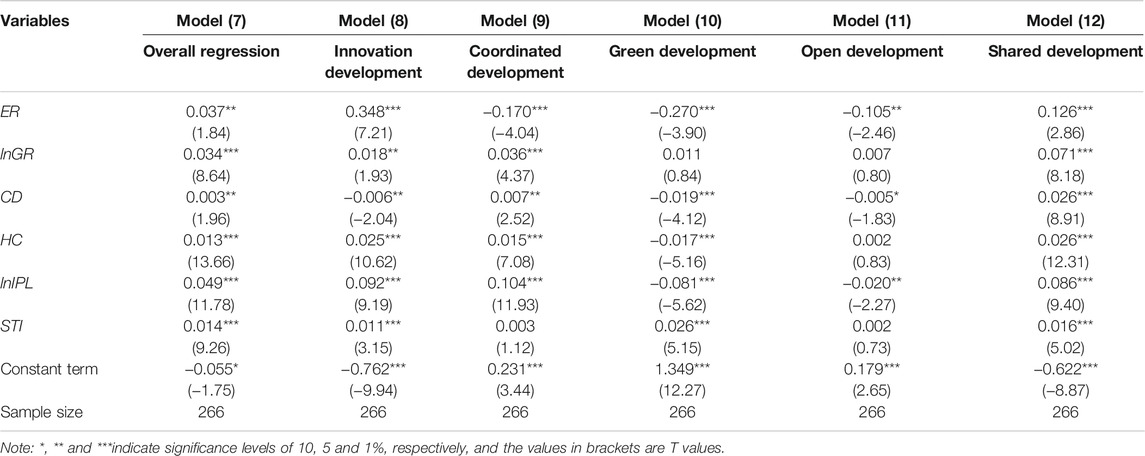
TABLE 8. Robustness test estimates—OLS method.
Based on the findings of this paper, policy recommendations for promoting the win-win condition of environmental protection and HQED in Xinjiang are proposed:
(1) Improve the top-level design of ER. The government, as the chief architect of environmental regulation policies, should be precisely positioned for overall planning, and formulate the goal of coordinated development of environmental protection under the logic of HQED in Xinjiang. Meanwhile, the government should establish a reasonable environmental regulation policy. In coordinating economic development and environmental protection, local governments should adhere to the principle of coordinating and unifying environmental protection with economic development, strengthen scientific and rational decision-making and follow a sustainable development path (Ma et al., 2017b; Sun et al., 2022). Furthermore, local governments should implement ecological civilization and pay attention to the pre-emptive prevention and control of environmental pollution.
(2) Rationally formulate differentiated environmental regulation policies. Governments should establish differentiated ER policies based on the actual conditions of each prefecture and city. For southern Xinjiang, the influence of ER is not significant. At this time, appropriate relaxation of environmental regulatory policies should be formulated based on the industrial structure and resource development in Southern Xinjiang, and increase government support to the Southern Xinjiang region, through the establishment of ecological governance funds and ecological compensation funds to improve the economic backwardness and environmental degradation in Southern Xinjiang, with a view to ER can gradually begin to have a favorable effect on the HQED in Southern Xinjiang. On the contrary, ER can significantly enhance the level of HQED in northern Xinjiang. At this moment, the intensity of ER can be appropriately increased, which will not only be conducive to the improvement of the ecological environment but also further promote the improvement of the HQED level.
(3) Perfect the system construction of ER and improve the efficiency of environmental policy implementation. Xinjiang’s prefectures and cities should change the GDP-only performance assessment mechanism and establish a sound incentive mechanism for environmental protection performance assessment, which should include not only environmental performance in the assessment standards but also the ability to innovate, education, social security and health care. Meanwhile, the target responsibility system of government agencies and leading cadres should be implemented for ecological governance and environmental protection achievement, clarifying the responsibilities of each department, and avoiding the phenomenon of pushing the ball when facing environmental problems. Furthermore, local governments need to set up environmental supervision teams to supervise whether government officials strictly enforce the law and whether companies follow relevant environmental regulations and policies. At the same time, we should strengthen public participation, establish a social supervision mechanism of government and enterprise behavior, increase the penalties for enterprises that violate environmental protection policies, increase enterprises’ illegal costs, improve the deterrent of rule of law and ensure the implementation of ER policies.
According to panel data of 14 prefectures and cities in Xinjiang from 2000–2018, a composite assessment indicator system of ER intensity and the HQED in Xinjiang was constructed from the perspective of industrial “three wastes” and five development concepts, and its comprehensive development index was measured by using the entropy method. Then, the Tobit regression model is applied to explore the effect of ER on HQED in Xinjiang. The core findings are summarized as follows.
i. Environmental regulation significantly promoted the improvement of the HQED level in Xinjiang. Every 1% increase in the ER intensity, the comprehensive index of the HQED increased by 0.037%. All the control variables have a significant positive promoting effect on the HQED level in Xinjiang.
ii. The impact of ER on the HQED level in Xinjiang has regional heterogeneity and temporal heterogeneity. From the viewpoint of regional heterogeneity analysis, the inhibition effect of ER on Southern Xinjiang’s economy is not significant. For northern Xinjiang, every 1% increase in the coefficient of ER will cause a 0.119% increase in the coefficient of HQED in northern Xinjiang. From the perspective of temporal heterogeneity analysis, for every 1% increase in ER intensity from 2000 to 2010, the high-quality economic development level decreased by 0.034%. From 2011 to 2018, every 1% increase in the intensity of ER will cause a 0.061% increase in the HQED in Xinjiang, and the positive promoting effect from 2011 to 2018 was greater than the inhibiting effect from 2000 to 2010.
iii. ER has an obvious positive influence on the innovation development index and shared development index. The coefficient of ER intensity increases by 1%, and the innovation and shared development index will increase by 0.348 and 0.126%, respectively. However, it has an obvious negative influence on the coordinated, green and open development index. For every 1% increase in the composite index of the intensity of ER, the coordinated, green and open development index will decrease by 0.170, 0.270 and 0.105%, respectively.
There are gaps in this study that should be filled through further research. First, the research area can be expanded. Since environmental issues and economic development are unavoidable hot topics in the process of regional development, achieving HQED while protecting the environment is the goal of all countries and regions (Zhang et al., 2022). Thus, future research can expand the research area to the whole world. Second, HQED in Xinjiang requires not only environmental regulation to control and restrain pollution behavior, but also energy consumption to support economic growth. Thus, future research can deeply explore the relationship between ER, energy efficiency, and HQED in Xinjiang. Finally, as China has become the world’s largest carbon emitter and China’s construction sector is the second largest sector in terms of energy consumption in China (Ma et al., 2017a; Yan et al., 2017), future research could explore whether the implementation of environmental regulations could reduce CO2 emissions from China’s construction sector and thus promote HQED.
The original contributions presented in the study are included in the article/Supplementary Material, further inquiries can be directed to the corresponding authors.
MM and ZM conceptualized the framework of this study. LY contributed to the methodology, data collection, data calculation, and results analysis. YX helped to revise the original manuscript. All authors read, revised and approved the final version of the original manuscript.
This study was supported by the National Planning Office of Philosophy and Social Science Foundation of China (21CJY030 and 18BJL034), the Beijing Natural Science Foundation (8224085), the China Postdoctoral Science Foundation (2020M680020), the Shuimu Tsinghua Scholar Program of Tsinghua University (2019SM139), and the Fundamental Research Funds for the Central Universities of China (2020CDJSK03YJ07).
The authors declare that the research was conducted in the absence of any commercial or financial relationships that could be construed as a potential conflict of interest.
All claims expressed in this article are solely those of the authors and do not necessarily represent those of their affiliated organizations, or those of the publisher, the editors and the reviewers. Any product that may be evaluated in this article, or claim that may be made by its manufacturer, is not guaranteed or endorsed by the publisher.
The Supplementary Material for this article can be found online at: https://www.frontiersin.org/articles/10.3389/fenrg.2021.838852/full#supplementary-material
CO2, Carbon dioxide; GDP, Gross domestic product; IPCC, Intergovernmental Panel on Climate Change; R&D; Research and development; SO2, Sulfur dioxide; C, Carbon dioxide emissions; CD, Capital density; CEFi, Energy carbon emission coefficient; COFi, Carbon oxidation factor; Coordination, Coordinated development index; Ei, Consumption of 18 types of energy; ER, Environmental regulation; GR, Government regulation; Greenness, Green development index; HC, Human capital; Innovation, Innovation development index; IPL, Industrial production level; NCVi, Average low calorific value of various types of energy; Openness, Open development index; HQED, High-quality economic development; Share, Shared development index; STI, Science and technology innovation; UR, Urbanization rate.
1The 18 energy categories include coal, refinery dry gas, coke, diesel, coke oven gas, residual heat and pressure, blast furnace gas, natural gas, crude oil, heat and electricity, gasoline, fuel oil, petroleum pitch, lubricants, liquefied petroleum gas, and other petroleum products.
Cai, W., Liu, C., Jia, S., Chan, F. T. S., Ma, M., and Ma, X. (2020). An Emergy-Based Sustainability Evaluation Method for Outsourcing Machining Resources. J. Clean. Prod. 245, 118849. doi:10.1016/j.jclepro.2019.118849
Cao, Y., Wan, N., Zhang, H., Zhang, X., and Zhou, Q. (2020b). Linking Environmental Regulation and Economic Growth through Technological Innovation and Resource Consumption: Analysis of Spatial Interaction Patterns of Urban Agglomerations. Ecol. Indicators 112, 106062. doi:10.1016/j.ecolind.2019.106062
Cao, Y., Liu, J., Yu, Y., and Wei, G. (2020a). Impact of Environmental Regulation on green Growth in China's Manufacturing Industry-Based on the Malmquist-Luenberger index and the System GMM Model. Environ. Sci. Pollut. Res. 27, 41928–41945. doi:10.1007/s11356-020-10046-1
Chen, L., Cai, W., and Ma, M. (2020). Decoupling or Delusion? Mapping Carbon Emission Per Capita Based on the Human Development index in Southwest China. Sci. Total Environ. 741, 741138722. doi:10.1016/j.scitotenv.2020.138722
Chen, M., Ma, M., Lin, Y., Ma, Z., and Li, K. (2022). Carbon Kuznets Curve in China's Building Operations: Retrospective and Prospective Trajectories. Sci. Total Environ. 803, 150104. doi:10.1016/j.scitotenv.2021.150104
Chen, M., and Wang, H. (2021). Import Technology Sophistication and High-Quality Economic Development: Evidence from City-Level Data of China. Econ. Research-Ekonomska Istraživanja 479, 1–36. doi:10.1080/1331677x.2021.1956362
Cui, C., Shan, Y., Liu, J., Yu, X., Wang, H., and Wang, Z. (2019). CO2 Emissions and Their Spatial Patterns of Xinjiang Cities in China. Appl. Energ. 252, 113473. doi:10.1016/j.apenergy.2019.113473
Dong, K., Jiang, Q., Shahbaz, M., and Zhao, J. (2021). Does Low-Carbon Energy Transition Mitigate Energy Poverty? the Case of Natural Gas for China. Energ. Econ. 99, 105324. doi:10.1016/j.eneco.2021.105324
Dong, K., Shahbaz, M., and Zhao, J. (2022). How Do Pollution Fees Affect Environmental Quality in China? Energy Policy 160, 112695. doi:10.1016/j.enpol.2021.112695
Du, K., Cheng, Y., and Yao, X. (2021). Environmental Regulation, green Technology Innovation, and Industrial Structure Upgrading: The Road to the green Transformation of Chinese Cities. Energ. Econ. 98, 105247. doi:10.1016/j.eneco.2021.105247
Du, W., Wang, F., and Li, M. (2020). Effects of Environmental Regulation on Capacity Utilization: Evidence from Energy Enterprises in China. Ecol. Indicators 113, 106217. doi:10.1016/j.ecolind.2020.106217
Geng, Y., Liu, W., Li, K., and Chen, H. (2021). Environmental Regulation and Corporate Tax Avoidance: A Quasi-Natural experiment Based on the Eleventh Five-Year Plan in China. Energ. Econ. 99, 105312. doi:10.1016/j.eneco.2021.105312
Jiang, L., Zuo, Q., Ma, J., and Zhang, Z. (2021). Evaluation and Prediction of the Level of High-Quality Development: A Case Study of the Yellow River Basin, China. Ecol. Indicators 129, 107994. doi:10.1016/j.ecolind.2021.107994
Jing, R., Wang, M., Zhang, Z., Wang, X., Li, N., Shah, N., et al. (2019). Distributed or Centralized? Designing District-Level Urban Energy Systems by a Hierarchical Approach Considering Demand Uncertainties. Appl. Energ. 252, 113424. doi:10.1016/j.apenergy.2019.113424
Jing, R., Wang, M., Liang, H., Wang, X., Li, N., Shah, N., et al. (2018a). Multi-objective Optimization of a Neighborhood-Level Urban Energy Network: Considering Game-Theory Inspired Multi-Benefit Allocation Constraints. Appl. Energ. 231, 534–548. doi:10.1016/j.apenergy.2018.09.151
Jing, R., Zhu, X., Zhu, Z., Wang, W., Meng, C., Shah, N., et al. (2018b). A Multi-Objective Optimization and Multi-Criteria Evaluation Integrated Framework for Distributed Energy System Optimal Planning. Energ. Convers. Manage. 166, 445–462. doi:10.1016/j.enconman.2018.04.054
Korhonen, J., Pätäri, S., Toppinen, A., and Tuppura, A. (2015). The Role of Environmental Regulation in the Future Competitiveness of the Pulp and Paper Industry: the Case of the Sulfur Emissions Directive in Northern Europe. J. Clean. Prod. 108, 864–872. doi:10.1016/j.jclepro.2015.06.003
Li, K., Ma, M., Xiang, X., Feng, W., Ma, Z., Cai, W., et al. (2022). Carbon Reduction in Commercial Building Operations: A Provincial Retrospection in China. Appl. Energ. 306, 118098. doi:10.1016/j.apenergy.2021.118098
Li, X., Lu, Y., and Huang, R. (2021). Whether Foreign Direct Investment Can Promote High-Quality Economic Development under Environmental Regulation: Evidence from the Yangtze River Economic Belt, China. Environ. Sci. Pollut. Res. 28, 21674–21683. doi:10.1007/s11356-020-12032-z
Liang, Y., Cai, W., and Ma, M. (2019). Carbon Dioxide Intensity and Income Level in the Chinese Megacities' Residential Building Sector: Decomposition and Decoupling Analyses. Sci. Total Environ. 677, 315–327. doi:10.1016/j.scitotenv.2019.04.289
Lin, B., and Zhou, Y. (2022). Does Energy Efficiency Make Sense in China? Based on the Perspective of Economic Growth Quality. Sci. Total Environ. 804, 149895. doi:10.1016/j.scitotenv.2021.149895
Lin, B., and Chen, X. (2020). Environmental Regulation and Energy-Environmental Performance-Empirical Evidence from China's Non-ferrous Metals Industry. J. Environ. Manage. 269, 110722. doi:10.1016/j.jenvman.2020.110722
Liu, Y., Li, Z., and Yin, X. (2018). The Effects of Three Types of Environmental Regulation on Energy Consumption-Evidence from China. Environ. Sci. Pollut. Res. 25, 27334–27351. doi:10.1007/s11356-018-2769-5
Liu, Y., Liu, M., Wang, G., Zhao, L., and An, P. (2021). Effect of Environmental Regulation on High-Quality Economic Development in China-An Empirical Analysis Based on Dynamic Spatial Durbin Model. Environ. Sci. Pollut. Res. 28, 54661–54678. doi:10.1007/s11356-021-13780-2
Lu, H., Ma, X., Ma, M., and Zhu, S. (2021b). Energy price Prediction Using Data-Driven Models: A Decade Review. Comp. Sci. Rev. 39, 100356. doi:10.1016/j.cosrev.2020.100356
Lu, H., Ma, X., and Ma, M. (2021a). A Hybrid Multi-Objective Optimizer-Based Model for Daily Electricity Demand Prediction Considering COVID-19. Energy 219, 119568. doi:10.1016/j.energy.2020.119568
Ma, M., Cai, W., and Cai, W. (2018a). Carbon Abatement in China's Commercial Building Sector: A Bottom-Up Measurement Model Based on Kaya-LMDI Methods. Energy 165, 350–368. doi:10.1016/j.energy.2018.09.070
Ma, M., Cai, W., Cai, W., and Dong, L. (2019a). Whether Carbon Intensity in the Commercial Building Sector Decouples from Economic Development in the Service Industry? Empirical Evidence from the Top Five Urban Agglomerations in China. J. Clean. Prod. 222, 193–205. doi:10.1016/j.jclepro.2019.01.314
Ma, M., and Cai, W. (2019). Do commercial Building Sector-Derived Carbon Emissions Decouple from the Economic Growth in Tertiary Industry? A Case Study of Four Municipalities in China. Sci. Total Environ. 650, 822–834. doi:10.1016/j.scitotenv.2018.08.078
Ma, M., and Cai, W. (2018). What Drives the Carbon Mitigation in Chinese Commercial Building Sector? Evidence from Decomposing an Extended Kaya Identity. Sci. Total Environ. 634, 884–899. doi:10.1016/j.scitotenv.2018.04.043
Ma, M., Cai, W., and Wu, Y. (2019b). China Act on the Energy Efficiency of Civil Buildings (2008): A Decade Review. Sci. Total Environ. 651, 42–60. doi:10.1016/j.scitotenv.2018.09.118
Ma, M., Ma, X., Cai, W., and Cai, W. (2019c). Carbon-dioxide Mitigation in the Residential Building Sector: A Household Scale-Based Assessment. Energ. Convers. Manage. 198, 111915. doi:10.1016/j.enconman.2019.111915
Ma, M., Ma, X., Cai, W., and Cai, W. (2020). Low Carbon Roadmap of Residential Building Sector in China: Historical Mitigation and Prospective Peak. Appl. Energ. 273, 115247. doi:10.1016/j.apenergy.2020.115247
Ma, M., Pan, T., Pan, T., and Ma, Z. (2017a). Examining the Driving Factors of Chinese Commercial Building Energy Consumption from 2000 to 2015: A STIRPAT Model Approach. Jestr 10, 28–38. doi:10.25103/jestr.103.05
Ma, M., Yan, R., and Cai, W. (2018b). Energy Savings Evaluation in Public Building Sector during the 10th-12th FYP Periods of China: an Extended LMDI Model Approach. Nat. Hazards 92, 429–441. doi:10.1007/s11069-018-3210-6
Ma, M., Yan, R., Du, Y., Ma, X., Cai, W., and Xu, P. (2017b). A Methodology to Assess China's Building Energy Savings at the National Level: An IPAT-LMDI Model Approach. J. Clean. Prod. 143, 784–793. doi:10.1016/j.jclepro.2016.12.046
Ouyang, X., Li, Q., and Du, K. (2020). How Does Environmental Regulation Promote Technological Innovations in the Industrial Sector? Evidence from Chinese Provincial Panel Data. Energy Policy 139, 111310. doi:10.1016/j.enpol.2020.111310
Shen, N., Liao, H., Deng, R., and Wang, Q. (2019). Different Types of Environmental Regulations and the Heterogeneous Influence on the Environmental Total Factor Productivity: Empirical Analysis of China's Industry. J. Clean. Prod. 211, 171–184. doi:10.1016/j.jclepro.2018.11.170
Shum, W. Y., Ma, N., Lin, X., and Han, T. (2021). The Major Driving Factors of Carbon Emissions in China and Their Relative Importance: An Application of the LASSO Model. Front. Energ. Res. 9, 726127. doi:10.3389/fenrg.2021.726127
Song, Y., Zhang, X., and Zhang, M. (2021). The Influence of Environmental Regulation on Industrial Structure Upgrading: Based on the Strategic Interaction Behavior of Environmental Regulation Among Local Governments. Technol. Forecast. Soc. Change 170, 120930. doi:10.1016/j.techfore.2021.120930
Sun, Z., Ma, Z., Ma, M., Cai, W., Xiang, X., Zhang, S., et al. (2022). Carbon Peak and Carbon Neutrality in the Building Sector: a Bibliometric Review. Buildings [Epub ahead of Print]. doi:10.13140/RG.2.2.22799.10402
Tang, J., Zhong, S., and Xiang, G. (2019). Environmental Regulation, Directed Technical Change, and Economic Growth: Theoretic Model and Evidence from China. Int. Reg. Sci. Rev. 42, 519–549. doi:10.1177/0160017619835901
Wang, A., Hu, S., and Lin, B. (2021). Can Environmental Regulation Solve Pollution Problems? Theoretical Model and Empirical Research Based on the Skill Premium. Energ. Econ. 94, 105068. doi:10.1016/j.eneco.2020.105068
Wang, M., Yu, H., Yang, Y., Lin, X., Guo, H., Li, C., et al. (2021). Unlocking Emerging Impacts of Carbon Tax on Integrated Energy Systems through Supply and Demand Co-optimization. Appl. Energ. 302, 117579302. doi:10.1016/j.apenergy.2021.117579
Xiang, X., Ma, X., Ma, Z., Ma, M., and Cai, W. (2022b). Python-LMDI: A Tool for index Decomposition Analysis to Building Carbon Emissions. Buildings [Epub ahead of Print]. doi:10.13140/RG.2.2.16088.21767
Xiang, X., Ma, X., Ma, Z., and Ma, M. (2022a). Operational Carbon Change in Commercial Buildings under the Carbon Neutral Goal: a LASSO–WOA Approach. Buildings 12, 54. doi:10.3390/buildings12010054
Xiang, X., Ma, X., Ma, M., Wu, W., and Yu, L. (2020). Research and Application of Novel Euler Polynomial-Driven Grey Model for Short-Term PM10 Forecasting. Gs 11, 498–517. doi:10.1108/gs-02-2020-0023
Xie, Z., Qu, L., Lin, R., and Guo, Q. (2021). Relationships between Fluctuations of Environmental Regulation, Technological Innovation, and Economic Growth: a Multinational Perspective. J. Enterprise Inf. Manage. ahead-of-print. doi:10.1108/jeim-02-2021-0104
Xiude, C., Yuting, T., Miaoxin, L., Guangyu, Z., Wencong, M., Shiwei, Y., et al. (2021). How Information Technology Investment Affects Green Innovation in Chinese Heavy Polluting Enterprises. Front. Energ. Res. 9, 719052. doi:10.3389/fenrg.2021.719052
Xu, L.-j., Fan, X.-c., Wang, W.-q., Xu, L., Duan, Y.-l., and Shi, R. J. (2017). Renewable and Sustainable Energy of Xinjiang and Development Strategy of Node Areas in the “Silk Road Economic Belt”. Renew. Sust. Energ. Rev. 79, 274–285. doi:10.1016/j.rser.2017.05.031
Yan, R., Ma, M., and Pan, T. (2017). Estimating Energy Savings in Chinese Residential Buildings from 2001 to 2015: A Decomposition Analysis. J. Eng. Sci. Tech. Rev. 10, 107–113. doi:10.25103/jestr.101.15
Yang, Q., and Song, D. (2019). How Does Environmental Regulation Break the Resource Curse: Theoretical and Empirical Study on China. Resour. Pol. 64, 101480. doi:10.1016/j.resourpol.2019.101480
Yu, X., and Wang, P. (2021). Economic Effects Analysis of Environmental Regulation Policy in the Process of Industrial Structure Upgrading: Evidence from Chinese Provincial Panel Data. Sci. Total Environ. 753, 142004. doi:10.1016/j.scitotenv.2020.142004
Zhang, J., Ouyang, Y., Ballesteros-Pérez, P., Li, H., Philbin, S. P., Li, Z., et al. (2021). Understanding the Impact of Environmental Regulations on green Technology Innovation Efficiency in the Construction Industry. Sust. Cities Soc. 65, 102647. doi:10.1016/j.scs.2020.102647
Zhang, M., Liu, X., Ding, Y., and Wang, W. (2019). How Does Environmental Regulation Affect Haze Pollution Governance?-An Empirical Test Based on Chinese Provincial Panel Data. Sci. Total Environ. 695, 133905. doi:10.1016/j.scitotenv.2019.133905
Zhang, S., Ma, M., Li, K., Ma, Z., Feng, W., and Cai, W. (2022). Historical Carbon Abatement in the Commercial Building Operation: China versus the US. Energ. Econ., 105, 105712. doi:10.1016/j.eneco.2021.105712
Zhang, S., Xiang, X., Ma, Z., Ma, M., and Zou, C. (2021). Carbon Neutral Roadmap of Commercial Building Operations by Mid-Century: Lessons from China. Buildings 11, 510. doi:10.3390/buildings11110510
Zhang, X., Zhao, Y., Wang, C., Wang, F., and Qiu, F. (2019). Decoupling Effect and Sectoral Attribution Analysis of Industrial Energy-Related Carbon Emissions in Xinjiang, China. Ecol. Indicators 97, 1–9. doi:10.1016/j.ecolind.2018.09.056
Zhao, J., Shahbaz, M., Dong, X., and Dong, K. (2021). How Does Financial Risk Affect Global CO2 Emissions? the Role of Technological Innovation. Technol. Forecast. Soc. Change 168, 120751. doi:10.1016/j.techfore.2021.120751
Zhao, X., Liu, C., Sun, C., and Yang, M. (2020). Does Stringent Environmental Regulation lead to a Carbon haven Effect? Evidence from Carbon-Intensive Industries in China. Energ. Econ. 86, 104631. doi:10.1016/j.eneco.2019.104631
Zhou, B., Zeng, X., Jiang, L., and Xue, B. (2020). High-quality Economic Growth under the Influence of Technological Innovation Preference in China: A Numerical Simulation from the Government Financial Perspective. Struct. Change Econ. Dyn. 54, 163–172. doi:10.1016/j.strueco.2020.04.010
Keywords: high-quality economic development, energy consumption, impact analysis, environmental regulation, xinjiang
Citation: Yang L, Ma Z, Ma M and Xu Y (2022) Decarbonization, Environmental Regulation, and Economic Boom: An Indicator Assessment Based on the Industrial Waste. Front. Energy Res. 9:838852. doi: 10.3389/fenrg.2021.838852
Received: 18 December 2021; Accepted: 28 December 2021;
Published: 03 February 2022.
Edited by:
Chenyang Shuai, University of Michigan, United StatesReviewed by:
Rui Jing, Cardiff University, United KingdomCopyright © 2022 Yang, Ma, Ma and Xu. This is an open-access article distributed under the terms of the Creative Commons Attribution License (CC BY). The use, distribution or reproduction in other forums is permitted, provided the original author(s) and the copyright owner(s) are credited and that the original publication in this journal is cited, in accordance with accepted academic practice. No use, distribution or reproduction is permitted which does not comply with these terms.
*Correspondence: Zhili Ma, bXpsbXhAY3F1LmVkdS5jbg==; Minda Ma, bWFtaW5kYUBjcXUuZWR1LmNu
Disclaimer: All claims expressed in this article are solely those of the authors and do not necessarily represent those of their affiliated organizations, or those of the publisher, the editors and the reviewers. Any product that may be evaluated in this article or claim that may be made by its manufacturer is not guaranteed or endorsed by the publisher.
Research integrity at Frontiers
Learn more about the work of our research integrity team to safeguard the quality of each article we publish.