 Bin Yang
 Wudi Zhang
- School of Energy and Environment Science, Yunnan Normal University, Kunming, China
Anaerobic digestion is widely used to simultaneously generate biogas while treating different organic wastes. It is difficult to determine the source of CH4 from the complex microbial community structure using traditional microbiological pure culture techniques. Therefore, this study aimed to elucidate the microbial source of CH4 in low-temperature anaerobic digestion systems using the recently developed high-throughput sequencing technology. Herein, anaerobic digestion microbes were domesticated at 15°C and then inoculated into pig manure-containing raw materials in a batch anaerobic digester to form a low-temperature anaerobic digestion system with fermentation controlled at 15°C. Several analytical approaches including abiotic factor analysis and biotic factor analysis (high-throughput sequencing) were applied to investigate the abiotic factors, bacterial communities, and archaeal communities in the low-temperature anaerobic digestion system. The results showed that: 1) The anaerobic digestion lasted for 120 days, with 68.65 L total gas production and 31.19 L CH4 production. 2) The relative abundances of the primary and secondary dominant bacterial operational taxonomic units ranged from 8.02 to 22.84% and 5.62–17.09%, respectively, with 99% similarities to Clostridium cellulovorans (a typical cellulose- and hemicellulose-degrading bacterium) and Terrisporobacter petrolearius (a representative fermentation bacterium), respectively. Moreover, the relative abundance of the primary dominant methanogenic archaeal operational taxonomic unit ranged from 1.03 to 16.85%, with 98% similarity to Methanobacterium beijingense, which is a typical hydrogenotropic methanogen. Based on the low-temperature CH4-producing metabolic pathways of bacterial and methanogenic operational taxonomic units, Methanobacterium beijingense was found to be the primary functional microbe for CH4 production in the 15°C anaerobic digestion system.
1 Introduction
Anaerobic digestion technology has been widely used worldwide because it can produce biogas from agricultural organic waste (such as livestock manure), industrial organic waste (such as alcohol-containing wastewater), and municipal organic waste (such as kitchen waste), generating clean energy in the form of gas while effectively treating organic waste.
Anaerobic digestion is a biological metabolic process (Basile et al., 2020), and the microorganisms in natural and engineered anaerobic digestion systems are a microbial mixture mainly consisting of bacteria and archaea. It has been a major challenge to determine the source of CH4 from the complex microbial community structure. Previously, the metabolic connection between microorganisms and CH4 could only be determined through pure culture techniques, which were traditionally advantageous in terms of their low cost and ability to determine the physiological and biochemical characteristics of microorganisms. Through the culturing techniques, researchers can gain a preliminary understanding of the microbial community structure. For example, a pure culture of Methanobacterium strain IM1 was obtained by Tamisier et al. (2021) through isolation, to metabolize CO2 and H2 to produce CH4. However, it was unattainable to culture microorganisms on a large scale due to the difference in nutrition composition between the culture medium and the natural and engineered anaerobic digestion environments; therefore, the natural and engineered anaerobic digestion systems became “black boxes.” Understanding on the basic ecological structures such as species composition, community structure, community function, and community succession of these microbial communities has been limited, making it difficult to determine the contribution of a single microorganism to CH4 production in a complex system. Traditional microbiological techniques based on the isolation, culturing, as well as morphological, metabolic, physiological-biochemical, and genetic characterization of pure cultures of microorganisms were unable to reveal the biological processes in anaerobic digestion systems.
Therefore, the elucidation of complex microbial systems relies on advances in research techniques, and the emergence of molecular culture-free techniques has provided a new avenue of solution. Studies on the structural analysis of complex microbial communities in anaerobic digestion systems have gradually evolved from traditional pure culture techniques (Fones et al., 2021) to techniques such as denaturing gradient gel electrophoresis (Verma et al., 2018), rRNA gene clone libraries (Sakurai et al., 2021), and the newly developed high-throughput sequencing technique. This technique is suitable for whole genome analysis (Campanaro et al., 2018), and also meets the research requirements of complex microbial systems in anaerobic digestion. CH4 is the main component of biogas and determining its microbial origin is the basis for the design and application of efficient anaerobic digestion systems. However, anaerobic digestion systems contain complex microbial community structures and gas components, and no simple direct relationship exists between microorganisms and gases, which hinders the application of the systems. In addition, the requirement of strict operating conditions and strain isolation in anaerobic processes further increases the difficulty. Therefore, to overcome the problems of existing scientific research, this study used high-throughput sequencing technology to analyze the microbial community structure in anaerobic digestion systems, preliminarily determined the CH4-producing strains and their relative contents, to elucidate the contribution of single strains to CH4 production in anaerobic digestion systems. As the average temperature of the Earth’s surface is approximately 15°C, this study was focused on determining the CH4 source in anaerobic digestion systems controlled at this temperature.
2 Materials and Methods
2.1 Experimental Setup
The experimental setup of this study is shown in Figure 1, which consists of three parts: an anaerobic digestion system, a gas storage system, and a water bath cooling system. The fermentation process in the anaerobic digestion system is conducted in a glass batch fermentation reactor with an effective volume of 10 L; the gas storage system comprises a plexiglass low-pressure wet gas storage tank with a volume of 5 L; and the cooling system is composed of a chiller (MA-01 model, Jiaxing New Maginot Machinery Co., Ltd., China) and a stainless steel water bath. Before each batch experiment, the remaining air in the system was purged with nitrogen gas for 20 min and the reactor were then sealed with a rubber stopper.
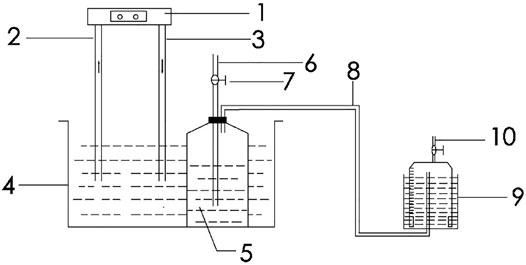
FIGURE 1. Schematic diagram of the test setup for low-temperature anaerobic digestion system (1 Chiller; 2 Inlet pipe; 3 Outlet pipe; 4 Water bath; 5 Batch fermentation reactor; 6 Sampling tube; 7 Gas valve; 8 Gas pipe; 9 Gas storage cabinet; 10 Exhaust pipe).
2.2 Raw Materials and Inoculum
The raw material used for anaerobic digestion in this study was fresh pig manure from a large pig farm in Fumin County, Kunming City, China. The total solid (TS) and volatile solid (VS) content were determined to be 29.76 and 81.11%, respectively. The anaerobic digestion inoculum used in this research was anaerobic activated sludge taken from the No. 6 Sewage Treatment Plant in Kunming City, Yunnan Province, China, and was domesticated for 6 months at 15°C, initially containing 6.56% TS and 53.49% VS.
2.3 Experimental Methods
The anaerobic digestion process used in this study was a complete mix batch digester maintained at 15°C. The anaerobic digestion feedstock solution was prepared according to a fixed food to microorganism ratio (F/M), i.e., the VS/VS ratio of pig manure to inoculum was set at 0.75 as, according to Fransiscus and Simangunsong (2021), the appropriate F/M for anaerobic digestion systems should be ≤ 1. The total volume of the feedstock solution was 10 L, comprising 200 g of inocula (in VS), 150 g of pig manure (in VS), and water to make up the rest of the volume. We set up 3 repeated experimental groups, and all experimental data are the average of the 3 repeated experimental groups.
After the onset of the experiment, analysis for abiotic factors was conducted as follows: biogas production was recorded daily, and samples were collected every 10 days for the determination of biogas composition, pH, TS, VS, soluble chemical oxygen demand (sCOD), ammonia nitrogen, and volatile fatty acids (VFAs). Meanwhile, analysis for biotic factors was also performed. Samples of feedstock solution were collected every 10 days and frozen at −80°C for storage. After the experiment was completed, samples of feedstock solution collected at different anaerobic digestion stages were used for analysis of biotic factors.
2.4 Abiotic Factors and Related Analyses
Biogas was collected in a gas storage tank with a volumetric scale marked on the bell cover of the tank, and the generated biogas was measured daily at a fixed time. The TS and VS were determined through drying and combustion using an electric thermostatic drying oven (Model DHG-9070A, Shanghai Yiheng Scientific Instruments Co., Ltd., China) and a chamber furnace (Model SX-5-12, Tianjin Taisite Instruments Co., Ltd., China), respectively, according to existing methods (Zhang and Yin, 2020). The biogas composition was analyzed by gas chromatography (GC-6890A, Lunan Analytical Instruments Co., Ltd., China), the pH value using a pH meter (PHS-25, Shanghai Jinmai Instruments Co., Ltd., China), the sCOD with a COD analyzer (CODmax II, Hach Company, United States), the ammonia nitrogen using an ammonia nitrogen analyzer (Amtax Compact II, Hach Company, United States), and VFAs by gas chromatograph (GC-9790 II, Zhejiang Fuli Analytical Instruments Co., Ltd., China). Details on the operation procedures for each test are specified in the respective instrument manuals.
2.5 Biotic Factors and Related Analyses
2.5.1 Deoxyribonucleic Acid Extraction and Polymerase Chain Reaction Amplification
The sample DNA was extracted using the magnetic bead-based DNA extraction kit (DP328, Tiangen Biotechnology Co., Ltd., China), according to the procedure specified in the instruction manual. Then, the purity and concentration of DNA were detected using 1% agarose gel electrophoresis. A certain amount of qualified DNA samples were taken in a centrifuge tube and diluted to 1 ng/μL using sterilized water.
Using the diluted genomic DNA as a template, the V3-V4 region of bacterial 16S rDNA and the V4-V5 region of archaeal 16S rDNA were selected as amplification regions, and PCR amplification was performed using the barcoded bacterial primer 341F/806R and the archaeal primer Arch519F/915R (An et al., 2020).
The PCR products were thoroughly mixed homogenously according to their concentrations, followed by agarose gel electrophoresis (gel concentration of 2%) using gel prepared with 1 × TAE (tris-acetate-ethylenediaminetetraacetic acid) electrophoresis buffer. Sequences with a primary band size between 400 and 450 bp were selected for cutting to recover the target bands, and the PCR products were recovered and purified using the GeneJET Gel Extraction Kit (K069, Thermo Fisher Scientific, United States).
2.5.2 Library Construction and Sequencing
Library construction was performed using the library construction kit Ultra™ DNA Library Prep Kit for Illumina (New England Biolabs, United States), and then library quality assessment (Qubit and Q-PCR quantification) was performed on the established libraries. If the libraries passed the assessment, the HiSeq2500 PE250 platform (Illumina, Inc., United States) was used for sequencing.
After removing the barcode and primer sequences from the sequencing data [pair end (PE) reads] obtained from the sequencing platform, the reads of each sample were spliced using FLASH (V1.2.7; http://ccb.jhu.edu/software/FLASH/), and the spliced sequences were considered as raw tags. According to the quality control process of QIIME (V1.7.0; http://qiime.org/scripts/split_libraries_fastq.html), the spliced raw tags were filtered to obtain tag data with high quality, termed as clean tags. The clean tags were compared with the database (Gold database; https://gold.jgi.doe.gov/) to detect chimeric sequences, and the chimeric sequences were removed by UCHIME Algorithm software (https://www.drive5.com/usearch/manual/uchime_algo.html) to obtain the final effective data, referred to as effective tags.
2.5.3 Operational Taxonomic Unit Clustering and Taxonomic Annotation
The effective tags of all samples were clustered using UPARSE software (V7.0.1001; https://drive5.com/uparse/), and the sequences were clustered into operational taxonomic units (OTUs) based on at least 97% similarity (identity). Simultaneously, representative sequences of OTUs were selected for taxonomic annotation. The representative sequences of the selected OTUs were compared with known sequences in GenBank (https://www.ncbi.nlm.nih.gov/genbank/) through Basic Local Alignment Search Tool (BLAST) analysis to identify the strains with the highest homology. The Mothur method (https://mothur.org/) and the SILVA SSUrRNA database (https://www.arb-silva.de/) were used to obtain taxonomic information and to specify the community composition of individual samples at the respective taxonomic levels.
2.6 Correlation Analysis
Correlations were analyzed between abiotic factors, abundant bacterial and archaeal OTUs, and bacterial and archaeal communities, in various combinations. All correlation analyses were based on two-side t test and Pearson correlation analysis, and the relevant data were statistically processed using SPSS software (Version 22.0).
3 Results and Analysis
3.1 Abiotic Factor Dynamics During Different Stages of Anaerobic Digestion
Table 1 shows the dynamic changes of abiotic factors in the low-temperature anaerobic digestion system at different stages in this study. After the onset of anaerobic digestion, the TS and VS contents gradually decreased, indicating that the organic substrates in the system had been significantly consumed by the anaerobic microorganisms in the digester. The sCOD content reached its maximum value (9,247 mg/L) on the 10th day of anaerobic digestion. This was due to the hydrolysis of organic solids (insoluble macromolecular organic substrates) in the feedstock solution to form smaller soluble organic molecules, resulting in a rapid increase in the sCOD content. The ammonia nitrogen content in the feedstock solution did not exhibit an increasing or decreasing trend throughout the process, but fluctuated around 350 mg/L. The average concentration of acetic acid in the feedstock solution accounted for more than 70% of the total acidity, indicating that it was the primary organic acid produced in the system. The concentration of acetic acid gradually increased after the onset of fermentation and reached a maximum value at 2,528.23 mg/L on the 10th day, owing to the further fermentation of hydrolysis products from the water-insoluble organic substrates. The pH value decreased continuously during the anaerobic digestion process and was stable at approximately 6.6 after 30 days.
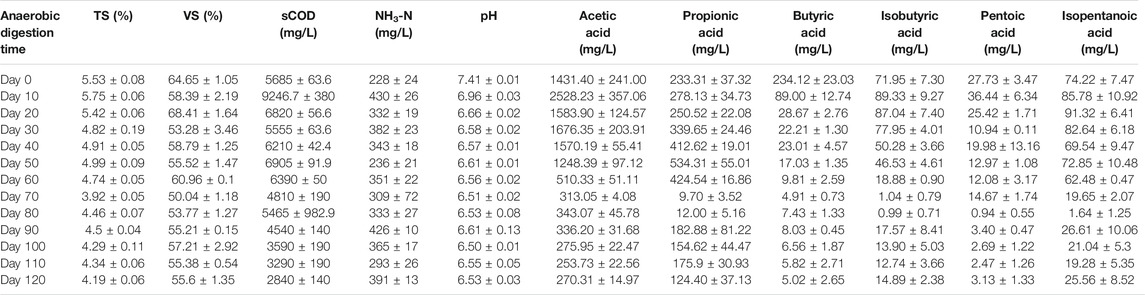
TABLE 1. Dynamic change of abiotic factors at different anaerobic digestion time.
The production of biogas, CH4, and CO2 in this anaerobic digestion system was plotted at 10 days interval for 120 days, as shown in Table 2. Within the first 70 days, three periods (Days 41–50, Days 51–60, and Days 61–70) achieved biogas production >10 L and CH4 > 5 L. Among these periods, the highest gas production occurred between Days 51–60 (13.80 L biogas, 6.48 L CH4, and 4.25 L CO2). Overall, the period from Day 41 to Day 70 of anaerobic digestion was the peak gas production period.
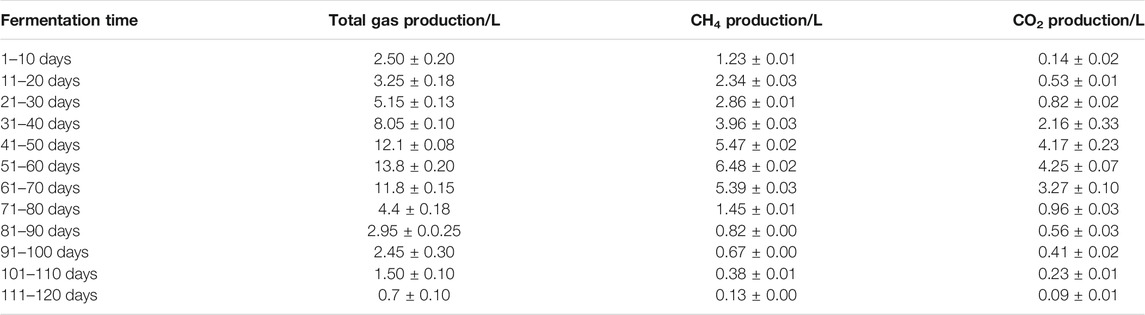
TABLE 2. Gas production per 10 days.
3.2 Bacterial Community Structure and Relative Abundance
According to the taxonomic annotation and abundance information of all samples at the OTU level, the top 35 bacterial OTUs in terms of average abundance (representative species level; Estensmo et al., 2021) were selected to examine the dynamic changes in relative abundance during anaerobic digestion, as shown Figure 2. These 35 bacterial OTUs according to their average abundance accounted for 43.11–77.28%, with 19 OTUs associated with Firmicutes, 11 OTUs with Bacteroidetes, 2 OTUs with Synergistetes, and 3 OTUs with Proteobacteria. These four bacterial taxa were involved in the hydrolysis and fermentation processes in the anaerobic digestion system, indicating the corresponding bacteria were the most dominant anaerobic digestion microorganisms in the system. After comparing the representative sequences of these 35 OTUs with known sequences and determining the strains with the highest homology, a literature review of the metabolic functions of the strains was conducted to generate a table which showed the comparison results of various species, as shown in Table 3. When a sequence shares ≥97% with that of a known strain and is the closest one to the known strain, the sequence is considered to represent a taxon with essentially the same metabolic function as the known strain. Based on this assumption, the following analysis focused on the 13 OTUs with an average relative abundance greater than 1%.
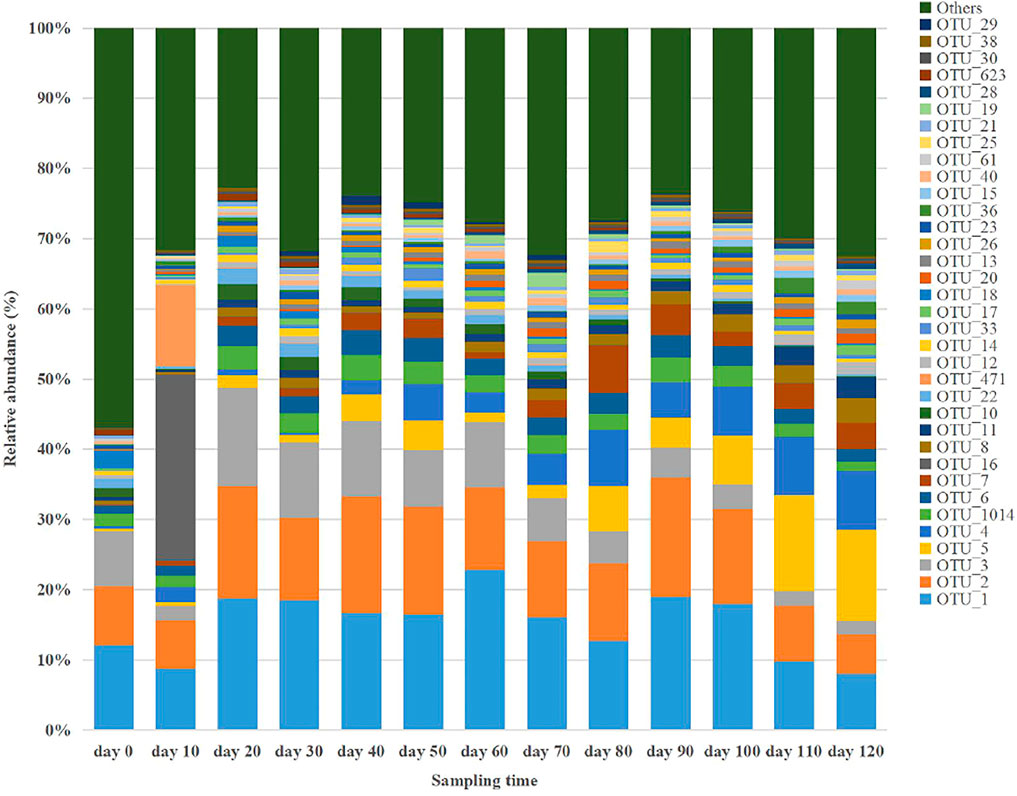
FIGURE 2. Composition of the 35 most abundant bacterial OTUs at different anaerobic digestion time.
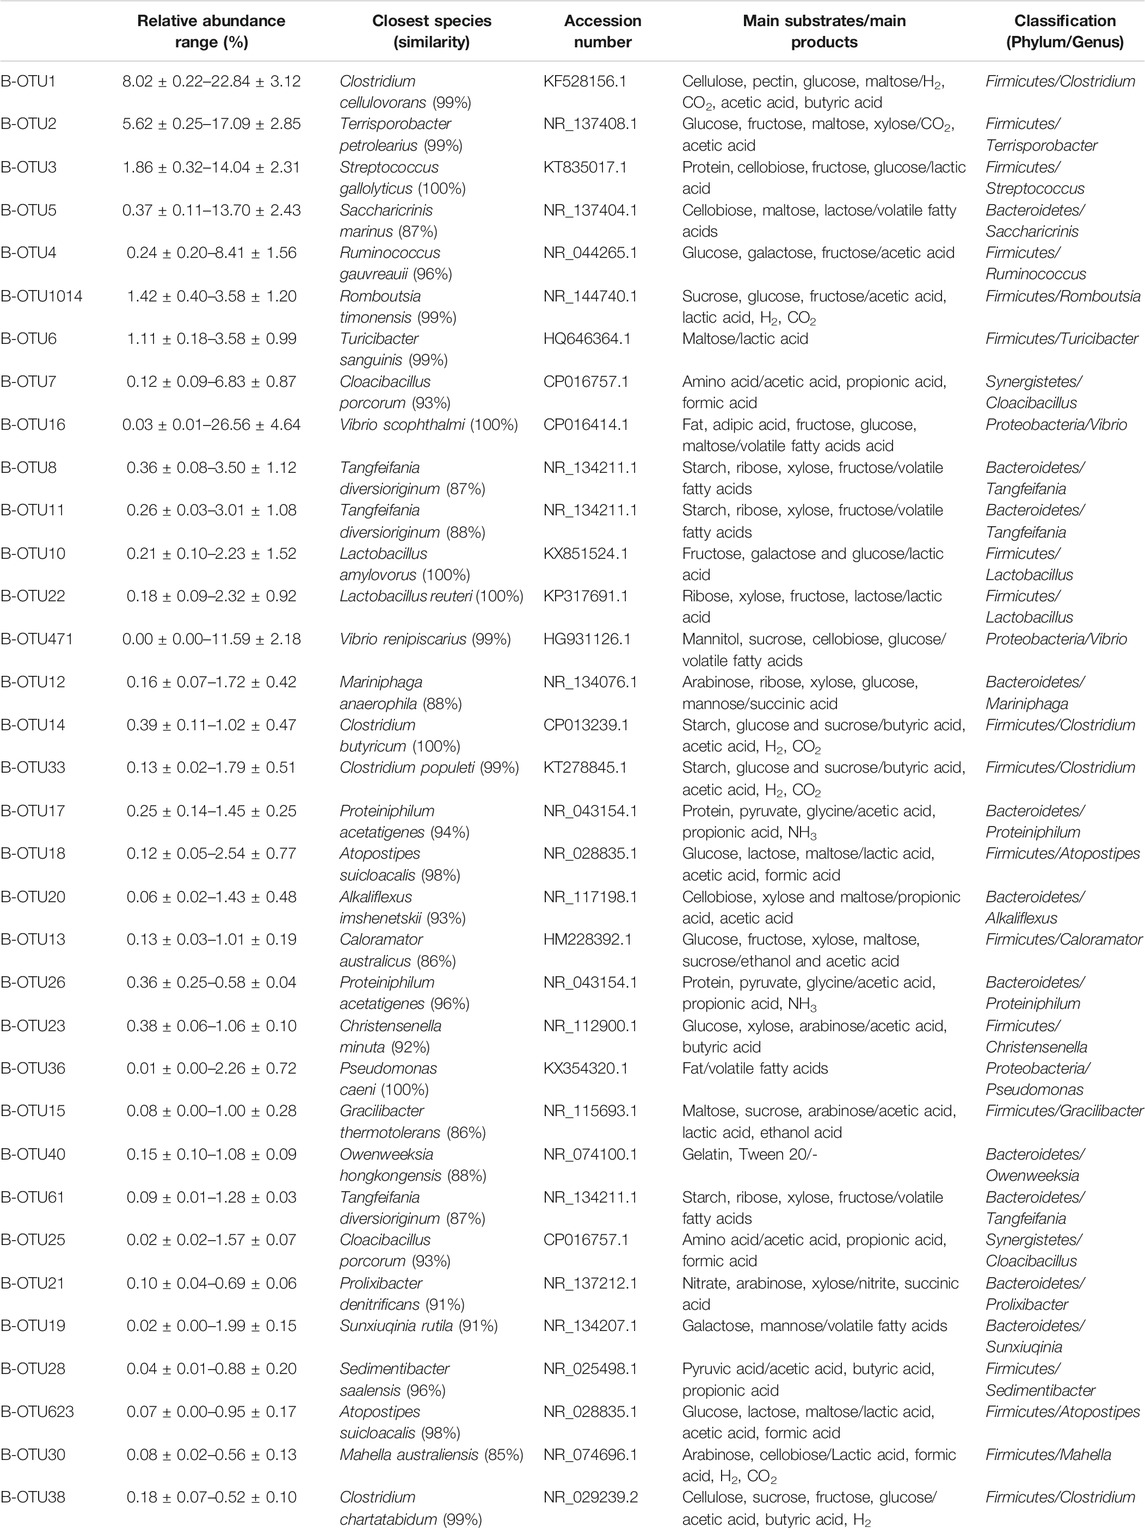
TABLE 3. The classification and function information of the most dominant 35 bacterial species.
The primarily dominant OTU was B-OTU1 (B for bacteria), with a relative abundance ranging 8.02–22.84%, with 99% similarity to Clostridium cellulovorans, a typical cellulose- and hemicellulose-degrading bacterium (Usai et al., 2020). It produces metabolites including H2, CO2, acetic acid, butyric acid, formic acid, and lactic acid (Vélez-Mercado et al., 2021), functions in both hydrolytic and fermentative processes, and it is the primary hydrogen-producing microorganism in anaerobic digestion (Uetsuki et al., 2021). The relative abundance of B-OTU1 was mostly maintained above 15% after the start of the anaerobic digestion, and it exhibited peak values twice on Days 60 and 90. The temporal dynamics of the relative abundance of B-OTU1 indicated that its abundant multiplication during the anaerobic metabolism was related to the organic substrates (rich in cellulose and hemicellulose) in the pig manure. Further, the metabolism of these organic substrates were conducted sequentially, because cellulose, hemicellulose, and pectin in the fermentation feedstock generally hydrolyze to various degrees. The easily hydrolyzed hemicellulose was degraded by Clostridium cellulovorans at a significantly faster rate than cellulose and pectin, which were less susceptible to hydrolysis.
The relative abundance of B-OTU2 ranged 5.62–17.09%. As the secondarily dominant OTU, it showed 99% similarity to Terrisporobacter petrolearius, a typical fermentative bacterium (Cabezas et al., 2020) utilizing monosaccharide substrates such as glucose, fructose, and maltose, and producing metabolites such as acetic acid and CO2 (Zhao et al., 2020). The relative abundance of B-OTU2 was generally maintained above 12% after the onset of anaerobic digestion, with three peaks occurring on the 20th, 60th, and 90th day, respectively. Other fermentative bacteria in terms of their dominant OTU included B-OTU6 (seventh), B-OTU1014 (sixth), B-OTU4 (fifth), B-OTU5 (fourth), B-OTU8 (tenth), B-OTU11 (eleventh), B-OTU10 (twelfth), and B-OTU22 (thirteenth). Nine among the top 13 OTUs with high average relative abundance were fermentative bacteria.
The relative abundance of B-OTU3 was between 1.86 and 14.04%. It was the tertiary dominant OTU, with 100% similarity to Streptococcus gallolyticus, a typical proteolytic bacterium (Aldarhami et al., 2020). The relative abundance of B-OTU4 reached peak level on Day 20, and then gradually decreased to approximately 1.86% at the end of anaerobic digestion. This species was responsible for proteolysis during the early stage and had a high growth rate; however, as the protein was used up, its metabolism gradually decreased. Similar to B-OTU3, B-OTU7 is also a proteolytic bacterium, with a relative abundance of 0.12–6.83%. It was the eighth dominant OTU, with 93% similarity to Cloacibacillus porcorum.
The relative abundance of B-OTU16 was 0.03–26.56%. As the ninth dominant OTU, it exhibited 100% similarity with Vibrio scophthalmi, a typical lipolytic bacterium in anaerobic digestion systems capable of hydrolyzing fat molecules (triglycerides) to produce fatty acids and glycerol, and further fermenting glycerol to produce propionic acid and succinic acid (Cornejo et al., 2021). The relative abundance of B-OTU16 rapidly increased after the onset of anaerobic digestion and reached the maximum level (26.56%) on Day 10, exhibiting an increase of 26.53% from the initial level. Then it rapidly decreased to 0.06% by Day 20, and thereafter remained below 0.06%, indicating active metabolism of B-OTU16 between Days 0 and 20. Lateral comparison showed that the relative abundance of B-OTU16 on Day 10 was significantly higher than that of B-OTU1, B-OTU2, and B-OTU3, indicating that the decomposition of fat was the primary process occurring around Day 10. Fats in the fermentation feedstock are organic substrates prone to hydrolysis, which can be preferentially hydrolyzed by functional microorganisms after the start of anaerobic digestion. When fats were entirely consumed, the metabolic activity of B-OTU16 decreased significantly, resulting in a rapid decrease in its relative abundance.
3.3 Archaeal Community Structure and Relative Abundance
Based on the taxonomic annotation and abundance information of the samples at the OTU level during different periods of anaerobic digestion, 10 methanogenic OTUs with an average relative abundance >0.3% were selected from the dominant archaeal phyla that were identified for BLAST comparison. These results are shown in Table 4. Figure 3 exhibits the variation of the abundance of these 10 methanogenic OTUs during the anaerobic digestion process.
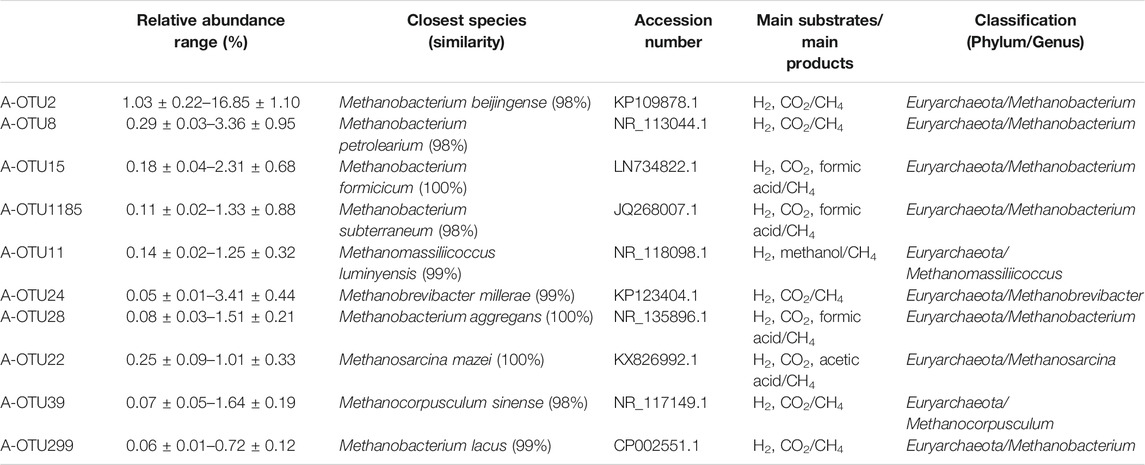
TABLE 4. The classification and function information of the most dominant 11 methanogenic archaeal species.
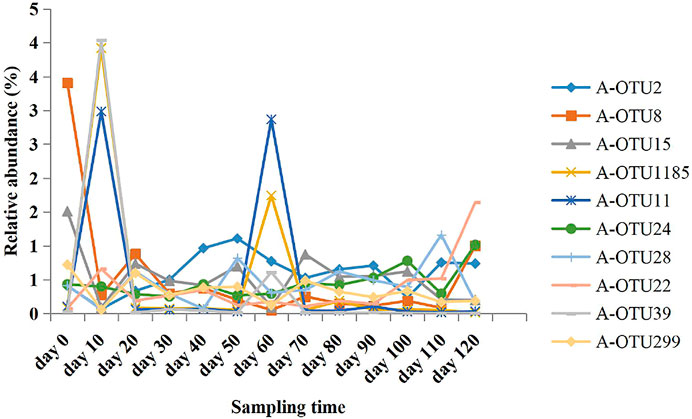
FIGURE 3. Relative abundance variation of the 10 most abundant methanogenic archaeal OTUs at different anaerobic digestion time.
As the primarily dominant methanogenic OTU, A-OTU2 had a relative abundance of 1.03–16.85%. It had 98% similarity to Methanobacterium beijingense, a typical hydrogenotrophic methanogen (Sivamani et al., 2021) that metabolized H2 and CO2 to CH4. The relative abundance of A-OTU2 peaked on the 20th, 50th, and 70th day during the anaerobic digestion (10.51, 9.96, and 11.11%, respectively), with a particularly high level on Day 70. Thereafter, it showed a gradual decrease until the end of fermentation (1.34%). The temporal dynamics of the relative abundance of A-OTU2 indicated that the hydrogenotrophic methanogenic process mainly occurred on Days 20, 50, and 70 during anaerobic digestion, that is, the early and middle stages of anaerobic digestion. This was attributed to the large amount of H2 and CO2 production in the hydrolytic fermentation stage of the anaerobic digestion, which provided direct substrates for the metabolism of A-OTU2. In addition to A-OTU2, other methanogens that were classified into the same hydrogenotrophic type, according to their dominant OTU, included A-OTU8 (second), A-OTU15 (third), A-OTU1185 (fourth), A-OTU24 (sixth), A-OTU28 (seventh), A-OTU39 (ninth), and A-OTU299 (tenth).
The relative abundance of A-OTU11 ranged from 0.14 to 1.25%. As the fifth dominant methanogenic OTU, it shared 99% similarity to Methanomassiliicoccus luminyensis, a methylotrophic methanogen (Feldewert et al., 2020) that could utilize H2 to reduce methyl groups to produce CH4. The relative abundance of A-OTU11 was high after Day 60, with no significant decreasing trend, indicating that its metabolic activity was mainly concentrated in the middle and later stages of the anaerobic digestion. It mainly relied on the hydrolytic fermentation of carbohydrates, such as hemicellulose and cellulose, to provide substrates for its metabolism.
The relative abundance of A-OTU22 was 0.25–1.01%. As the 8th dominant methanogenic OTU, it shared 100% similarity to Methanosarcina mazei, a hydrogenotrophic and acetotrophic methanogen (Wang et al., 2020). Some strains can utilize H2/CO2 for CH4 production, in addition to acetic acid. The relative abundance of A-OTU22 fluctuated after the start of anaerobic digestion, with three peaks occurring on 40th, 100th, and 120th day of fermentation. Among the four peaks, one was detected at the beginning of fermentation with A-OTU22 feeding on the substrates provided by bacterial groups during the hydrolytic fermentation stage. Moreover, two peaks occurred at the end of anaerobic digestion with the relative abundance of the highest peak exceeding 1%, which was contributed by the utilization of the hydrolysis fermentation products of cellulose by A-OTU22.
Among the 10 methanogenic OTUs with an average relative abundance >0.3%, 8 OTUs were found to be hydrogenotrophic methanogens. Comparison of these OTUs and their corresponding known methanogenic species revealed similarity ranging from 98 to 100%. They had a combined average relative abundance of 12.31%, indicating that the CH4 production in the system was mainly from CO2 reduction by H2.
3.4 Methanogenic Metabolic Pathways at OTU Levels
In terms of metabolism, the “three stages of anaerobic digestion,” (Perez et al., 2021), has been widely accepted by most researchers to elucidate the mechanism of anaerobic digestion. The CH4 metabolic pathway of anaerobic digestion at 15°C at the OTU level (i.e., species level) was constructed, as shown in Figure 4.
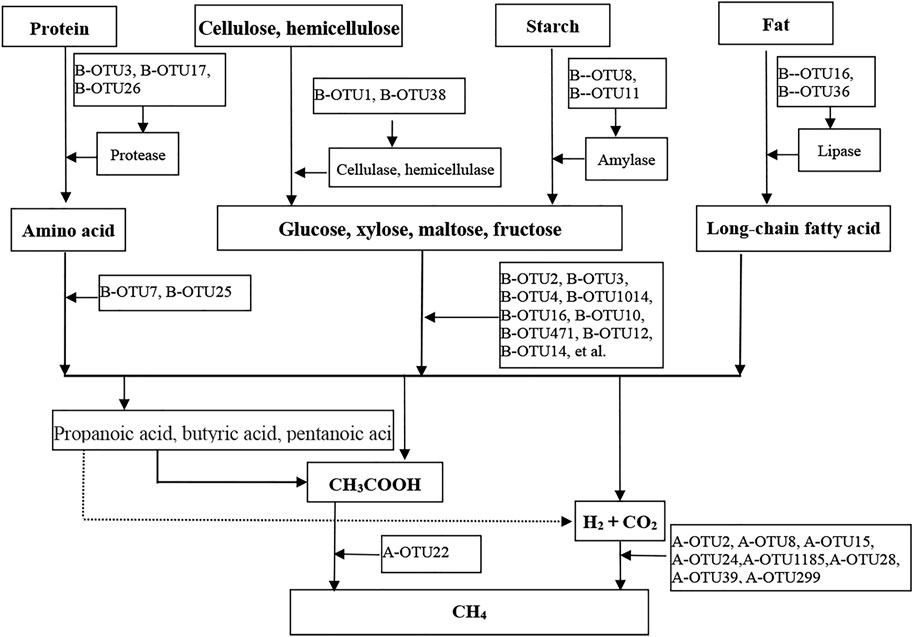
FIGURE 4. Metabolic pathways for CH4 production based dominant bacterial OTUs and methanogenic archaeal OTUs.
Stage I (i.e., hydrolysis and fermentation): During hydrolysis, a hydrolytic functional microbial group was formed comprising cellulose and hemicellulose hydrolytic bacteria such as B-OTU1 and B-OTU38, proteolytic bacteria such as B-OTU3 and B-OTU17, lipolytic bacteria B-OTU16 and B-OTU36, and starch hydrolyzing bacteria B-OTU8 and B-OTU11. These hydrolytic bacteria secreted extracellular hydrolases to hydrolyze complex organic matter (i.e., non-water-soluble carbon compounds such as carbohydrates, proteins, and lipids) to produce small-molecular organic matter (carbohydrates to soluble sugars, proteins to amino acids, and lipids to long-chain fatty acids through hydrolysis). In the fermentation stage, fermentative monosaccharide-producing acetogens such as B-OTU2 and B-OTU3, and amino acid-producing acetogens such as B-OTU7 and B-OTU25 constituted a bacterial community that produced acids and H2 through fermentation. The hydrolytic products were utilized by these fermentative bacteria to produce small-molecular fatty acids (such as acetic acid), CO2, and H2 through fermentation. Hydrolytic and fermentative bacteria were together responsible for the hydrolytic fermentation and “initiated” the methanogenic metabolic pathway, thus becoming the rate-limiting factor for anaerobic digestion.
Stage II (i.e., hydrogen- producing and acetogenic stage): Hydrogen-producing and acetogenic bacteria further converted the small-molecular fatty acids (e.g., propionic acid, butyric acid, valeric acid, lactic acid, etc.) produced in the hydrolysis and fermentation stages into acetic acid and H2, with occasional CO2 production. In this study, no bacteria of this type were identified among the top 35 bacterial OTUs with high average abundance, owing to the low relative abundance of these bacteria. It indicated that the hydrogen-production and acetogenesis were not the primary metabolic process of CH4 production by anaerobic digestion at 15°C.
Stage III (i.e., methanogenesis): Methanogens converted various metabolic substrates (mainly from the hydrolysis and fermentation stages rather than the second stage) into CH4 through different pathways, in which hydrogenotrophic methanogens such as A-OTU2 and A-OTU8 utilized H2 and CO2 to produce CH4, and acetotrophic methanogens such as A-OTU22 utilized acetic acid for CH4 production. The methanogenic group and the core anaerobic digestion microorganisms occurred at the end of the CH4 producing metabolic pathway. In this study, hydrogenotrophic methanogens accounted for the highest percentage of methanogenic microorganisms, indicating that low-temperature conditions (at 15 °C) were suitable for the growth of hydrogenotrophic methanogens, further confirming that most of the CH4 were produced from H2 and CO2.
3.5 Correlation Between Environmental Factors
A strongly significant positive correlation was found between B-OTU1 (cellulolytic bacteria specie) and the fermentative acidogenic specie B-OTU2 (c.c. 0.767**). In addition, the major methanogens A-OTU2, the hydrolyzed bacteria (B-OTU1 and B-OTU2), and the fermentative acid-producing bacteria (B-OTU3) all produced a significant or extremely significant positive correlation between each other (c.c. 0.611*, 0.634*, and 0.712**, respectively), implying the significance of the dominant hydrogenotrophic methanogen to degrade and ferment the used matrix.
4 Discussion
Many researchers have investigated the dominant bacterial groups in anaerobic digestion systems, whose results are consistent with the findings of this study. Tomita and Tamaru (2019) achieved biogenic methane production using beet pulp and citrus peel as feedstocks, respectively, with the hydrolytic bacterium Clostridium cellulovorans and methanogens as inoculum. In this study, the bacterial OTU with the highest average relative abundance, that is, B-OTU1, was 99% similar to Clostridium cellulovorans. Kumar et al. (2020) detected a high content of the fermentative bacterium Terrisporobacter petrolearius in swine manure waste, and in this study, the bacterial OTU exhibiting the second highest average relative abundance, B-OTU2, showed 99% similarity to Terrisporobacter petrolearius. Mohammadabadi et al. (2021) found the proteolytic bacteria Streptococcus gallolyticus in rumen fluid in great abundance, while the bacterial OTU with the third highest average relative abundance in our study, B-OTU3, showed 100% similarity to Streptococcus gallolyticus and could be considered as almost identical strains. Yang et al. (2019) conducted an anaerobic digestion study at 9 °C with pig manure as feedstock and reported that the most abundant bacterial species was the hydrolytic Clostridium cellulovorans, followed by the fermentative bacterium, Terrisporobacter petrolearius.
In this study, CO2 reduction by H2 was the primary pathway for CH4 production in the anaerobic digestion system under 15°C. Several studies have explored the trophic types of methanogenic group under low-temperature conditions from various perspectives and the results were generally consistent with our outcomes. Yang et al. (2019) conducted a study on anaerobic digestion of pig manure at 9°C and found that the hydrogenotrophic methanogen Methanocorpusculum sinense was the primarily dominant methanogen, with a relative abundance of 4.15–37.14%. Tian et al. (2018) studied the dominant methanogenic groups in anaerobic digestion systems at 9, 15, 21, 35, 45, and 55°C, and concluded that almost all methane was produced through CO2 reduction by H2 at low temperatures of 9°C and 15°C. Zhang et al. (2020) conducted anaerobic digestion using municipal wastewater as feedstock under low-temperature conditions (16.5 ± 2.0°C) and reported that hydrogenotrophic methanogens of the genus Methanobacterium had the highest abundance. Under low-temperature conditions, CH4 in anaerobic digestion was mainly derived from the metabolism of hydrogenotropic methanogens. A reason for this phenomenon was that hydrogenotropic methanogens were more capable of adapting to cold environments (Zhang et al., 2021). Furthermore, the process was related to the relatively low energy required by the hydrogenotropic methanogenic pathway at low temperatures. Lettinga et al. (2001) evaluated the Gibbs free energies of the major biochemical reactions in the anaerobic digestion process at a moderate temperature of 37°C and a low temperature of 10°C. They found that the Gibbs free energy of the hydrogenotrophic methanogenic pathway was −140.9 kJ at 10°C, and −131.3 KJ at 37°C, which was closely related to the relatively high solubility of H2 and CO2 in the fermentation feedstock solution at low temperatures (improving the availability of H2 and CO2 to methanogens). For example, one unit volume of water at standard atmospheric pressure can dissolve approximately 1.2 units of CO2 by volume at 10°C, while at 35°C only approximately 0.6 unit volume of CO2 is dissolved. The Gibbs free energy of the acetotrophic methanogenic pathway at low temperature of 10°C was −29.2 kJ. The increase in the viscosity of liquid owing to low temperature reduced the diffusion coefficient of soluble compounds such as acetic acid. For example, the diffusion coefficient of acetic acid is 1.26 at 40°C and 0.57 at 10°C. Therefore, Lettinga et al. confirmed that based on thermodynamics, compared with the acetotrophic route, the hydrogenotropic route was the preferred pathway for methane production at low temperatures.
5 Conclusion
The three-stage CH4 production metabolic pathway at the OTU level showed that CH4 production at low temperatures mainly occurred via hydrogenotrophic methanogens of the genus Methanobacterium, such as Methanobacterium beijingense and Methanobacterium petrolearium, and the metabolic substrates (H2/CO2) were primarily from the hydrolysis and fermentation stage instead of the hydrogen-producing and acetogenesis stages. In addition, the anaerobic digestion process under low-temperature conditions generally occurred through two stages, that is, the hydrolysis and fermentation stage and the methanogenic stage, which is in contrast to the traditional three-stage theory. This revealed that all CH4-producing metabolic processes in various anaerobic digestion systems do not consist of three stages, and the three stages do not always occur in a sequential order.
Data Availability Statement
1) The data presented in the study are deposited in the GenBank repository, accession number OL906058-OL906092 and OL906101-OL906110. 2) The entire sequence have been released on Dec 23, 2021.
Author Contributions
BY and WZ contributed to conception and design of the study. CW and XZ performed the statistical analysis. BY, JL, FY, and WZ wrote sections of the article. All authors contributed to article revision, read, and approved the submitted version.
Funding
The authors thank the following funding providers for their generous grant funding: the National Natural Science Foundation of China (Grant number 51366015); the Yunnan Provincial Key Fund of Applied Basic Research (Grant number 2014FA030); the Yunnan Provincial Special Commissioner for Science and Technology (Grant number 2015IA022); the Major Science and Technology Project of New Energy in Yunnan (Grant number 2015ZB001 and 2015ZB005); Collaborative Innovation Center of Research and Development of Renewable Energy in the Southwest Area (Grant number 05300205020516009); the Doctoral Research Initiation Program of Yunnan Normal University (Grant number 2017ZB019); Basic Research Program of Yunnan Province (Grant number 2019FB074); Science and Technology Plan Project of Yunnan Province (Grant number 202001AT070094); and the Fund of Yunnan Provincial Key Laboratory of Rural Energy Engineering (grant number 2017KF03).
Conflict of Interest
The authors declare that the research was conducted in the absence of any commercial or financial relationships that could be construed as a potential conflict of interest.
Publisher’s Note
All claims expressed in this article are solely those of the authors and do not necessarily represent those of their affiliated organizations, or those of the publisher, the editors and the reviewers. Any product that may be evaluated in this article, or claim that may be made by its manufacturer, is not guaranteed or endorsed by the publisher.
Acknowledgments
We would like to thank Editage (www.editage.cn) for English language editing.
References
Aldarhami, A., Felek, A., Sharma, V., and Upton, M. (2020). Purification and Characterization of Nisin P Produced by a Strain of Streptococcus Gallolyticus. Streptococcus J. Med. Microbiol. 69 (4), 605–616. doi:10.1099/jmm.0.001170
An, Q., Cheng, J.-R., Wang, Y.-T., and Zhu, M.-J. (2020). Performance and Energy Recovery of Single and Two Stage Biogas Production from Paper Sludge: Clostridium Thermocellum Augmentation and Microbial Community Analysis. Renew. Energ. 148, 214–222. doi:10.1016/j.renene.2019.11.142
Basile, A., Campanaro, S., Kovalovszki, A., Zampieri, G., Rossi, A., Angelidaki, I., et al. (2020). Revealing Metabolic Mechanisms of Interaction in the Anaerobic Digestion Microbiome by Flux Balance Analysis. Metab. Eng. 62, 138–149. doi:10.1016/j.ymben.2020.08.013
Cabezas, A., Bovio, P., and Etchebehere, C. (2020). Commercial Formulation Amendment Transiently Affects the Microbial Composition but Not the Biogas Production of a Full Scale Methanogenic UASB Reactor. Environ. Tech. 41 (24), 3119–3133. doi:10.1080/09593330.2019.1600042
Campanaro, S., Treu, L., Kougias, P. G., Zhu, X., and Angelidaki, I. (2018). Taxonomy of Anaerobic Digestion Microbiome Reveals Biases Associated with the Applied High Throughput Sequencing Strategies. Sci. Rep. 8 (1), 1–12. doi:10.1038/s41598-018-20414-0
Sirvas Cornejo, S., Buleje, V., Salvatierra, L., and Jaramillo, M. L. (2021). Isolation and Identification of Proteolytic, Amylolytic, Lipolytic, and Chitinolytic Bacteria from Shrimp Waste. Rev. Peru Biol. 28 (1), e18353. doi:10.15381/rpb.v28i1.18353
Estensmo, E. L. F., Maurice, S., Morgado, L., Martin‐Sanchez, P. M., Skrede, I., and Kauserud, H. (2021). The Influence of Intraspecific Sequence Variation during DNA Metabarcoding: a Case Study of Eleven Fungal Species. Mol. Ecol. Resour. 21 (4), 1141–1148. doi:10.1111/1755-0998.13329
Feldewert, C., Lang, K., and Brune, A. (2020). The Hydrogen Threshold of Obligately Methyl-Reducing Methanogens. FEMS Microbiol. Lett. 367 (17), fnaa137. doi:10.1093/femsle/fnaa137
Fones, E. M., Colman, D. R., Kraus, E. A., Stepanauskas, R., Templeton, A. S., Spear, J. R., et al. (2021). Diversification of Methanogens into Hyperalkaline Serpentinizing Environments through Adaptations to Minimize Oxidant Limitation. Isme J. 15 (4), 1121–1135. doi:10.1038/s41396-020-00838-1
Fransiscus, Y., and Simangunsong, T. L. (2021). Anaerobic Digestion of Industrial Tempeh Wastewater with Sludge from Cow Manure Biogas Digester as Inoculum: Effect of F/M Ratio on the Methane Production. Int. J. Adv. Sci. Eng. Inf. Tech. 11 (3), 1007–1013. doi:10.18517/ijaseit.11.3.11846
Kumar, H., Jang, Y., Kim, K., Park, J., Jung, M., and Park, J.-E. (2020). Compositional and Functional Characteristics of Swine Slurry Microbes through 16S rRNA Metagenomic Sequencing Approach. Animals 10 (8), 1372. doi:10.3390/ani10081372
Lettinga, G., Rebac, S., and Zeeman, G. (2001). Challenge of Psychrophilic Anaerobic Wastewater Treatment. Trends. Biotechnol. 19 (9), 363–370. doi:10.1016/s0167-7799(01)01701-2
Mohammadabadi, T., Chaji, M., Direkvandi, E., and Alqaisi, O. (2021). Effect of Replacing Alfalfa hay with Leucaena Leucocephala (L. Leucocephala) Leaves on In Vitro Gas Production, Digestibility and In Situ Degradability in buffalo. Acta Sci. Anim. Sci. 43 (1), e52129. doi:10.4025/actascianimsci.v43i1.52129
Perez, C., Lors, C., Floquet, P., and Erable, B. (2021). Biodeterioration Kinetics and Microbial Community Organization on Surface of Cementitious Materials Exposed to Anaerobic Digestion Conditions. J. Environ. Chem. Eng. 9 (4), 105334. doi:10.1016/j.jece.2021.105334
Sakurai, R., Takizawa, S., Fukuda, Y., and Tada, C. (2021). Exploration of Microbial Communities Contributing to Effective Methane Production from Scum under Anaerobic Digestion. PloS one 16 (9), e0257651. doi:10.1371/journal.pone.0257651
Sivamani, S., Saikat, B., Naveen Prasad, B. S., Baalawy, A. A. S., and Al-Mashali, S. M. A. (2021). “A Comprehensive Review on Microbial Technology for Biogas Production,” in Bioenergy Research: Revisiting Latest Development. Clean Energy Production Technologies. Editors M. Srivastava, N. Srivastava, and R. Singh (Singapore: Springer), 53–78. doi:10.1007/978-981-33-4615-4_3
Tamisier, M., Schmidt, M., Vogt, C., Kümmel, S., Stryhanyuk, H., Musat, N., et al. (2021). Iron Corrosion by Methanogenic Archaea Characterized by Stable Isotope Effects and Crust Mineralogy. Environ. Microbiol. doi:10.1111/1462-2920.15658
Tian, G., Yang, B., Dong, M., Zhu, R., Yin, F., Zhao, X., et al. (2018). The Effect of Temperature on the Microbial Communities of Peak Biogas Production in Batch Biogas Reactors. Renew. Energ. 123, 15–25. doi:10.1016/j.renene.2018.01.119
Tomita, H., and Tamaru, Y. (2019). The Second-Generation Biomethane from Mandarin orange Peel under Cocultivation with Methanogens and the Armed Clostridium Cellulovorans. Fermentation 5 (4), 95. doi:10.3390/fermentation5040095
Uetsuki, K., Kawashima, H., Ohno, E., Ishikawa, T., Iida, T., Yamamoto, K., et al. (2021). Measurement of Fasting Breath Hydrogen Concentration as a Simple Diagnostic Method for Pancreatic Exocrine Insufficiency. BMC Gastroenterol. 21 (1), 211–219. doi:10.1186/s12876-021-01776-8
Usai, G., Cirrincione, S., Re, A., Manfredi, M., Pagnani, A., Pessione, E., et al. (2020). Clostridium Cellulovorans Metabolism of Cellulose as Studied by Comparative Proteomic Approach. J. Proteomics 216, 103667. doi:10.1016/j.jprot.2020.103667
Vélez-Mercado, M. I., Talavera-Caro, A. G., Escobedo-Uribe, K. M., Sánchez-Muñoz, S., Luévanos-Escareño, M. P., Hernández-Terán, F., et al. (2021). Bioconversion of Lignocellulosic Biomass into Value Added Products under Anaerobic Conditions: Insight into Proteomic Studies. Int. J. Mol. Sci. 22 (22), 12249.
Verma, P. V., Vasudevan, V., Kashyap, B. K., Samsudeen, T. I., Meghvansi, M. K., Kamboj, D. V., et al. (2018). Direct Lysis Glass Milk Method of Genomic Dna Extraction Reveals Greater Archaeal Diversity in Anaerobic Biodigester Slurry as Assessed through Denaturing Gradient Gel Electrophoresis. Jebas 6 (2), 315–323. doi:10.18006/2018.6(2).315.323
Wang, H., Byrne, J. M., Liu, P., Liu, J., Dong, X., and Lu, Y. (2020). Redox Cycling of Fe (II) and Fe(III) in Magnetite Accelerates Aceticlastic Methanogenesis by Methanosarcina Mazei. Environ. Microbiol. Rep. 12 (1), 97–109. doi:10.1111/1758-2229.12819
Yang, B., Yin, F., Wang, C., Zhao, X., Liu, J., Wu, K., et al. (2019). Construction of Biogas Metabolic Pathway in a Low‐temperature Biogas Fermentation System. Energy Sci Eng 7 (6), 3160–3173. doi:10.1002/ese3.488
Zhang, Y., Guo, B., Zhang, L., and Liu, Y. (2020). Key Syntrophic Partnerships Identified in a Granular Activated Carbon Amended UASB Treating Municipal Sewage under Low Temperature Conditions. Bioresour. Tech. 312, 123556. doi:10.1016/j.biortech.2020.123556
Zhang, L., Zhang, Y., Yuan, Y., Mou, A., Park, S., and Liu, Y. (2021). Impacts of Granular Activated Carbon Addition on Anaerobic Granulation in blackwater Treatment. Environ. Res., 112406. doi:10.1016/j.envres.2021.112406
Keywords: low-temperature, anaerobic digestion, operational taxonomic unit, bacterial communities, methanogens
Citation: Yang B, Wang C, Zhao X, Liu J, Yin F and Zhang W (2022) Determining the Microbial Source of Methane Production in Anaerobic Digestion Systems Through High-Throughput Sequencing Technology. Front. Energy Res. 9:827969. doi: 10.3389/fenrg.2021.827969
Received: 02 December 2021; Accepted: 15 December 2021;
Published: 12 January 2022.
Edited by:
Marcin Debowski, University of Warmia and Mazury in Olsztyn, PolandReviewed by:
Joanna Kazimierowicz, Bialystok University of Technology, PolandMarcin Zieliński, University of Warmia and Mazury in Olsztyn, Poland
Copyright © 2022 Yang, Wang, Zhao, Liu, Yin and Zhang. This is an open-access article distributed under the terms of the Creative Commons Attribution License (CC BY). The use, distribution or reproduction in other forums is permitted, provided the original author(s) and the copyright owner(s) are credited and that the original publication in this journal is cited, in accordance with accepted academic practice. No use, distribution or reproduction is permitted which does not comply with these terms.
*Correspondence: Wudi Zhang, d29vdGljaGFuZ0AxNjMuY29t