 Chao Ning
 Yalin Li1*
95% of researchers rate our articles as excellent or good
Learn more about the work of our research integrity team to safeguard the quality of each article we publish.
Find out more
ORIGINAL RESEARCH article
Front. Energy Res. , 11 January 2022
Sec. Process and Energy Systems Engineering
Volume 9 - 2021 | https://doi.org/10.3389/fenrg.2021.825159
This article is part of the Research Topic Design, Simulation and Optimization of Hydraulic Machinery View all 25 articles
The interaction between impeller and volute produces a complex and unsteady water flow. It involves the interference of the non-uniform flow (such as the impeller’s jet wake and a secondary flow). In this paper, the transient flow in a new type of dishwasher pump is investigated numerically. In addition, pressure measurements are used to validate the numerical method, and the simulation results agree well with the experiment. Three schemes, 0 rpm (revolutions per minute)/30 rpm/60 rpm, of volute speeds are investigated. Multiple monitoring points are set at different positions of the new dishwasher pump to record pressure-pulse signals. In addition, frequency signals are obtained using a Fast Fourier Transform, which is then used to analyze the effect of the volute tongue and the outflow of the impeller. The radial force on the principal axis is recorded, and the schemes with different rotation speeds of volute are compared. The results show that the volute speed has only a small effect on the pump performance. In addition, the speed of the volute mainly affects the flow field in the transition section located between impeller and volute. The difference of the flow field in the impeller depends on the relative position between the impeller and the volute. The time domain curve for the pressure pulse is periodic, and there is a deviation between the peak for the schemes in the outflow region. In the frequency domain, the characteristic frequency equals the blade passing frequency. In the outflow region, the effect of the volute speeds increases with increasing volute speed. For the radial force, the rotating volute strengthens the fluctuation of the radial force, which affects the operational stability of the pump. The shape of the vector distribution is most regular for the 30 rpm scheme, which indicates that the stability of the pump is the highest. This paper can be used to improve both the control and selection of volute speeds.
Electric dishwashers are commonly used in private households as well as commercially. Unfortunately, due to their relatively complex pipe-systems, conventional dishwashers can easily accumulate dirt and often suffer from substantial flow-reduction speeds and poor spray-power. Therefore, the removal of the pipeline (to enable an effective cleaning-function) is an important development goal. Nowadays, the application of computational fluid dynamics (CFD) is commonly used to study and improve dishwashers. Researchers have already carried out several detailed and systematic studies of the key parts of dishwashers (Dedoussis and Giannatsis, 2004; Santori et al., 2013; Pérez-Mohedano et al., 2015; Minde, 2016; Pérez-Mohedano et al., 2017), and their results indicate that the water-movement analysis plays a very important role in performance studies. The new type of dishwasher pump, which is described in this paper, uses an open cleaning concept to enable cleaning without pipelines in the water tank. As shown in Figure 1, the impeller is made of a special composite structure without noticeable front and rear cover-plates, and the volute is a single volute with a long tongue within a 180° array to form twin volute. The pump outlet consists of nozzles that are arranged at different positions and directions on the volute. Driven by the rotating impeller, the fluid flows into the volute and generates a speed torque that causes the volute to rotate. Thanks to the combination of volute flow channel with pipeline spray, the cleaning system has no pipeline, which shortens the cleaning time and saves both water and electricity.

FIGURE 1. Physical model of new type dishwater pump.
Due to movement between impeller and volute, the outflow of the impeller interacts with the flow in the volute. The unsteady interaction between these components generates pressure pulses, which create unsteady dynamic forces. These unsteady dynamic forces give rise to vibration of the pump components and generate hydraulic noise (Majidi, 2005; Zhou et al., 2021; Zhu et al., 2021). The interaction between these components produces a complex unsteady flow, which involves the interference of non-uniform flow (such as impeller jet wake) with a secondary flow. The dynamic pulses have a strong impact on the internal flow loss as well as operational stability. Many studies focused on the dynamic pulses in pumps (Long et al., 2020; Peng et al., 20212021; Ye et al., 2021; Zhang et al., 2021). Barrio et al. (2008) studied the dynamic pulse mechanism by varying the radial gap of the tongue. Their results show that the gap reduction led to greater pressure-increments. Chen et al. (Chu et al., 1995) investigated the effect of a thick blade on the matching performance of impeller and volute. The group found that the pressure depends on the orientation between the impeller and the tongue. Li et al. (Spence and Amaral-Teixeira, 2008) tested the flow between impeller and volute of a centrifugal pump with large outlet angle. Spence et al. (Spence and Amaral-Teixeira, 2009) analyzed the effect of dynamic pulses on the overall performance using several geometric parameters for the impeller. The cutwater gap and vane arrangement were found to exert the biggest effect. Liu et al. (Liu et al., 2012) used a large-eddy simulation to investigate the effect of the impeller type on the pressure-pulse mechanism of a double suction pump. They found that a staggered arrangement of impellers helped improve the pressure fluctuation for the volute. Solis et al. (2009) changed the clearance between impeller and volute by changing the angle of the tongue, and a k-ω SST model was used to study the dynamic pulse mechanism. Zhu et al. (2011a) conducted a study of the dynamic pulse mechanism by changing the diameter of the volute’s base circle and the clearance between impeller and tongue. Guo et al. (Guo and Okamoto, 2003) and González et al. (2003) analyzed the effect of the throat area on the performance and internal flow of a centrifugal pump. This was done by changing the tongue type and the tongue angle. Then, Zhu et al. (2011b) compared the effect of different types of tongues on the dynamic pulses of the pump. Their results show that the pressure fluctuation and the radial forces decrease when middle- and short-tongues were used. Choi (2008) studied the dynamic pulses flow field for an annular volute, a spiral volute, and different types of diffusers using Particle Image Velocimetry (PIV), and they analyzed the vortex and secondary flow that occurs within the impeller passage. Yang et al. (2009) studied the dynamic pulse mechanism in a double volute pump and found that the radial force on the impeller was unsteady—especially at small flow rates.
The above articles help better understand and improve the pulsation mechanism in pumps. However, the blade type of the impeller in these studies was mostly the backward-bending type (Shi et al., 2020; Wang et al., 2021), and there are no relevant studies of the compound impeller at present. Moreover, they mainly focused on the angle of the tongue, the tongue type, and the volute profile in the aspect of the volute. However, the tongue and outlet of the double volute were still one, and the structure of a twin volute is clearly different from a double volute. According to Zheng et al. (2015), the interference between the outflow of impeller and volute is more significant due to increasing number of tongues (in the case of multi-tongue or multi-channel systems). Therefore, the dynamic pulsation of a twin volute should be stronger, theoretically.
In this paper, 3D unsteady numerical simulations were performed to study the secondary flow development (which is due to the interaction between impeller and volute). A change in the circumferential relative positions of impeller and volute is expected to have a clear impact on the fluid. In addition, the upstream- and downstream-flows are affected due to interference with the flow. To reveal both the interference effect of the twin volute and the effect of different volute speeds on the internal flow of the new dishwasher pump, the detailed flow-patterns and radial velocities (for the volute cross-section) were determined via the numerical simulation. In addition, the pressure fluctuation in the tongue region and the outflow of impeller were measured to clarify the effect of volute speed. Finally, the laws for the radial force at different volute speeds were analyzed. The study was organized as follows: The numerical model and setup are clarified in Numerical Model and Simulation Setup. Experimental Setup describes the experimental detection method, and the effect of volute rotation speed is analyzed in Results and Discussion. Conclusions are summarized in Conclusion.
Figure 2 shows the computational domains, which consist of suction pipe, impeller, and volute. The complex impeller consists of an axial flow cascade at the bottom, and a centrifugal blade at the top. The key parameters and corresponding target parameters for this pump are listed in Table 1.
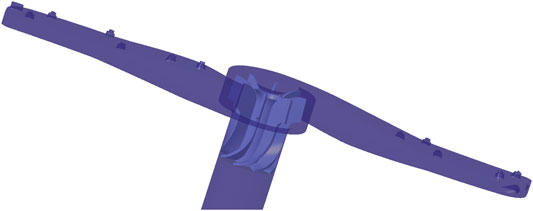
FIGURE 2. Computational domains of the new type dishwater pump.
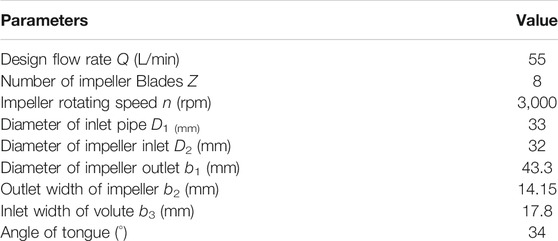
TABLE 1. Parameters and corresponding design values.
A clearance of 0.5 mm was set between the axial flow cascade and the end wall at the axial part of the compound impeller. The inlet was simplified to a straight pipe, and the diameter of the end wall D3 was equal to the inlet pipe diameter D2.
The commercial finite-volume solver ANSYS Fluent 19.0 was used to simulate the incompressible flow for the new dishwasher pump. The continuity equation was solved using the k-ω based Shear-Stress-Transport (SST) model published by Menter (Menter, 1994) because it can accurately predict the flow pattern near wall-regions. The turbulence model was used as a closure for the Reynolds-averaged Navier-Stokes solver to enable a more-accurate prediction of flow separation. The transport equations for the turbulent kinetic energy and the specific dissipation rate were given by Eqs 1, 2:
In the above equations, ω represents the specific dissipation rate, Dω was the cross-diffusion term, Gk and Gω represent the generation of the turbulence variables k and ω, while Yk and Yω represent the dissipation of the turbulence variables k and ω, respectively. The effective diffusivities Γk and Γω are given by:
Here, σk and σω are the turbulent Prandtl numbers for k and ω. μt denotes the turbulent viscosity.
To discretize the whole computation domain, a structured hexahedral mesh was generated for the impeller domain using the software ANSYS ICEM. Figure 3A shows the computational domain grids. The impeller domain was used using the J/O method, when the topological structure was selected. For the periodic structure of the impeller, the grid could be generated via circumference duplication according to the number of blades, and the mesh near the blade surface was well (locally) refined—see Figure 3B. Because of the small tip-clearance in the impeller, the grid was more refined within that region—see Figure 3C, D.
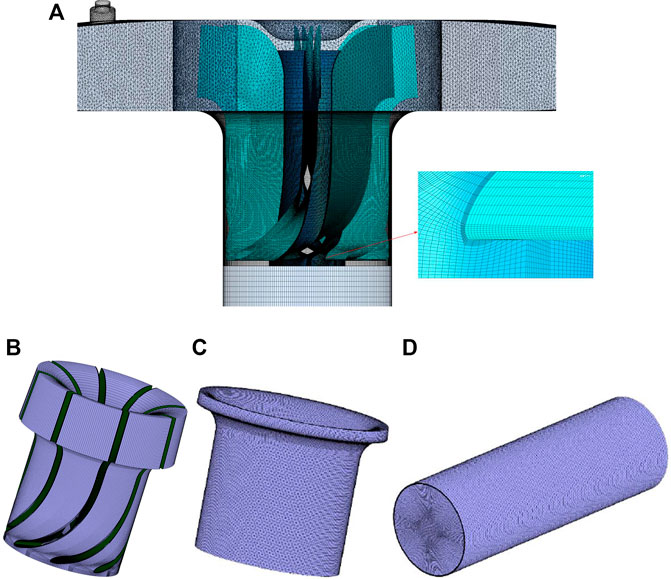
FIGURE 3. Mesh of the new type dishwater pump (A) Computational zone (B) Mesh of impeller (C) Mesh of tip (D) Mesh of inlet pipe.
To ensure that the calculation result was not affected by the mesh density, three sets of meshes were selected. Moreover, a grid-independence test was carried out, and the difference for the predicted head between Mesh 2 and Mesh 3 was less than 1%. The ultimate optimal grid, with 1,203 million cells (Mesh 3), was checked thoroughly. The results were shown in Table 2.
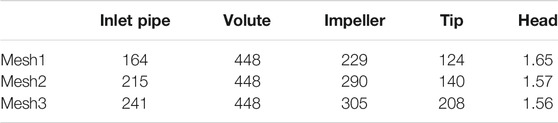
TABLE 2. Mesh independence.
In Fluent, the turbulent kinetic energy k and turbulent dissipation rate ω were 1.0 and 1.3 respectively. The four fluid-domains were connected by pairs of interfaces, and all walls were set as no-slip boundary condition to be consistent with a viscous fluid. The water temperature was 25°C. To analyze the internal flow-fields, a transient simulation was conducted which was initialized using the steady results. As for boundary conditions, the mass flow rate inlet boundary-condition was used at the pump inlet, and the pressure outlet was set at the distal cross section of outlet all the time. For the transient simulation, the SIMPLEC algorithm was chosen to deal with velocity–pressure coupling. Furthermore, a second-order upwind scheme was used for the discretization of the convection terms of momentum, turbulent kinetic energy, and the turbulent dissipation rate equations. A second-order implicit scheme was used for transient formulation. The boundary conditions were the same as for the steady simulation. The solution accuracy was set to second order, the residual convergence accuracy of the scheme was 10−4. In addition, the time step in the calculation was set to 2.22 × 10⁻⁴ according to the impeller’s rotating period T, which was equal to 1/90 T.
To compare the pressure fluctuation between the numerical and the test results, a pressure pulse monitoring point P was set inside the volute—see Figure 4. The monitoring point was at the same position as in the prototype test. Considering the rotation of the spray arm in the test, a set of pressure-pulsation test devices, which can rotate with the spray arm, was designed. The sensor was installed on the cover of the test-bed and fastened on the test-bed with bolts. At this time, it was ensured that the sensor was suspended above the volute, and we placed the probe of the sensor in the preset installation hole of the volute. The line was connected to the connecting groove to ensure that the sensor probe can rotate with the volute. This test device could effectively avoid the problem of wire-winding during the rotation of the spray arm and ensure normal operation. A sampling frequency of 10 kHz was used to collect the data, and the measuring accuracy of the pressure sensors was 0.2%.
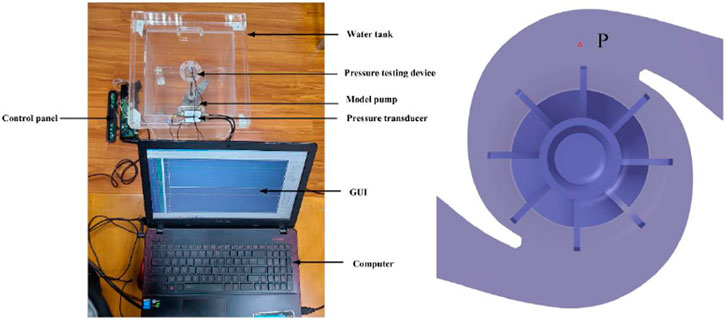
FIGURE 4. Pressure measurements system setup and position of monitoring point P.
Comparisons of the amplitude between CFD and experimental data at the monitoring point P under the rated conditions are shown in Figure 5. The transient pressure was processed using a fast Fourier transform (FFT). Based on the impeller speed, the shaft frequency fN = n/60 = 50 Hz and the blade passing frequency fBPF = Z×fN = 400 Hz. This result is in good agreement with the experiment which verifies the accuracy of the numerical simulation. Both the experimental and the numerical dominant frequencies of pressure fluctuation at the monitoring point were 1 times the blade passing frequency. Compared with the experimental results, the amplitude of the dominant frequency in numerical simulation was higher. The experimentally obtained amplitudes for the two- and three-times blade-frequency components were higher than the numerical results. Interestingly, there were more high frequencies in the experimental results. The difference between measurement and simulation may be because of environmental factors that affected the measurements but were not considered in the numerical simulation.
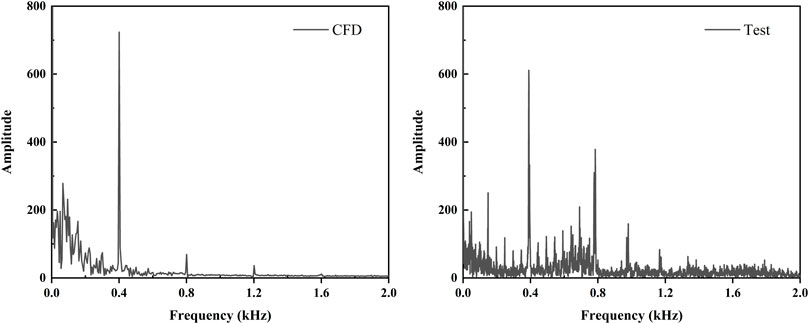
FIGURE 5. Frequency domain diagram of pressure fluctuation obtained from the numerical simulation and test at the monitoring point P under rated conditions.
Because the new dishwasher pump had no pipeline, its head was difficult to measure. The numerical simulation was carried out under several different conditions. The volute speeds were set to 0, 30, and 60 rpm. The main hydraulic performance curves were calculated, including head, and efficiency.
The performance of the pump was characterized by the head rise, H, and the efficiency,
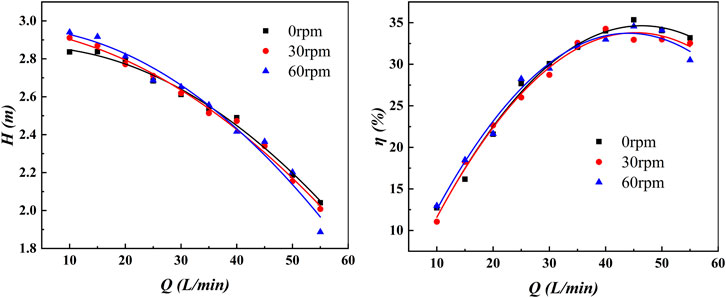
FIGURE 6. Performance curves
At the flow rate of 55 L/min, the speed of the impeller was 3,000 rpm. Hence, the impeller rotation period T = 0.02 s. After the impeller rotated for 20 cycles, the volute of the 30 rpm scheme rotated 72°, and the volute of 60 rpm scheme rotated 144°. Figure 7 shows the time-averaged velocity distribution for different rotation speeds at the same time. It can be seen that the time-averaged velocity distribution for each channel was basically the same within a rotation cycle. This indicates that the flow law for each channel was the same, and the velocity in the volute also reveals the characteristics of axial symmetry. Compared to different rotation speed schemes, the distribution of time-averaged velocity inside the impeller shows the same law, and the same distribution law is valid for the tongue part. However, with increasing rotation speed of the volute, the transition of the flow field in the transition section between the impeller and the volute becomes smoother. This indicates that the rotation of the volute has a significant effect on the interference between the impeller and the volute.
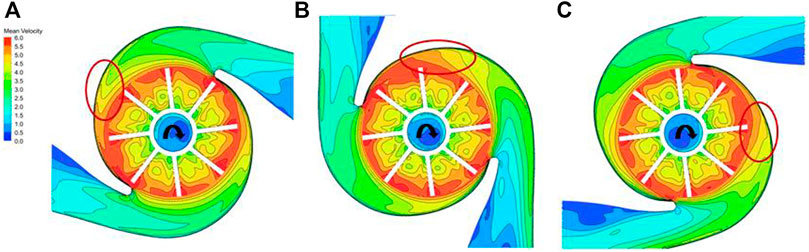
FIGURE 7. Time average velocity distribution of different volute rotating speeds at the same time (A) 0 rpm (B) 30 rpm (C) 60 rpm.
The vector diagram of the different volute speeds (at the same time) is shown in Figure 8. It can be seen that the velocity distribution for schemes with different volute speeds is basically the same in the flow channel when they are not passing the tongue. This also shows that the speed of the volute does not affect the velocity distribution in the impeller but the position of the tongue was the main factor that determined the velocity distribution in the impeller. A reflux phenomenon at the tongue region can be clearly seen in Figure 8. In each flow channel, the velocity vector opposite to the mainstream direction also appears (mostly at the pressure surface of the blade close to the hub), which is also consistent with the position of the vortex generation.
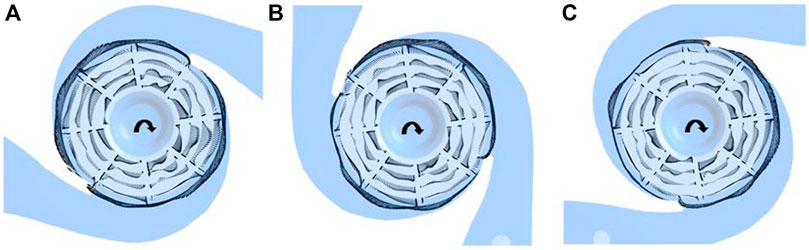
FIGURE 8. Vector diagram of different volute rotating speeds at the same time (A) 0 rpm (B) 30 rpm (C) 60 rpm.
To investigate the flow development under the effect of the tongue, the detailed velocity profiles of the 0 rpm scheme were selected. In this way it becomes possible to explain the interaction between impeller and volute. Because the twin volute was formed by a single volute with a long tongue using a 180° array, only half of the flow field need to be studied instead of all flow channels. Figure 9 shows the streamline and distribution of the radial velocity for the central cross-section of the volute. As shown in Figure 9A, four channels are shown and the tongue is located at channel 3. The rotation of the impeller occurred in the clockwise direction. The three moments of the 21st cycle of the impeller were recorded as T1, T2, and T3 respectively. The following relations are valid: T1 = T, T2 = T1+1/15T and T3 = T1+2/15T. The streamline of the impeller is shown in Figure 9B, and the radial velocity of the impeller was subtracted from the local fluid velocities to obtain their relative component, see Figure 9C. There were two main vortex structures at the central plane, vortices A and B. Vortex A was a passage vortex near the hub, which was growing and attaching gradually to the pressure side as the outflow pressure increased. Vortex B was generated by the volute tongue and the interacting flow. The low-energy fluid accumulated at the volute tongue. Figure 9B shows that the flow pattern in the impeller passage was very complex, exhibiting both reverse flow and secondary flow. The secondary flow was the cross flow, which was perpendicular to the radial flow of the impeller passage. Common features observed in channels are the presence of a strong outward through-flow along the suction side of each blade as well as the presence of a strong localized outflow at the pressure side of each blade. When the channel reached the volute tongue region, the flow started to reverse back to the impeller, and the direction of vortex B was opposite to the rotation of the impeller. The intensity of vortex A at the hub corner increased and moved to the middle of the pressure surface. After the channel passed the tongue region, the vortex B disappeared immediately, and the radial velocity, particularly along the blade suction side, increased. However, the secondary flow still exists in the impeller passage, which was found to be a common feature for all channels. The radial velocity along the blade pressure side increased, which reduced the intensity of vortex A, then vortex A back to the hub corner. To investigate the vortex structure in the channels, a detailed analysis of the vector and the velocity distribution in the channels is shown in Figure 10 to Figure 13.
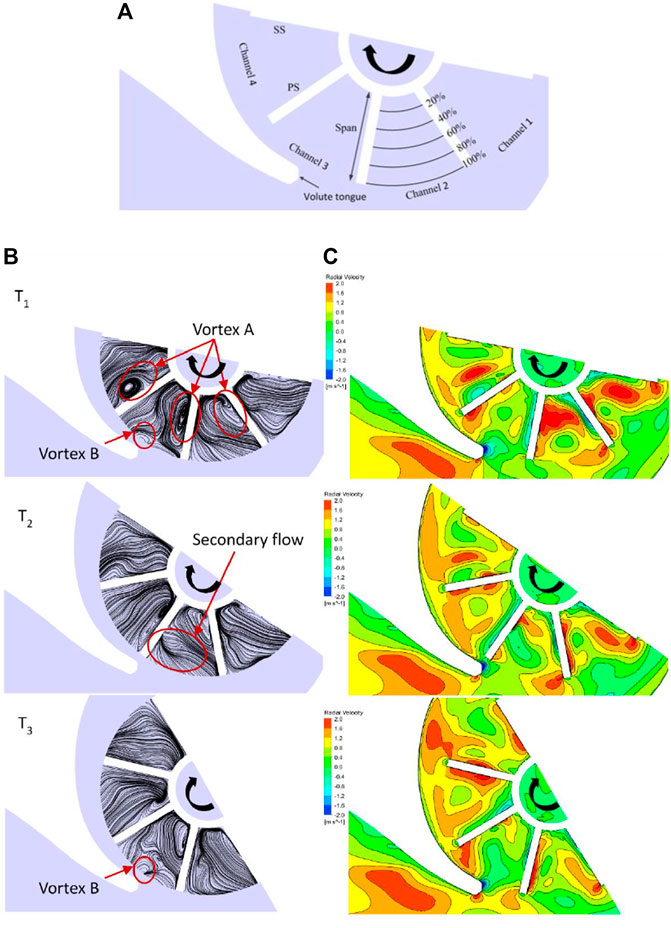
FIGURE 9. Streamline and distribution of radial velocity at the middle cross-sectional plane of volute (A) View of section (B) Streamline (C) Radial velocity.
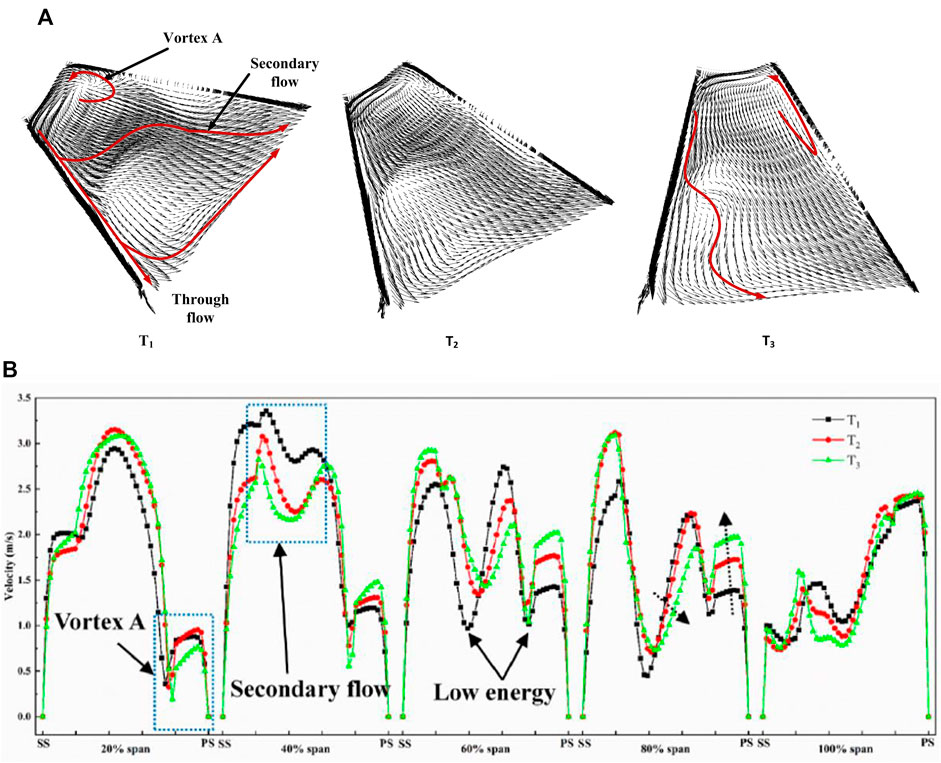
FIGURE 10. Vectors and velocity distribution of T1, T2 and T3 in channel 1 (A) Vector distribution (B) Velocity distribution.
As shown in Figure 10A, the outward flow region generates the complex secondary flow in the region between the blades and the vortex at the hub corner. In addition, there is a strong through-flow along the blade suction side. The flow direction at the impeller outlet is important because it determines the overall performance of the impeller considered. According to Choi et al. (2004), when the impeller rotates clockwise with angular velocity, the Coriolis force works perpendicularly to the angular velocity and the relative tangential velocity. In the (radial) outward-flow region of the impeller passage, the Coriolis force acts in the direction from the suction side to the pressure side. Thus, a large cross-flow region is located within the impeller channel. Figure 10B illustrates the location of the secondary flow. There are two low-energy areas in the channel: one was located at the center of the passage (caused by the secondary flow), while the other one was caused by the vortex A. After rotation by 24°, the area of secondary flow moved towards the pressure surface and the velocity at the pressure side increased.
As shown in Figure 11A, in channel 2, the secondary flow increased. There was a strong relative tangential velocity in the vicinity of the impeller outlet, which generated a strong Coriolis force acting in the direction toward the impeller center. This induced reverse flow within the impeller channel. The flow direction at the impeller outlet was mostly outward, except for the weak and small reverse flows marked in the figure. When the channel was close to the volute tongue, the velocity decreased, and a low-velocity area appeared at the side shroud of the channel—see Figure 11B. After the appearance of vortex B, the reverse flow in the channel increased. As the flow channel approached the tongue, the strength of vortex A gradually decreased, and the velocity in the flow channel also decreased.
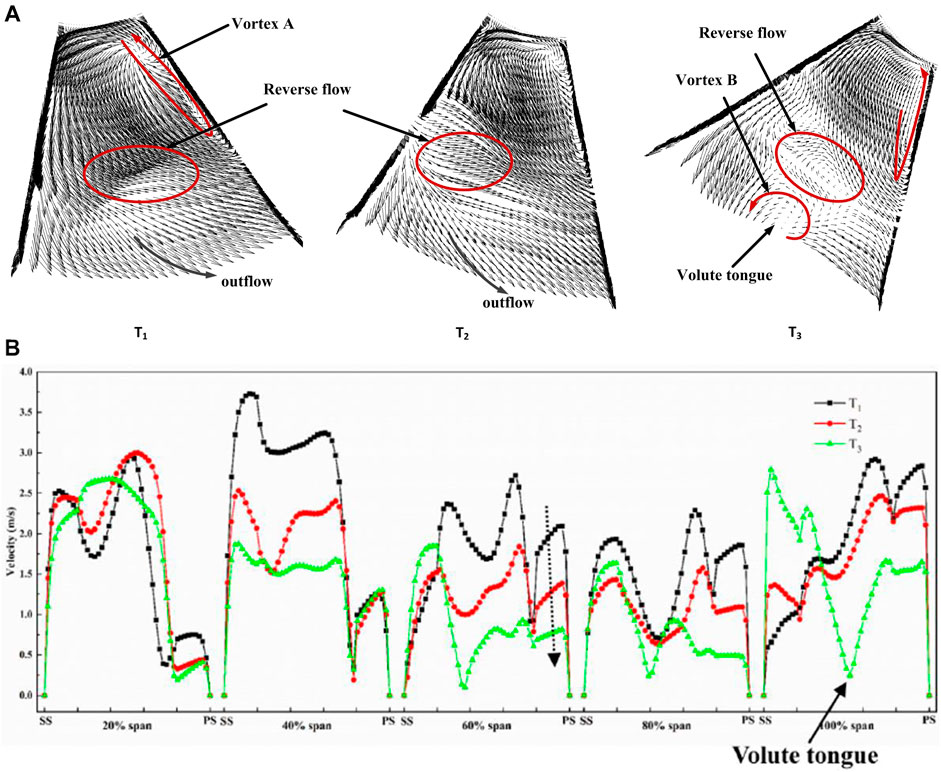
FIGURE 11. Vectors and velocity distribution of T1, T2, and T3 in channel 2 (A) Vector distribution (B) Velocity distribution.
While the first two channels rotated towards the tongue, channels 3 and 4 rotated away from the tongue. Figure 12A shows the vectors in channel 3. After the channel passed the volute tongue, the outflow became more stable, and the velocity in the secondary flow area increased. The intensity of vortex A decreased such that vortex A moved back to the hub corner. As shown in Figure 12B, the velocity change was largest in the hub area. With the rotation of the impeller, the fluid velocity near the suction surface decreased but the fluid velocity near the pressure surface increased. The intensity of the secondary flow decreased gradually, and the flow field in the channel became uniform.
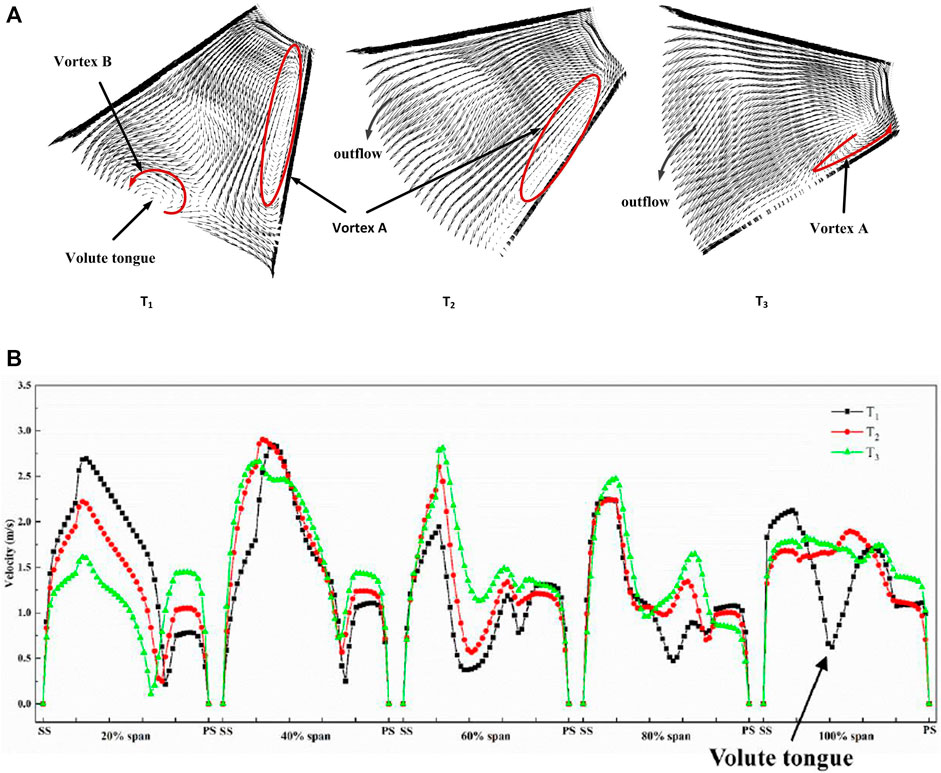
FIGURE 12. Vectors and velocity distribution of T1, T2, and T3 in channel 3 (A) Vector distribution (B) Velocity distribution.
Figure 13 shows the flow development for channel 4. The two low-energy regions are clearly shown in Figure 13A. The region of vortex A reached a maximum at T1, and the velocity started to increase sharply under the effect of outflow pressure. As shown in Figure 13B, the lowest velocity in channel four was at about 60% span (caused by the secondary flow). With the rotation of the impeller, the velocity changed dramatically and the intensity of the secondary flow decreased substantially. The flow field was most uniform at T3.
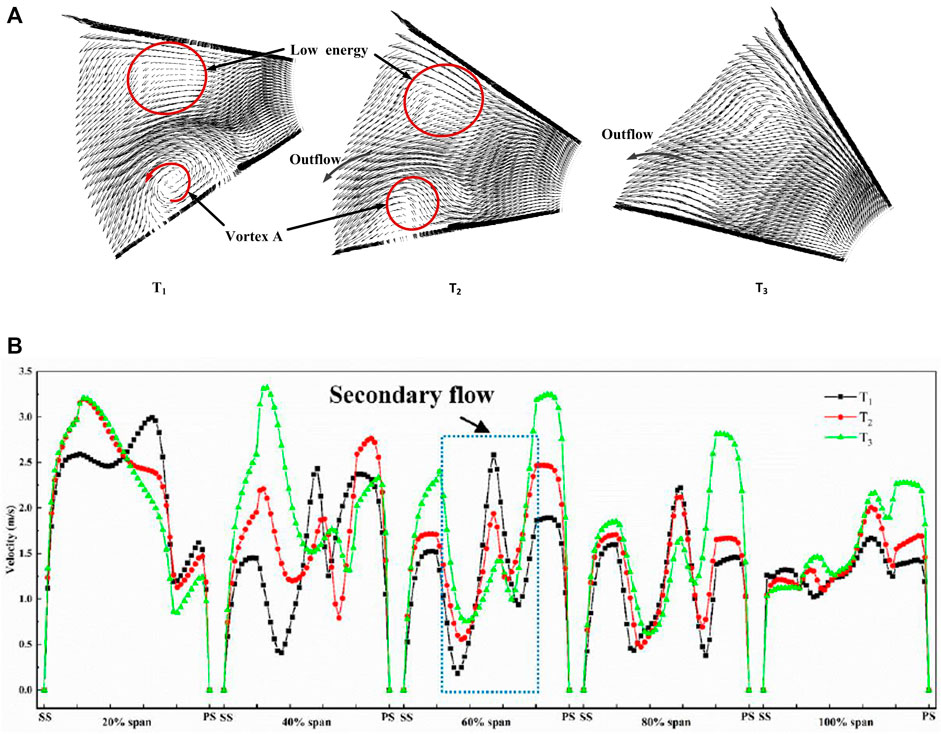
FIGURE 13. Vectors and velocity distribution of T1, T2 and T3 in channel 4 (A) Vector distribution (B) Velocity distribution.
In the new dishwasher type, the strong interaction between the flow leaving the impeller and entering the volute casing generates pulsating pressure. To analyze the pressure fluctuation of the flow field in the complete cycle, three monitoring points were introduced along the circumferential direction in the transition section of the tongue position. In addition, three radial monitoring points were added at the outlet of the impeller for analysis. The locations of the monitoring points are shown in Figure 14. The static pressure value was obtained every 4° of the time steps, and the pressure fluctuation (obtained by a complete rotation cycle) was analyzed. The monitoring point P1 was located in the tongue region.
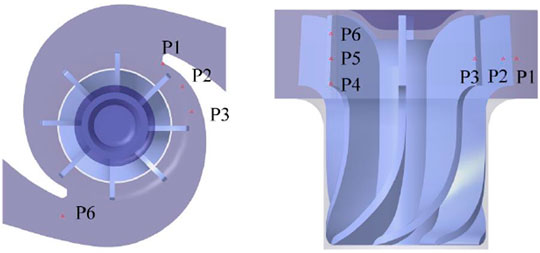
FIGURE 14. Location of monitoring points in volute.
Figure 15 shows the time-domain diagram for the static pressure fluctuation at the monitoring points in the transition section. The abscissa represents the time, and the ordinate refers to the static pressure value. During a complete cycle, the pressure fluctuations have eight peaks. The peak of the scheme with a volute speed of 0 rpm was the smallest at the monitoring point P1. The pressure of the 30 rpm scheme was greater than that of the 60 rpm scheme, while the pressure of the other two schemes (30 and 60 rpm) changed little from P1 to P3.
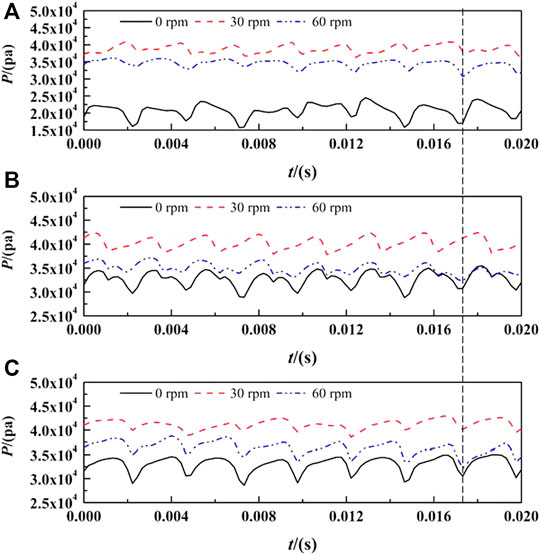
FIGURE 15. Time domain diagram of static pressure fluctuation at different monitoring points in transition section (A) P1 (B) P2 (C) P3.
FFT was conducted to investigate the amplitude of the dominant frequency, and the data of the last 3 cycles were used for the frequency characteristics. Figure 16 shows the frequency spectra for different monitoring points of the transition section of the volute along the circumferential direction. The results show that the characteristic frequency was the blade passing frequency (BPF) for all three schemes, and the dominant frequency was one time the BPF. On the other hand, the secondary frequency was an integral multiple of the BPF. The results also indicate that the dominant frequency was closely related to the rotor/stator interaction between the impeller and volute. Furthermore, the frequency-domain curve of the pressure fluctuation in the transition section was smooth, and there was practically no harmonic. A comparison of the amplitudes of the monitoring points P1 to P3 indicates that the frequency-domain amplitudes of the 0 rpm scheme were the highest and weakened in turn. They are mainly associated with the blade passage frequency, which represent high amplitudes near the tongue and at impeller discharge locations. The amplitude of the 30 rpm scheme first increased and then decreased, while the amplitude-change for the 60 rpm scheme was exactly opposite to the 30 rpm scheme (which first decreased and then increased).
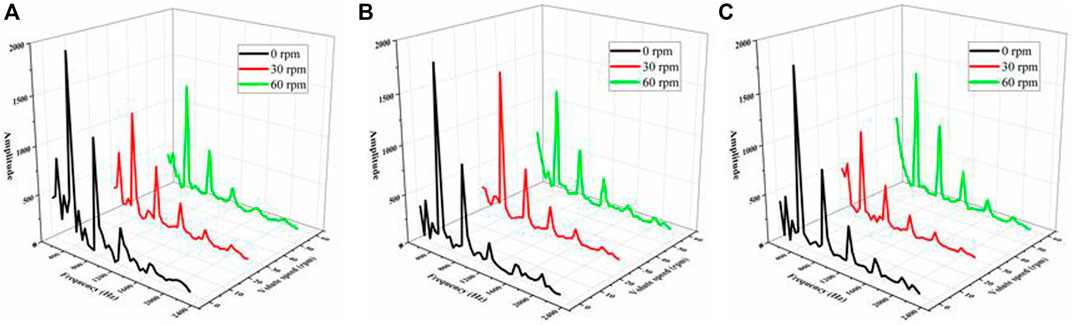
FIGURE 16. Frequency spectrum of pressure fluctuation at different monitoring points in the transition section (A) P1 (B) P2 (C) P3.
Figure 17 shows the time domain of the static pressure fluctuation at the monitoring point in the impeller outflow section. P4 is at the bottom of the volute, while P6 is located at the top of the volute. The peak value from the bottom to the top of each scheme decreases slightly. The scheme with the volute speed of 0 rpm shows almost no fluctuation and the peak value for the 30 rpm scheme was slightly higher than for the 60 rpm scheme. Due to the effect of volute speed, there can be a deviation between the different schemes. The deviation between the two peaks (30 and 60 rpm) was 0.05 T, which indicates that the volute speed had a strong effect on the flow field in the volute outflow section.
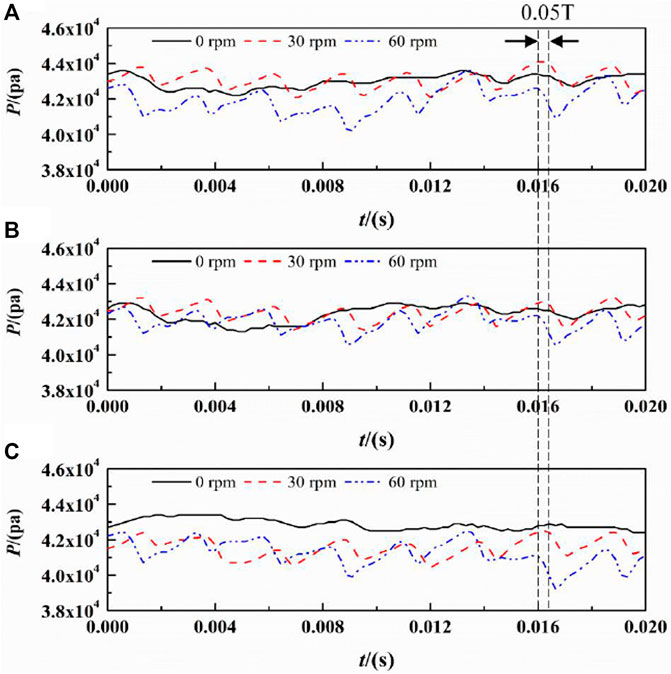
FIGURE 17. Time domain of static pressure fluctuation at monitoring points in outflow section (A) P4 (B) P5 (C) P6.
Figure 18 shows the pressure fluctuation spectrum at different monitoring points for the outflow section of the impeller. The characteristic frequency was the BPF, and the dominant frequency was one times the BPF (which is the same as for the transition section). The effect of the shaft frequency on the outflow section of was larger. From P4 to P6, the frequency-domain amplitude of the 0 rpm scheme was the smallest and weakens in turn, while the amplitude of the 60 rpm scheme was highest at three monitoring points. This indicates that, with increasing volute speed, the effect on the outflow section increases.
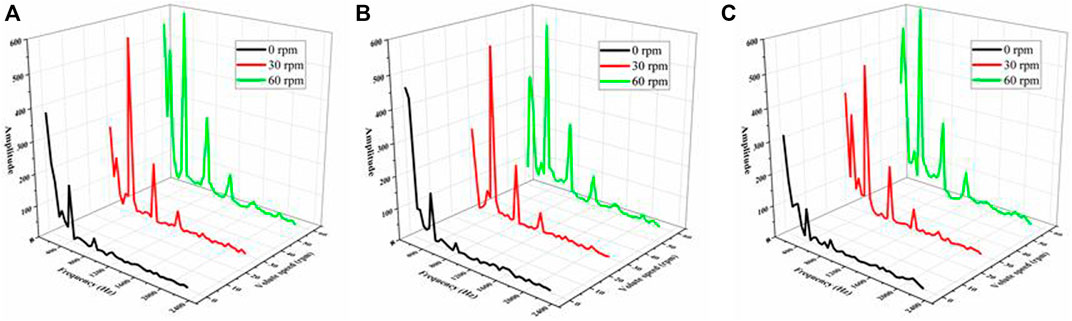
FIGURE 18. Frequency of pressure fluctuation at different monitoring points in outflow section(A) P4 (B) P5 (C) P6.
The radial force on the principal axis of a pump mainly originates from the flow field in the impeller (Yue et al., 2017; Wang et al., 2020). Thus, the distribution of the radial force was analyzed to better understand the relationship between flow characteristic and radial force. Given that the time step was set to 1/90 of the period of the impeller revolution in the transient calculation, 90 data point were recorded during one impeller revolution. Figure 19A shows the time revolution of the radial force. The horizontal axis is the time, and the vertical axis is the magnitude of the resultant force. The magnitude of the radial force was computed at each time step using a full integration of the pressure and shear stress on the surfaces of both hub and blades. The results show that there were eight peaks and troughs in a complete cycle but the distribution of force shows great differences between the schemes. The radial force of the impeller was in the range 1N–3 N. The deviation between the 30 rpm peak and the 0 rpm peak was 0.02 T, while the deviation between the peaks for 60 and 30 rpm was also 0.02 T. Due to the rotor/stator interaction, the radial force vector on the principal axis completed a full trace with a closed circle. From the macro perspective, the vector diagrams of impeller appear irregular, octagonal, and they were essentially closed—see Figure 19B. There were obvious differences in the peak-to-peak values, which shows that the force on the blade was very non-uniform, and the bearing can be greatly affected. When the volute rotated at 30 rpm, the shape of the vector distribution on the impeller was more regular. In other words, the speed of the volute strengthens the fluctuation of the radial force and affects the operational stability of the new dishwasher pump.
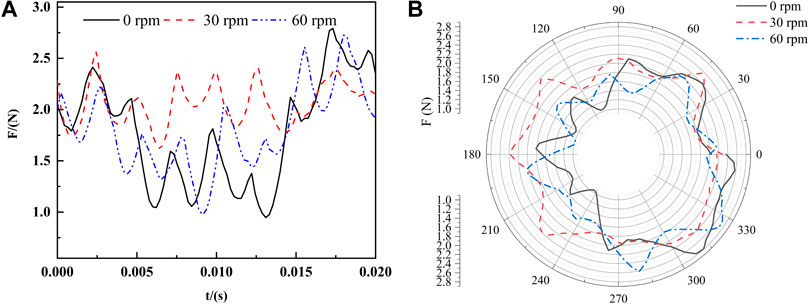
FIGURE 19. Time domain and vector distribution of radial force of impeller (A) Time domain (B) Vector distribution.
Figure 20 shows the time-domain diagram and vector distribution for the radial force of the volute. Similar to the impeller, the radial force on the volute was non-uniform. The vector diagram of the volute was not closed because the data were obtained during one period of impeller revolution. The maximum radial forces for 0, 30, and 60 rpm were 2.69, 2.28, and 2.54 N, respectively. There was also a deviation between the peaks of the schemes with different rotation speeds of the volute. The deviation was 0.05 T, which was the same as for the pressure deviation in the outflow section. The deviation was larger compared to the impeller radial force.
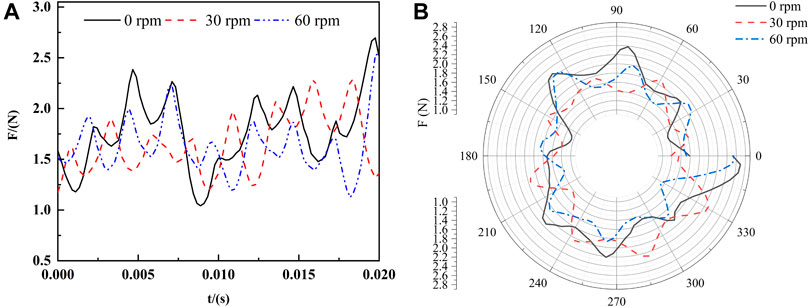
FIGURE 20. Time domain and vector distribution of radial force of volute (A) Time domain (B) Vector distribution.
Both performance and flow development of a new type of dishwasher pump were investigated. The pressure fluctuation and radial force, which are associated with the rotor stator interaction, were determined. The simulation with an SST k-ω turbulence model produced results that were in good agreement with the experimental values. Based on the numerical simulation and theoretical analysis, the following conclusions can be drawn:
1) The rotation speed of volute had only a small effect on both the head and efficiency of pump. The flow field in the impeller shows symmetry due to the twin volute. The speed of the volute mainly affected the flow field in the transition section between impeller and volute. Therefore, the volute speed can be set as static condition to study the flow field in the impeller.
2) The flow development in the channels indicates that the differences in flow fields in the impeller were related to the relative positions of the impeller and the volute. A passage vortex A was located at the corner between the pressure surface and the hub. The intensity of vortex A increased, when the channel rotated towards the tongue. It then decreased when the channel moved away from the tongue. A secondary flow occurred in the impeller passage, which was found to be a common feature of all channels. The intensity of the secondary flow follows the same rules as vortex A. Another vortex (B) was generated by the low-energy flow in the tongue region when the channel moved through the volute tongue.
3) The time-domain curve for the pressure pulses was periodic. In the transition section of the volute, the characteristic frequency was the blade passing frequency, while the dominant frequency was one times the BPF, i.e., 400 Hz. After comparing 3 schemes of different volute speed, it was found that the static scheme had the lowest pressure but the highest amplitude in the tongue region (which reduced the stability of the pump). Rotating the volute increased the pressure in the tongue region but the pressure did not always increase with increasing volute speed. The 30 rpm scheme showed the best stability. In the outflow section, the pressure was higher than in the transition section, and the pressure decreased slightly from the bottom to the top of the volute. A deviation in the tongue region was not clearly observed, while the deviation for the outflow section was 0.05 T. This indicates that the rotating volute affects the pressure pulse via the rotor/stator interaction. In the frequency domain, the shaft frequency affected the outflow of the impeller. In addition, this effect increased with increasing volute speed.
4) After comparing the 3 schemes with respect to the radial force, a deviation between the peaks for the different rotation-speed schemes was found. The deviation for the radial force in the volute was larger compared to the impeller. When the volute rotated 30 rpm, the shape of the vector distribution was more regular, which indicates that the stability of the pump was the highest.
The raw data supporting the conclusion of this article will be made available by the authors, without undue reservation.
CN: Literature search, Figures, Study design, Investigation, data analysis, Writing. YL: Conceptualization, Methodology, Data collection, Formal analysis, Funding acquisition. PH: Figures, Data interpretation, Reviewing and Editing. HX: Reviewing and Editing. FZ: Reviewing and Editing.
The National Natural Science Foundation of China (No. 51809120), the Natural Science Foundation of Jiangsu Province (No. BK20180871), the Project Funded by China Postdoctoral Science Foundation (No. 2018M640462) and the Natural Science Foundation of the Jiangsu Higher Education Institutions of China (No. 18KJB470005), Key Research and Development Plan Project of Jiangsu Province (No. BE2019009).
HX and FZ were employed by the company Ningbo FOTILE Kitchen Ware Co., Ltd.
The remaining authors declare that the research was conducted in the absence of any commercial or financial relationships that could be construed as a potential conflict of interest.
All claims expressed in this article are solely those of the authors and do not necessarily represent those of their affiliated organizations, or those of the publisher, the editors and the reviewers. Any product that may be evaluated in this article, or claim that may be made by its manufacturer, is not guaranteed or endorsed by the publisher.
Barrio, R., Blanco, E., Parrondo, J., GonzáLez, J., and FernáNdez, J. (2008). The Effect of Impeller Cutback on the Fluid-Dynamic Pulsations and Load at the Blade-Passing Frequency in a Centrifugal Pump. J. Fluid Eng. 130 (11), 1349–1357. doi:10.1115/1.2969273
Choi, Y.-D. (2008). Investigation on the Internal Flow Characteristics of the Low Specific Speed Centrifugal Pump with Circular Casing. J. Korean Soc. Mar. Eng. 32 (3), 404–412. doi:10.5916/jkosme.2008.32.3.404
Choi, Y.-D., Nishino, K., Kurokawa, J., and Matsui, J. (2004). PIV Measurement of Internal Flow Characteristics of Very Low Specific Speed Semi-open Impeller. Exp. Fluids 37 (5), 617–630. doi:10.1007/s00348-004-0838-7
Chu, S., Dong, R., and Katz, J. (1995). Relationship between Unsteady Flow, Pressure Fluctuations, and Noise in a Centrifugal Pump-Part B: Effects of Blade-Tongue Interactions. J. Fluids Eng. Trans. ASME 117 (1), 30–35. doi:10.1115/1.2816814
Dedoussis, V., and Giannatsis, J. (2004). Stereolithography Assisted Redesign and Optimisation of a Dishwasher Spraying Arm. Rapid Prototyping J. 10 (4), 255–260. doi:10.1108/13552540410551388
Guo, S., and Okamoto, H. (2003). An Experimental Study on the Fluid Forces Induced by Rotor-Stator Interaction in a Centrifugal Pump. Int. J. Rotating Machinery 9 (2), 135–144. doi:10.1155/s1023621x03000125
Gonzáles, J., Santolaria, C., Parrondo, J. L., Fernández, J., and Blanco, E. (2003). “Unsteady Radial Forces on the Impeller of a Centrifugal Pump with Radial gap Variation,” Proceeding of 4th ASME/JSME Joint Fluids Engineering Conference 1173–1181.
Liu, M. Q., Li, Q. W., Bai, Y. H., Liu, Z. Y., and He, P. J. (2012). Efficiency and Pressure Pulsation Analysis of a Double Suction Centrifugal Pump with Different Arrangement Impellers. Amr 433-440, 709–715. doi:10.4028/www.scientific.net/amr.433-440.709
Long, Y., Lin, B., Fang, J., Zhu, R., and Fu, Q. (2020). Research on the Transient Hydraulic Characteristics of Multistage Centrifugal Pump during Start-Up Process. Front. Energ. Res. 8, 76. doi:10.3389/fenrg.2020.00186
Majidi, K. (2005). Numerical Study of Unsteady Flow in a Centrifugal Pump. J. Turbo machinery 127 (2), 805–812. doi:10.1115/1.1776587
Menter, F. R. (1994). Two-equation Eddy-Viscosity Turbulence Models for Engineering Applications. Aiaa J. 32, 1598–1605. doi:10.2514/3.12149
Minde, M. (2016). “Validation of Dishwasher CFD Model Using PIV”. Master thesis. Lulea, Sweden: Lulea University of Technology.
Peng, G., Du, J., Chang, H., Chen, Q., Li, J., Pan, C., et al. (2021). Numerical and Experimental Analysis of Influence of Impeller Structures on Slurry Pump Performance. Front. Energ. Res. 9, 762159. doi:10.3389/fenrg.2021.762159
Pérez-Mohedano, R., Letzelter, N., Amador, C., Vanderroest, C. T., and Bakalis, S. (2015). Positron Emission Particle Tracking (Pept) for the Analysis of Water Motion in a Domestic Dishwasher. Chem. Eng. J. 259 (259), 724–736. doi:10.1016/j.cej.2014.08.033
Pérez-Mohedano, R., Letzelter, N., and Bakalis, S. (2017). Integrated Model for the Prediction of Cleaning Profiles inside an Automatic Dishwasher. J. Food Eng. 196, 101–112. doi:10.1016/j.jfoodeng.2016.09.031)
Santori, G., Frazzica, A., Freni, A., Galieni, M., Bonaccorsi, L., Polonara, F., et al. (2013). Optimization and Testing on an Adsorption Dishwasher. Energy 50 (1), 170–176. doi:10.1016/j.energy.2012.11.031
Shi, L., Zhu, J., Tang, F., and Wang, C. (2020). Multi-Disciplinary Optimization Design of Axial-Flow Pump Impellers Based on the Approximation Model. Energies 13 (4), 779. doi:10.3390/en13040779
Solis, M., Bakir, F., and Khelladi, S. (2009). ““Pressure Fluctuations Reduction in Centrifugal Pumps: Influence of Impeller Geometry and Radial Gap,”,” in ASME 2009 Fluids Engineering Division Summer Meeting, 253–265. doi:10.1115/fedsm2009-78240
Spence, R., and Amaral-Teixeira, J. (2009). A CFD Parametric Study of Geometrical Variations on the Pressure Pulsations and Performance Characteristics of a Centrifugal Pump. Comput. Fluids 38 (6), 1243–1257. doi:10.1016/j.compfluid.2008.11.013
Spence, R., and Amaral-Teixeira, J. (2008). Investigation into Pressure Pulsations in a Centrifugal Pump Using Numerical Methods Supported by Industrial Tests. Comput. Fluids 37 (6), 690–704. doi:10.1016/j.compfluid.2007.10.001
Wang, H. L., Hu, Q. X., Yang, Y., and Wang, C. (2021). Performance Differences of Electrical Submersible Pump under Variable Speed Schemes. Int. J. Simul. Model. 20 (1), 76–86. doi:10.2507/ijsimm20-1-544
Wang, H., Long, B., Wang, C., Han, C., and Li, L. (2020). Effects of the impeller blade with a slot structure on the centrifugal pump performance. Energies 13, 1628. doi:10.3390/en13071628
Yang, M., Min, S. M., and Wang, F. J. (2009). Numerical Simulation of Pressure Fluctuation and Radial Force in a Double Volute Pump. Trans. Chin. Soc. Agric. Machinery 40 (11), 83–88.
Ye, D., Liu, A., Luo, Y., Yu, B., and Lai, X. (2021). Research Progress of Reactor Coolant Pump Pressure Fluctuation and its Improvement Methods. J. drainage irrigation machinery Eng. 39 (8), 770–776. doi:10.3969/j.issn.1674-8530.19.0307
Yue, H., Lei, T., Liu, Y., Yun, X., Zhang, J., and Zhu, B. (2017). Energy Performance and Radial Force of a Mixed-Flow Pump with Symmetrical and Unsymmetrical Tip Clearances. Energies 10 (1), 57. doi:10.3390/en10010057
Zhang, L., Wang, C., Zhang, Y., Xiang, W., He, Z., and Shi, W. (2021). Numerical Study of Coupled Flow in Blocking Pulsed Jet Impinging on a Rotating wall. J. Braz. Soc. Mech. Sci. Eng. 43, 508. doi:10.1007/s40430-021-03212-0
Zheng, S. H., Qian, H., Mou, J. G., Wu, B., Gu, Y. Q., and Chen, Y. (2015). Influences of Staggered Blades on Hydrodynamic Performance of Three-Channel Volute Centrifugal Pump. Trans. CSAE 31 (23), 51–59. doi:10.11975/j.issn.1002-6819.2015.23.007
Zhou, J., Zhao, M., Wang, C., and Gao, Z. (2021). Optimal Design of Diversion Piers of Lateral Intake Pumping Station Based on Orthogonal Test. Shock and Vibration, 6616456. doi:10.1155/2021/6616456
Zhu, L., Yuan, S. Q., Yuan, J. P., and Pei, J. (2011). Numerical Simulation on Rotor-Stator Interaction in a Centrifugal Pump with Different Gaps between Impeller and Tongue. Trans. Chin. Soc. Agric. Machinery 42 (5), 49–55. doi:10.3969/j.issn.1002-6819.2011.10.009
Zhu, L., Yuan, S. Q., Yuan, J. P., Zhou, J. J., Jin, R., and Wang, H. (2011). Numerical Simulation for Rotor-Stator Interaction of Centrifugal Pump with Different Tongues. Trans. CSAE 27 (10), 50–55. doi:10.3969/j.issn.1002-6819.2011.10.009
Keywords: dishwasher pump, pressure fluctuation, compound impeller, twin volute, radial force
Citation: Ning C, Li Y, Huang P, Xu H and Zheng F (2022) Numerical Analysis of a New Type of Dishwasher Pump for Different Rotation Speeds of the Volute. Front. Energy Res. 9:825159. doi: 10.3389/fenrg.2021.825159
Received: 30 November 2021; Accepted: 20 December 2021;
Published: 11 January 2022.
Edited by:
Xiaojun Li, Zhejiang Sci-Tech University, ChinaCopyright © 2022 Ning, Li, Huang, Xu and Zheng. This is an open-access article distributed under the terms of the Creative Commons Attribution License (CC BY). The use, distribution or reproduction in other forums is permitted, provided the original author(s) and the copyright owner(s) are credited and that the original publication in this journal is cited, in accordance with accepted academic practice. No use, distribution or reproduction is permitted which does not comply with these terms.
*Correspondence: Yalin Li, eWxsaUB1anMuZWR1LmNu
Disclaimer: All claims expressed in this article are solely those of the authors and do not necessarily represent those of their affiliated organizations, or those of the publisher, the editors and the reviewers. Any product that may be evaluated in this article or claim that may be made by its manufacturer is not guaranteed or endorsed by the publisher.
Research integrity at Frontiers
Learn more about the work of our research integrity team to safeguard the quality of each article we publish.