 Dali Yu
 Chi Xu1,3
94% of researchers rate our articles as excellent or good
Learn more about the work of our research integrity team to safeguard the quality of each article we publish.
Find out more
ORIGINAL RESEARCH article
Front. Energy Res., 28 January 2022
Sec. Nuclear Energy
Volume 9 - 2021 | https://doi.org/10.3389/fenrg.2021.819060
This article is part of the Research TopicExperimental and Simulation Research on Nuclear Reactor Thermal-HydraulicsView all 15 articles
Post-dryout heat transfer is an important thermal hydraulics phenomenon happening in the loss-of-coolant accident of water-cooled nuclear reactors and the off-design conditions of water-cooled ceramic breeder blanket in fusion reactors. It is necessary to research the flow and heat transfer mechanisms of post-dryout. To economically and comprehensively study on the post-dryout heat transfer characteristics, this work conducted fluid-to-fluid modeling research on water and R-134a data banks by using Buckingham dimensional analysis methodology. In addition, a new interpolation method was developed and verified to make the scaling between the two data banks possible. Finally, a scaling method of post-dryout heat transfer was proposed and assessed by using experimental data. The results showed that the obtained scaling method is reliable in certain conditions.
Post-dryout heat transfer phenomenon widely exists in both the loss-of-coolant accident (LOCA) of a pressurized water reactor (Yoo et al., 2020) and the off-design conditions of water-cooled ceramic breeder blanket in the Chinese Fusion Engineering Test Reactor (Cheng et al., 2020). A post-dryout heat transfer region can be encountered once the contact between the liquid film and the heated surface cannot be maintained due to continuous liquid film depletion, and the liquid phase is only in the form of dispersed droplets or small fragments, which usually occurs at a void fraction greater than 80% (Groeneveld, 1973). As shown in Figure 1, a post-dryout region consists of a developing region (unstable film boiling) and a fully developed region (stable film boiling) (Yu et al., 2018). The developing region is defined as an unstable region with wet contact heat transfer occurring between the wall and droplets. The heat transfer coefficient in this region reduces significantly, with an accompanying steep temperature rise on the wall surface. While the direct wall–droplets contact becomes less frequent, the vapor temperature and velocity structures and the droplets distribution over the cross-section of the flow are well rearranged, finally the flow develops into a relatively stable state, which is called fully developed post-dryout region, characterized by a stable mist flow pattern and no wall–droplets wet contact. Heat transfer in the full-range post-dryout regime involves various heat exchange paths among the vapor phase, droplets, and the heated wall, including 1) convective heat transfer from wall to vapor; 2) interfacial heat transfer from vapor to droplets; 3) contact heat transfer between wall and droplets; 4) radiative heat transfer from wall to droplets; 5) radiative heat transfer from vapor to droplets; and 6) radiative heat transfer from wall to vapor.
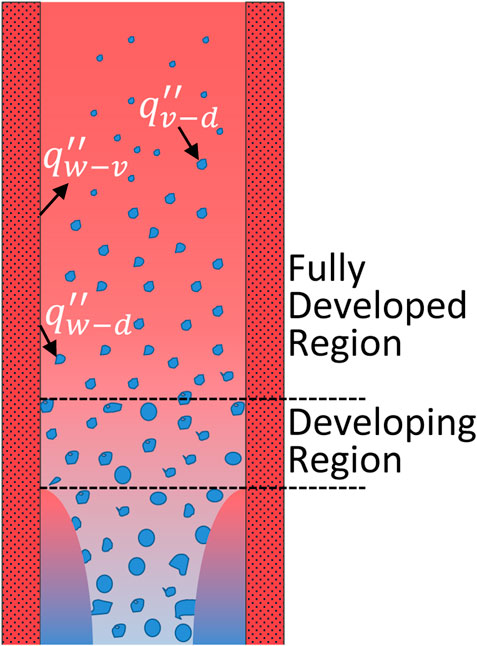
FIGURE 1. Typical flow and heat transfer patterns in the post-dryout region;
A very significant thermal nonequilibrium of several hundred degrees can be generated in the post-dryout region, which has been confirmed by some experiments with water at low to moderate pressures in a tube (Nijhawan et al., 1980; Evans et al., 1983; Gottula et al., 1985). According to this fact, both the experimental studies and the predicting methods of post-dryout heat transfer have been conducted for over 60 years, ranging from wall temperature data in various fluids and various flow conditions to subtopics such as the influence of droplet hydrodynamics on both the convective heat transfer between wall and vapor and the interfacial heat transfer between vapor and droplets. However, the reliable prediction methods for post-dryout heat transfer are still missing due to the complexity of processes involved, especially due to the difficulties in the prediction of thermal nonequilibrium.
An experimental study of post-dryout heat transfer was performed at the KIT Model Fluid Facility (KIMOF) by using refrigerant R-134a as the working fluid (Köckert et al., 2018; Köckert et al., 2021). Tests were conducted in a uniformly heated tube (inside diameter: 10 mm, heated length: 3,100 mm) at pressures of 11.1, 16, and 28 bar, with varying mass flux in the range of 300–1,500 kg/(m2s). Wall temperature distributions were obtained and used to verify the developed KIT Mechanistic Model (Yu et al., 2018; Yu, 2019). As to further verify and possibly improve the predictions, additional experimental information about the droplet behavior and vapor temperature distributions are required. Köckert et al. (2021) integrated a visualizable annular test section into the KIMOF test facility in order to measure the droplet distribution, size distribution, and velocities using a high-speed camera through 32 bull's-eye–shaped windows on the test section. Liu et al. (2021) performed post-dryout heat transfer experiments in a vertical tubular test section using water as the working fluid. The heat transfer characteristics during the formation, growth, and propagation of dry patches were analyzed based on the measured outer surface temperature. Jin and Shirvan (2021) experimentally investigated on the two-phase flow interface behavior during film boiling in quench transients using image processing.
Different types of theoretical models and correlations have been developed and were applied with varying degrees of success. An analytic model was developed for the whole post-dryout region by the authors (Yu et al., 2018; Yu, 2019; Köckert et al., 2021) and was verified by plenty of data bank including both water and R-134a experiments. Cheng et al. (2018) developed a mechanistic model to predict the post-dryout heat transfer and rewetting. Based on the treatment of direct contact heat transfer between the wall and droplets, the hysteresis phenomenon of the flow boiling curve was obtained and explained by the Leidenfrost effect. In addition to these modeling works, Li and Anglart (2016), Shi et al. (2017), and Fan et al. (2020) simulated some interesting features of post-dryout heat and mass transfer (e.g., vapor temperature and velocity profile, droplet behaviors) through the CFD approach. However, this kind of approach is computationally expensive, and the models applied in the CFD still need quite extensive knowledge of the physical phenomena to improve the prediction.
Massive data are required to reveal the flow and heat transfer mechanisms of post-dryout with water, as well as validating the theoretical models and CFD approaches. In order to reduce the cost and technical difficulties of the water-based post-dryout experiments, Freon family fluids have been frequently used as the model fluid because of their lower latent heat of vaporization and lower critical pressure. Groeneveld et al. (1997) indicated that in the fluid-to-fluid modeling of post-dryout heat transfer, geometric and dynamic similarities must be satisfied. Equal equilibrium qualities were utilized to achieve thermodynamic similarity. For hydrodynamic similarity, equal density ratios (ρv/ρd) in both fluids were required. As for the dimensionless number Ψ(G) involving mass flux, it is important to apply compensated distortion coefficients to make it appropriate for the studied phenomena. Groeneveld et al. (1997) suggested the use of Rev Pr0.5 as the dimensionless number Ψ(G) through the concluding research results of Hammouda et al. (1996), in which the post-dryout heat transfer was studied in three different Freons.
In this study, the work started from deriving dimensionless numbers and then selecting dimensionless numbers by their significance to post-dryout heat transfer. Five different forms of the scaling methods were obtained and evaluated through an optimization procedure, for which a new interpolation method was developed. The optimized scaling methods were eventually assessed by some experimental tests.
Based on the experience of theoretical investigations on post-dryout heat transfer, the independent variables that determine the wall temperature in a post-dryout flow in a round tube can be described as below:
The system describing variables: P, G,
The detailed analyses usually take into account the pressure P via the saturation temperature Ts, or via the physical properties that are evaluated at the saturation temperature. The primary properties that would be used in the derivation of the dimensionless numbers are listed as below:
The properties describing variables: iv−d, ρd, ρv, μd, μv, Cp,d, Cp,v, kd, kv, and σwhere iv−d is the latent heat of evaporation; ρd and ρv are the droplet and vapor densities at the saturation temperature individually; μd and μv are the droplet and vapor viscosities at the saturation temperature individually; Cp,d and Cp,v are the droplet and vapor specific heat capacities at constant pressure individually; kd and kv are the droplet and vapor thermal conductivities at saturation temperature individually; and σ is the surface tension.
With all the possibly relevant variables obtained, the most interesting variable, which is the wall inner surface superheat Tw − Ts, can be described as a function of these variables:
According to the Buckingham Pi-theorem in the form of one possible set of π terms, the function in Eq. 1 can be transformed as below:
where the π terms are expressed as below:
In the above dimensionless numbers, π1 is the dependent dimensionless number that includes the variable of interest Tw − Ts, and the remaining are called independent dimensionless numbers formed by independent variables. Though there are many different complete sets of dimensionless numbers that can be formed, in the current work, the above group of dimensionless number is chosen on the basis of the following considerations:
• Except the one chosen dependent dimensionless number π1—the Nusselt number, each independent dimensionless number to the greatest extent includes only one independent variable that can be regulated experimentally. This allows the maximum amount of experimental control over the dimensionless numbers.
• Most of the dimensionless numbers are expressed as classic numbers (e.g., Reynolds, Prandtl, and Weber), especially while the numbers have their physical significance in post-dryout flow.
• For the properties used in the dimensionless numbers, all are evaluated at the saturation temperature, and which phase's properties are used (since they have the same dimensions) depends on the dimensionless number's physical meaning. For example, the Reynolds number relates to the intensity of flow, and the vapor properties are used because the vapor is the continuous phase with more than 80% volume fraction in the flow.
Strictly speaking, the fluid-to-fluid modeling of post-dryout heat transfer should keep the inlet subcooling number equal in both the model and prototype facilities since the inlet flow conditions can influence droplets generation upstream of the dryout. However, this kind of scaling from case to case is quite expensive due to which the inlet conditions can vary from using different scaling methods and is not suitable to massively evaluate different scaling methods through this way. In the current work, scaling was performed from point to point between the water-based Becker and R-134a-based KIT experiments, and the variables were derived from the local flow conditions. The geometric similarity is kept by using identical tubes as suggested by Groeneveld et al. (1997) to eliminate the geometric effect. The thermodynamic similarity is kept by using equivalent equilibrium quality xe and boiling number Bo. As for the hydrodynamic similarity, the pressure is controlled by using the density ratio π9, and a dimensionless number Ψ(G) involving mass flux can be derived by applying the compensated distortion technique by using the other considered dimensionless numbers, including π3, π4, π5, and π11. Thus, the scaling method can be written as below:
where, five different forms of Ψ(G), including
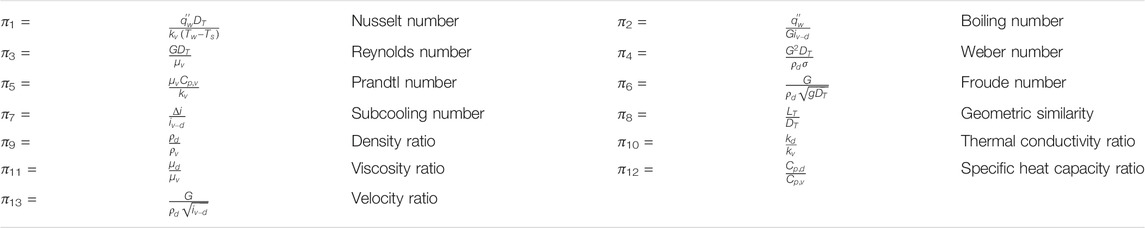
To obtain the best-fitted scaling method, an optimization procedure is used as shown in Figure 2. Scaling is performed from point to point by using the method given in Eq. 3 with different forms of Ψ(G). The details are as follows:
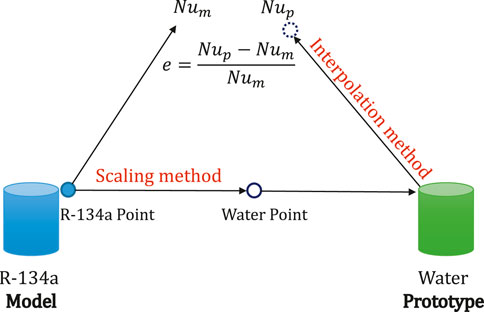
FIGURE 2. Scaling methods optimization procedure.
First, the Model data bank comes from the R-134a–based KIT experiment (Köckert et al., 2018). Each data point is obtained in the fully developed post-dryout region with a selection criterion of dryout void fraction αdo > 0.8. The Prototype data bank comes from the water-based Becker experiment (Becker et al., 1983). Each data point is also obtained in the fully developed post-dryout region with a selection criterion of dryout void fraction αdo > 0.8. Then, the parameters of the selected data points are listed in Table 1.

TABLE 1. Information of data bank used in optimizing scaling method.
Secondly, five different forms of Ψ(G), including
Lastly, an error e is defined as e = (Nup − Num)/Num, representing the accuracy of the scaling. The average e and RMS e of all the data points can be used to evaluate the applied scaling method, under the circumstance that the interpolation method can provide an accurate value of Nup.
To massively evaluate the fluid-to-fluid scaling methods, an interpolation method is required to make the optimization procedure possible. The sparsity of the data bank and performance of the interpolation method determine the quality of the evaluation of the scaling methods. In the current work, the interpolation is performed with Becker data bank, in which the flow parameter (e.g., mass flux, heat flux, pressure) intervals are not small. Thus, an effective interpolation method is required to give an accurate prediction of Nup.
Badea et al. (2018) developed a procedure to assess the intrinsic consistency of the experimental information (values of Nusselt number at the bulk Nuvb) contained in the data bank for supercritical water in circular tubes. The procedure was based on the assumption that the ratio of the Nusselt number value at point i to the value calculated by the local optimal correlation is equal to that ratio which is obtained from its neighboring data point j. The relation can be described as below:
where, Nui and Nuj are the values of the Nusselt number at points i and j, respectively; Nui,oc and Nuj,oc are the values of the Nusselt number at points i and j, which are calculated by the local optimal correlation, respectively.
Based on this assumption, the interpolation method used for post-dryout heat transfer data bank is developed with the following procedures:
The data points in post-dryout heat transfer can be considered as neighboring points if the differences of all the parameters are within a small range receptively. In the current work, the tube diameter DT and the local flow parameters including pressure P, mass flux G, wall heat flux

For this interpretation method, if a data point is closer to the data point of interest, the assumption in Eq. 4 is more likely to be correct. However, if only one data point is selected to speculate the actual Nui of the data point of interest, the systematic error that is caused by this assumption cannot be compensated. Thus, a coefficient C is applied, decreasing it from 1 to 0 until around n neighboring points are found. In the current work, the number n is chosen to be equal to 4.
While the neighboring points are found, two post-dryout heat transfer models including the KIT Mechanistic Model (Yu et al., 2018; Yu, 2019) and the Local Condition Solution (LCS) (Yoder and Rohsenow, 1983; Varone and Rohsenow, 1986) can be used to calculate the predicted Nuj,oc of each neighboring point. The prediction error by the model is defined as below:
where, n is the number of the found neighboring data points. Comparing the two root-mean-square (RMS) errors which were individually calculated by the proposed model and the LCS, the model that has smaller RMS error is considered as the local optimal correlation.
Finally, a mean value of the Nusselt number
The mean value
To assess this interpolation method, each data point in the Prototype data bank is selected and calculated by applying this interpolation method on the remaining data points. A sensitivity study is implemented on the influence of the utilized number of neighboring data points n on the accuracy of the interpolation method. As shown in Figure 3, the assessment results are plotted against the number of neighboring points n. The value of n varies from 1 to 14, the average error remains close to 0, and the RMS error increases slightly but is less than 5%. Finally, n is chosen equal to 4 in the current work. The assessment shows that the average error is −0.149% and the RMS error is 3.786%. As shown in Figure 4, the accuracy of most of the data points are within a range of ±3%.
FIGURE 3. Assessment results versus the number of neighboring points n.
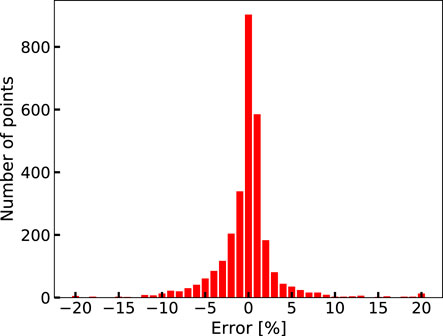
FIGURE 4. Error distribution of the assessment with n is 4.
Though this assessment only guarantees the accuracy of the interpolation method that was used in the flow conditions of the Prototype data bank, it can generally reflect the reliability while the method is applied within the whole range of the flow conditions. By increasing the density of the points in the data bank, this assessment would be more credible to testify the accuracy of the interpolation method in the optimization procedure.
As described in Section 2.2, the scaling methods optimization procedure is performed from point to point by using the method in Eq. 3 with five different forms of Ψ(G). The optimizing matrix is shown in Table 2.
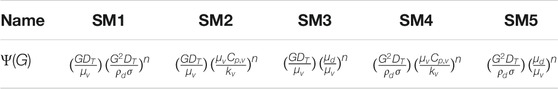
TABLE 2. Information of the scaling methods optimizing matrix.
For each form of the scaling methods, the constant exponent n is tested from −2 to 2 with an interval of 0.1. The optimization results are shown in Figure 5, where the error is defined as e = (Nup−Num)/Num. For form SM1, the RMS error varies very fast, while n is close to the value of −0.5, which would vanish the mass flux G in the dimensionless number Ψ(G). The best-fitted value of n can be selected as 0.4, where the RMS error is nearly the smallest and the value is not sensitive when n is around 0.4. For form SM2, after each data point in the Model data bank scaled by the scaling method with n is less than −0.4, no neighboring data points can be found in the Prototype data bank. The best-fitted value of n for SM2 can be selected as −0.3. For form SM3, while n is more than 0.3, no neighboring data points can be found. The best fitted n for SM3 can be selected as 0.2. For form SM4, while n is less than −1.1, no neighboring data points can be found. The best fitted n for SM4 can be selected as −0.8. For form SM5, while n is greater than 0.7, no neighboring data points can be found. The best fitted n for SM5 can be selected as 0.6. The average and RMS errors of each form of the scaling methods with fitted values of n are listed in Table 3. If merely based on the RMS errors, the optimized SM2 and SM4 perform the best, and SM1 performs the worst.
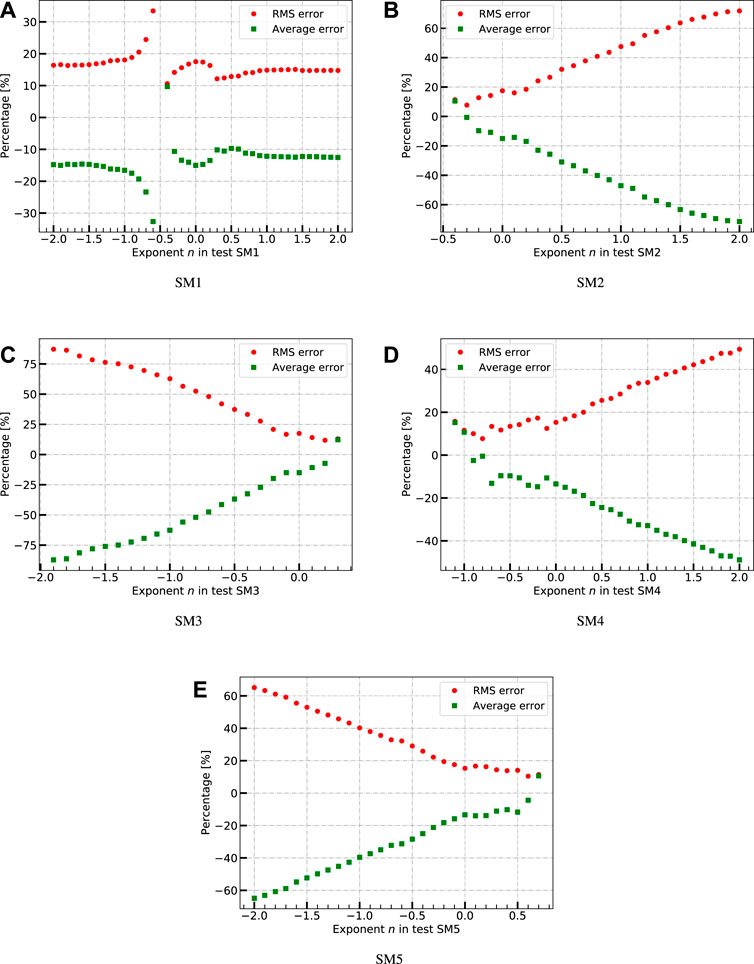
FIGURE 5. Optimization results of each form of the scaling methods.
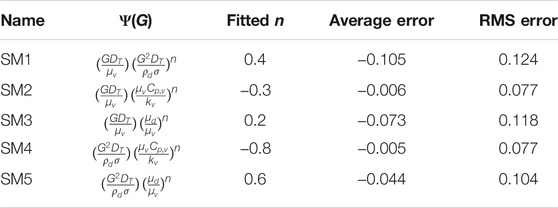
TABLE 3. Results of the average and RMS errors of each form of the scaling methods with fitted n.
A flow condition in Prototype is chosen as pressure P = 7 MPa, mass flux G = 2,600 kg/(m2s), heat flux
The results are listed in Table 4, and the optimized SM5 scaling method has the best scaling ratio, which can reduce the cost and technical difficulties of implementing the post-dryout experiments.
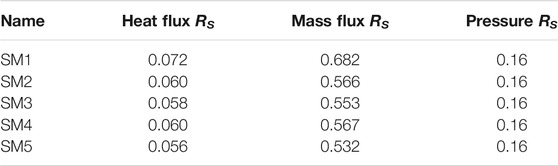
TABLE 4. Scaling ratios RS of heat flux, mass flux, and pressure for each form of the scaling methods.
Assessments of each form of the optimized scaling methods are performed point-to-point from the Prototype data to the Model data. Figures 6, 7 show the assessment results by using six cases from Bennett et al. (1968) and two cases from Era et al. (1966), respectively. The cases are scaled by each scaling method point-to-point to R-134a conditions, and the Nusselt number in Model Num is obtained by using the proposed interpolation method with the KIT data bank. Information of each case is listed in Table 5.
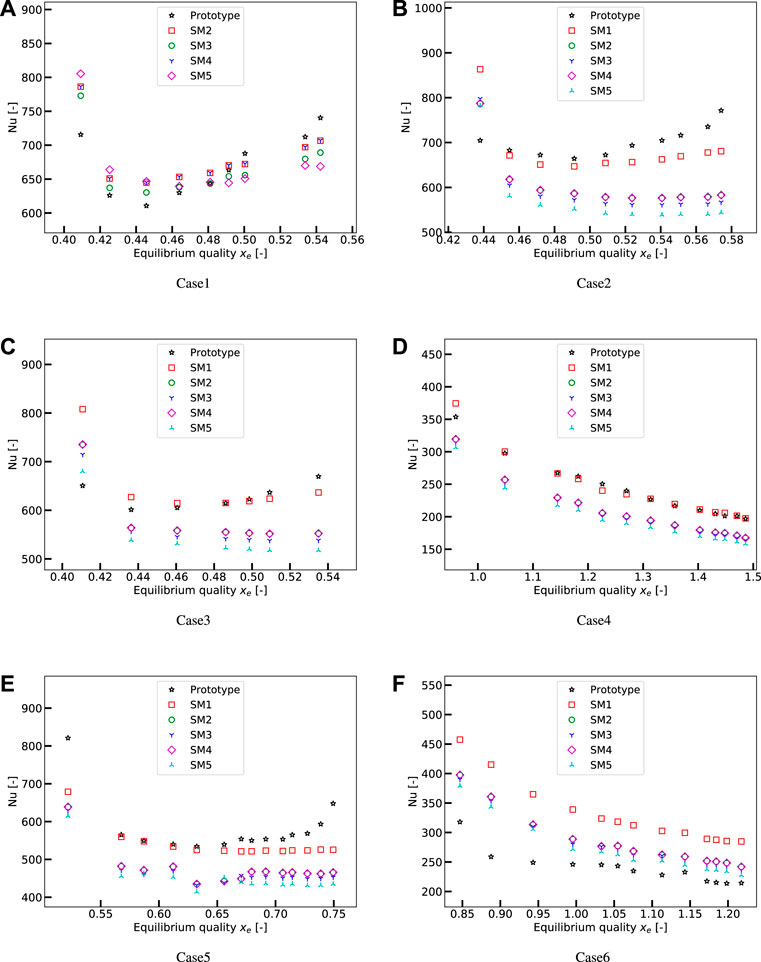
FIGURE 6. Assessments of the optimized scaling methods with Prototype data from Bennett et al. (1968).
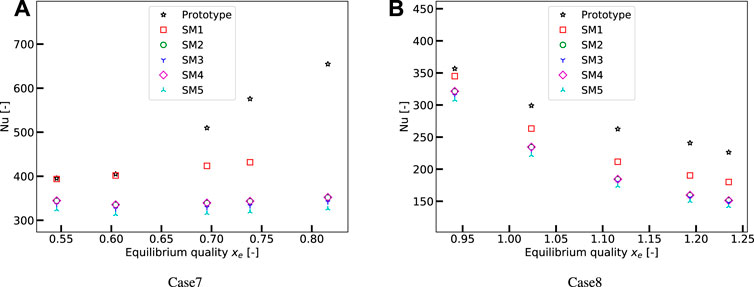
FIGURE 7. Assessments of the optimized scaling methods with Prototype data from Era et al. (1966).
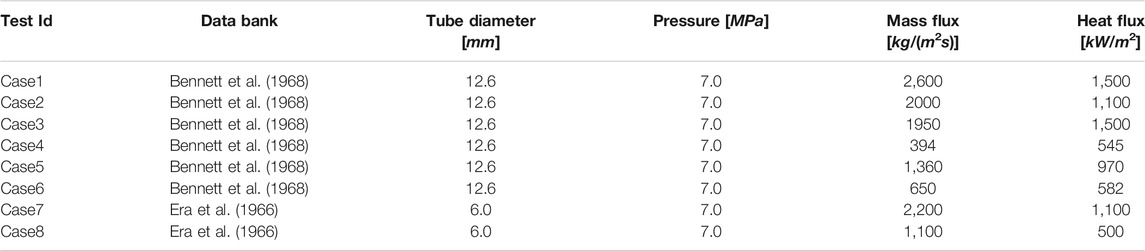
TABLE 5. Parameters of tests for assessment of the optimized scaling methods.
In Case1 as shown in Figure 6A, there are no neighboring points found in the KIT data bank for the scaling by using method SM1. The results show the optimized methods SM2 and SM4 perform the best in this case, and their predictions are almost the same. For Case2, Case3, Case4, and Case5, method SM1 performs the best and has excellent agreement with the Prototype data. For Case6, methods SM2, SM3, SM4, and SM5 predict very similar results, and SM1 performs obviously worse than the others. For Case7 and Case8, method SM1 predicts better than the others, and assessments in these two cases show worse accuracy of the scaling methods than the six cases from Bennett et al. (1968).
To sum up, though very limited cases are used to assess the optimized scaling methods, the results show that the optimized methods SM2 and SM4 always give very similar predictions. In most cases, SM1 can have a better agreement with the Prototype data than the other scaling methods, but in some particular cases, it can also have worse predictions than the other methods. All methods give worse predictions for Era (Era et al., 1966) than for Bennett (Bennett et al., 1968) under similar flow conditions. This could be because the tube diameter in the Era experiment is small, the scaling or the interpolation method is not effective, while the diameter is far from that of the data bank, which in these assessment tests is 10 mm for the KIT data bank.
In this study, fluid-to-fluid modeling of the post-dryout heat transfer between R-134a and water is studied. The scaling methods are developed based on dimensional analyses by using the Buckingham Pi-theorem. The work starts from deriving dimensionless numbers, selecting dimensionless numbers by their significance to post-dryout heat transfer, and then evaluating five different forms of scaling methods through an optimization procedure, in which a proposed interpolation method is used. The interpolation method is necessary for such massive scaling between two data banks and is assessed by verifying the data in the Prototype data bank itself. Finally, for each form of the scaling methods, a fitted dimensionless number Ψ(G) involving mass flux can be obtained. For each form of the scaling methods with fitted Ψ(G), assessments are implemented point-to-point from the Prototype data to Model data. The prototype data makes use of six cases from Bennett et al. (1968) and two cases from Era et al. (1966). The Model data makes use of the KIT data bank from Köckert et al. (2018).
Merely from the obtained results in the current work, the optimized SM1 can be selected as the best scaling method, which in final form can be expressed as:
All the properties are evaluated at saturation temperature, and its application range should be kept the same as the flow conditions of KIT and Becker data banks, as shown in Table 1.
It is worth noting that this scaling method is not verified under a wide range of flow conditions since sometimes no neighboring data points can be found by using this scaling method. The accuracy of the interpolation method during the optimizing of the scaling methods is also not directly assessed. Besides, as indicated at the beginning, the near-wall fluid properties cannot be taken into consideration in the scaling method because the heat flux controlled system is being focused on in this study, and this could probably lead the scaling method SM1 into a limited application range, where the wall superheat cannot be too high. Therefore, the accuracy of the scaling method SM1 is only guaranteed to be reliable in certain conditions so far, until further work can be implemented through the same optimization procedure but by using data points that are generated in two identical tubes and in a wide range of flow conditions for both R-134a and water experiments. Meanwhile, another approach for scaling can be carried out in future work, in which the wall temperature is considered as a controlled variable since properties variation over the cross-section of the flow influences post-dryout heat transfer greatly.
The raw data supporting the conclusions of this article will be made available by the authors without undue reservation.
DY: Conceptualization, methodology, software, validation, formal analysis, investigation, and writing. CX: Methodology, software, and editing. CH: Methodology, software, and editing. YF: Methodology, software, and editing.
This work was supported by the experimental data from the Institute for Applied Thermofluidics (IATF) of KIT, the assistance from Ludwig Köckert, and the supervision from Prof. Xu Cheng. DY is grateful for the support from the Ministry of Education Key Laboratory of Advanced Reactor Engineering and Safety Project (ARES-2020-04) and the CASHIPS Director's Fund (YZJJ2021QN36).
The authors declare that the research was conducted in the absence of any commercial or financial relationships that could be construed as a potential conflict of interest.
All claims expressed in this article are solely those of the authors and do not necessarily represent those of their affiliated organizations, or those of the publisher, the editors, and the reviewers. Any product that may be evaluated in this article, or claim that may be made by its manufacturer, is not guaranteed or endorsed by the publisher.
Badea, A. F., Zhao, M., Cheng, X., Feuerstein, F., and Liu, X. (2018). Consistency Considerations on a Large Databank and Wide Range Heat Transfer Prediction for Supercritical Water in Circular Tubes. Nucl. Eng. Des. 335, 178–185. doi:10.1016/j.nucengdes.2018.05.015
Becker, K., Ling, C., Hedberg, S., and Strand, G. (1983). An Experimental Investigation of post Dryout Heat Transfer. Stockholm: Tech. Rep. KTH-NEL-33, Royal Inst. of Tech.
Bennett, A., Hewitt, G., Kearsey, H., and Keeys, R. (1968). Heat Transfer to Steam–Water Mixtures Flowing in Uniformly Heated Tubes in Which the Critical Heat Flux Has Been Exceeded. Harwell: Tech. Rep. REP/AERE-R-5373, Atomic Energy Research Establishment, Harwell, Eng.
Cheng, X., Feuerstein, F., Klingel, D., and Yu, D. L. (2018). Mechanistic Prediction of post Dryout Heat Transfer and Rewetting. Kerntechnik 83 (3), 203–207. doi:10.3139/124.110872
Cheng, X., Ma, X., Lu, P., Wang, W., and Liu, S. (2020). Thermal Dynamic Analyses of the Primary Heat Transfer System for the Wccb Blanket of Cfetr. Fusion Eng. Des. 161, 112067. doi:10.1016/j.fusengdes.2020.112067
Era, A., Gaspari, G., Hassid, A., Milani, A., and Zavattarelli, R. (1966). Heat Transfer Data in the Liquid Deficient Region for Steam-Water Mixtures at 70 Kg/cm2 Flowing in Tubular and Annular Conduits. Italy: Tech. Rep. No. 11, Centro Informazioni Studi Esperienze.
Evans, D., Webb, S., and Chen, J. (1983). Measurements of Axially Varying Non-equilibrium in post Critical-Heat-Flux Boiling in a Vertical Tube. United States: Tech. Rep. NUREG/CR-3363, Lehigh Univ., USA. Inst. of Thermo-Fluid Engineering and Science.
Fan, W., Li, H., and Anglart, H. (2020). A Study of Rewetting and Conjugate Heat Transfer Influence on Dryout and post-dryout Phenomena with a Multi-Domain Coupled Cfd Approach. Int. J. Heat Mass Transfer 163, 120503. doi:10.1016/j.ijheatmasstransfer.2020.120503
Gottula, R., Condie, K., Sundaram, R., Neti, S., Chen, J., and Nelson, R. (1985). Forced Convective, Nonequilibrium, post-chf Heat Transfer experiment Data and Correlation Comparison. United States: Tech. Rep. NUREG/CR-3193, NASA.
Groeneveld, D., Doeffler, S., Tain, R., Hammouda, N., and Cheng, S. (1997). “Fluid-to-fluid Modelling of the Critical Heat Flux and post-dryout Heat Transfer,” in Proceedings of the Experimental Heat Transfer (Brussels: Fluid Mechanics and Thermodynamics), 859–866.
Groeneveld, D. (1973). Post-dryout Heat Transfer at Reactor Operating Conditions. Ontario: Tech. Rep. AECL-4513, Atomic Energy of Canada Ltd.
Hammouda, N., Groeneveld, D. C., and Cheng, S. C. (1996). An Experimental Study of Subcooled Film Boiling of Refrigerants in Vertical Up-Flow. Int. J. Heat mass transfer 39 (18), 3799–3812. doi:10.1016/0017-9310(96)00062-2
Jin, Y., and Shirvan, K. (2021). Study of the Film Boiling Heat Transfer and Two-phase Flow Interface Behavior Using Image Processing. Int. J. Heat Mass Transfer 177, 121517. doi:10.1016/j.ijheatmasstransfer.2021.121517
Köckert, L., Badea, A. F., Cheng, X., Yu, D., and Klingel, D. (2021). Studies on post-dryout Heat Transfer in R-134a Vertical Flow. Int. J. Adv. Nucl. Reactor Des. Tech. 3, 44–53. doi:10.1016/j.jandt.2021.05.001
Köckert, L., Feuerstein, F., Yu, D., Klingel, D., and Cheng, X. (2018). “Experimental Study of post-dryout Heat Transfer and Rewetting in a R- 134a Cooled Vertical Tube at Comparable Water Cooled Reactor Pressure Conditions,” in The 12th International Topical Meeting on Reactor Thermal-Hydraulics, Operation, and Safety (NUTHOS-12) (Qingdao (China): Chinese Nuclear Society).
Li, H., and Anglart, H. (2016). Prediction of Dryout and post-dryout Heat Transfer Using a Two-phase Cfd Model. Int. J. Heat Mass Transfer 99, 839–850. doi:10.1016/j.ijheatmasstransfer.2016.04.021
Liu, Q., Sun, H., Liu, Y., Kelly, J., and Sun, X. (2021). Experimental Study of post-chf Heat Transfer in a Vertical Tubular Test Section. Int. J. Heat Mass Transfer 166, 120697. doi:10.1016/j.ijheatmasstransfer.2020.120697
Nijhawan, S., Chen, J. C., Sundaram, R. K., and London, E. J. (1980). Measurement of Vapor Superheat in post-critical-heat-flux Boiling. J. Heat Transfer 102 (3), 465–470. doi:10.1115/1.3244324
Shi, J., Sun, B., Yu, X., Zhang, P., and Song, F. (2017). Modeling the Full-Range thermal-hydraulic Characteristics and post-dryout Deviation from Thermodynamic Equilibrium in Once-Through Steam Generators. Int. J. Heat Mass Transfer 109, 266–277. doi:10.1016/j.ijheatmasstransfer.2017.02.007
Varone, A. F., and Rohsenow, W. M. (1986). Post Dryout Heat Transfer Prediction. Nucl. Eng. Des. 95, 315–327. doi:10.1016/0029-5493(86)90057-9
Yoder, G. L., and Rohsenow, W. M. (1983). A Solution for Dispersed Flow Heat Transfer Using Equilibrium Fluid Conditions. J. Heat Transfer 105 (1), 10–17. doi:10.1115/1.3245528
Yoo, J. M., Yun, B. J., Yoon, H. Y., and Jeong, J. J. (2020). Modeling of the Droplet Entrainment Rate in the post-dryout Regime for the Analysis of a Reflood Phase. Ann. Nucl. Energ. 148, 107757. doi:10.1016/j.anucene.2020.107757
Yu, D. (2019). Analysis and Modelling of Full-Range post-dryout Heat Transfer in Vertical Tubes. Karlsruhe: Karlsruhe Institute of Technology. Ph.D. thesis. doi:10.5445/IR/1000098370
Keywords: post-dryout, LOCA, fluid-to-fluid modeling, dimensional analysis, thermal hydraulics
Citation: Yu D, Xu C, Hu C and Fan Y (2022) An Innovative Investigation on Fluid-to-Fluid Modeling of Post-Dryout Heat Transfer in Thermal Energy Systems. Front. Energy Res. 9:819060. doi: 10.3389/fenrg.2021.819060
Received: 20 November 2021; Accepted: 31 December 2021;
Published: 28 January 2022.
Edited by:
Luteng Zhang, Chongqing University, ChinaReviewed by:
Wan Sun, Chongqing University, ChinaCopyright © 2022 Yu, Xu, Hu and Fan. This is an open-access article distributed under the terms of the Creative Commons Attribution License (CC BY). The use, distribution or reproduction in other forums is permitted, provided the original author(s) and the copyright owner(s) are credited and that the original publication in this journal is cited, in accordance with accepted academic practice. No use, distribution or reproduction is permitted which does not comply with these terms.
*Correspondence: Dali Yu, ZGx5dUBpbmVzdC5jYXMuY24=
†ORCID: Dali Yu, orcid.org/0000-0002-3637-9599
Disclaimer: All claims expressed in this article are solely those of the authors and do not necessarily represent those of their affiliated organizations, or those of the publisher, the editors and the reviewers. Any product that may be evaluated in this article or claim that may be made by its manufacturer is not guaranteed or endorsed by the publisher.
Research integrity at Frontiers
Learn more about the work of our research integrity team to safeguard the quality of each article we publish.