 Houyin Long
 Hong Zeng
 Xinyi Lin
94% of researchers rate our articles as excellent or good
Learn more about the work of our research integrity team to safeguard the quality of each article we publish.
Find out more
ORIGINAL RESEARCH article
Front. Energy Res. , 12 January 2022
Sec. Sustainable Energy Systems
Volume 9 - 2021 | https://doi.org/10.3389/fenrg.2021.814888
This article is part of the Research Topic Interactions Between China’s National Emissions Trading Scheme and Electricity Market: Practices and Policies View all 27 articles
The Chinese government has adopted many policies to save energy and electricity in the chemical industry by improving technology and reforming its electricity market. The improved electricity efficiency and the electricity reform may indirectly reduce expected energy and electricity savings by decreasing the effective electricity price and the marginal cost of electricity services. To analyze the above issues, this paper employs the Morishima Elasticity of Substitution of the electricity cost share equation which is estimated by the DOLS method. The results show that: 1) There exists a rebound effect in the Chinese chemical industry, but it is quite large because the electricity price is being controlled by the government; 2) the reform of the electricity market reduces the rebound effect to 73.85%, as electricity price begins to reflect cost information to some extent; 3) there is still a lot of space for the reform to improve, and the rebound effect could be reduced further once the electricity price is adjusted to transfer the market information more correctly. In order to succeed in saving electricity and decreasing the rebound effect in the chemical industry, the policy implications are provided from perspectives of the improved energy efficiency and electricity pricing mechanism.
The 13th 5-year plan of the chemical industry has accomplished the aim of saving energy, in which energy efficiency would increase by 15% and carbon emissions would decrease by 18%, through researching and developing new technology, such as large epoxy ethane reactor and high purity lithium equipment. The International Energy Agency (IEA) proposes a definition of energy efficiency as a way of managing and restraining the increase in energy usage. The most significant part of energy is electricity, according to Lin and Tian. (2016), over the past 2 decades, the average annual growth rate of electricity demand in our country was about 10% higher than that of any other country in the world, and China is still in the process of developing, so the demand of electricity will continue to grow. Then it is necessary to save electricity and improve electricity efficiency. Electricity efficiency is divided into economic efficiency and physical electricity efficiency. An economic indicator is when a factory provides more products for the same electricity input or the same products for less electricity input. In general, improving electricity efficiency or other energy efficiency means innovating technology for electricity conservation and emissions reduction. Could electricity saving be achieved by improving electricity efficiency in China? The issue has troubled economists for a long time, because empirical studies in the United States suggest that rebound effects (REs) could partially reduce electricity savings. The research on this issue is of great significance to the improvement of China’s national emissions trading scheme, for the size of the rebound effect has a great impact on the effectiveness of the relevant policy, which would greatly affect the rationality of China’s national emissions trading scheme.
Jevons. (1866) first argued that improvements in energy efficiency would result in consuming more energy and he gave an example of iron in Sughra over the period 1830–1863, which is called “Jevons Paradox”. The paradox may to some extent reduce the size of energy conservation. The phenomenon has also been called the “rebound effect”. The importance of the rebound effect attracts more attention for designing an energy policy to reduce emissions. Khazzoom. (1980) further analyzed the rebound effect from a micro level and suggested that as long as energy service was sensitive to its marginal cost, reduction in energy use would not be equal to a decrease in energy consumption for per unit products multiplied by total output. On the macro level, Brookes. (1990), pointed out that technology progress improving electricity efficiency always promoted economic growth, and which led to consuming more energy and the failure of energy saving. In all, Khazzoom and Brookes introduced the theory of the rebound effect from perspectives of the micro and macro level, respectively. The theory was termed the K-B hypothesis by subsequent researchers. Saunders. (1992) confirmed the K-B hypothesis in the application of the neo-classical theory with Cobb-Douglas and with nested CES.
Similarly, Dubin et al. (1986) applied the econometric method and an engineering-thermal load model to analyze the rebound effect of household electricity demand and found that actual saving was equal to 87% of engineering estimates for cooling and 88–92% for heating. Moreover, Haugland. (1996) suggested that the electricity rebound effect in Norway was 40% for households and 10% for commerce. Greene. (1992) measured the rebound effect of vehicle use over the period 1966–1989 and found it was only 5–15% or less. Jones. (1993) adopted the same data as Greene. (1992) and assessed long-term rebound effects.
In practice, methods calculating the value of the rebound effect consist of the direct rebound effect, indirect rebound effect, and economy-wide effect (Greening et al., 2000).
Direct rebound effect: The decrease in effective price of an energy service due to energy efficiency improvements induces the increase in demand, which stops the reduction in energy consumption. In this paper, energy services such as heating and lighting refers to the useful work stemmed from energy conversion devices (Evans and Lester, 2009). For example, a decrease in the effective price of an air conditioner stimulates consumers to buy more or use them longer than before. Bentzen. (2004) estimated the direct rebound effect in United States manufacturing using own-price elasticity of energy and found that it was about 24%. In sum, since the decrease in the marginal cost of a service due to technology progress leads to the change in demand, energy usage relative to the service may be more than before. The direct rebound effect is the gap between them. Liu et al. (2019) developed an improved approach to measure the energy rebound effect via the elasticity of energy service consumption with respect to energy service price, analyzed the panel data of two-digit industrial sectors in China between 1994 and 2015, and worked out that the direct rebound effect for the industry was 37.0%.
Indirect rebound effect: Evans and Lester. (2009) pointed out that the indirect rebound effect has two sources: One is from the production and installment of advanced equipment prior to efficiency improvement and the other is from improvements. The former is usually neglected. Generally speaking, the indirect rebound effect refers to the latter. The lower effective price of an energy service makes users save more money, which increases the demand for other goods, and services. For instance, one may spend the cost savings from more efficient lighting system in foods. Kok et al. (2006) used an input-output energy table to evaluate the environmental load of household consumption in Netherlands. Zhang and Peng. (2017) found that the direct RE was about 68% (55%) in the low (high) income regime, and the increase in GDP per capita may help to reduce the direct RE, based on the panel data of China’s residential electricity consumption under different kinds of regimes during 2000–2013.
Economy-wide effect: Based on the relevance of all sectors, efficiency improvement of one sector would cause the adjustments in the prices and quantities of goods and services, which induces change in energy use. For example, energy efficiency improvements in paint would decrease its price and reduce the costs of manufacturers that use paint. In turn, paint manufacturers can buy the lower price of other intermediate inputs. Grepperud and Rasmussen. (2004) explored the rebound effect from a perspective of a national economy using computable general equilibrium (CGE) and drew the conclusion that manufacturing sectors had the rebound effect and others appeared to be weak.
Although the phenomenon of rebound effect is accepted, its importance is still debated. Some argue that the rebound effect is relatively important (Brookes, 1990; Saunders, 1992), while others support the opposite argument (Schipper and Grubb, 2000).
It is important for energy economics to identify the size of the rebound effect, especially for the Chinese government in the context of the global energy conservation and emissions reduction. China is still a developing country, and development remains its top priority. Meanwhile, China’s advantage in the abundance of coal leads to the present coal-dominated energy structure. And according to Lin et al., the model will not be changed in such a short period. So it is necessary to improve electricity efficiency and consider the rebound effect simultaneously.
Recently, numerous papers have conducted investigations into the Chinese rebound effect in macro and micro levels in recent years. Zhou and Lin (2007) addressed the issue using data that cover the period 1978–2004 from a perspective of the macro level. Further, Liu and Liu (2008) substituted panel data for time series data of Zhou and Lin (2007) and found that there was the largest rebound effect in the western region of China. Lin and Liu (2012) calculated that the technology-based energy rebound effect in China was 53.2% by using the data from 1981 to 2009, which means that China cannot simply rely on technical means to reduce energy consumption and emission. Wang et al. (2016) investigated the panel data of 30 Chinese provinces from 1996 to 2010 and then concluded that the long-term rebound effect of urban residential electricity was 74% while the short-term rebound effect was 72%. In micro levels, studies related to the rebound effect were conducted in different industrial sectors as well as households. Thanks to Lin and Long (2015), who simplified the form of cost function to a translog cost function, many studies were carried out by using this simplification, and then defined the rebound effect by calculating the demand elasticities. Lin and Tian (2016) figured out that the rebound effect of the light industry was approximately 37.7% by using dynamic ordinary least squares and seemingly unrelated regression methods. Lin and Zhao (2015) estimated that the rebound effect in the Chinese textile industry was about 20.99% by adopting the Morishima Elasticity of Substitution (MES) model combined with asymmetric energy prices and other econometric methods. Deng et al. (2018) studied the panel data for seven regions in China during the period 1997 to 2013, used the translog cost function model, measured the electricity rebound effect caused by electricity price, and finally concluded that the annual average rebound effects of Northeast China and South China were 60.39 and 81.47%, respectively. The rebound effect in the northwest region was at least 14.96%. Based on the consensus that technological progress will also cause a rebound effect, Ai et al. (2020) pointed out that there are two ways to achieve technological progress: Independent innovation and technology introduction. Then they discussed the size of the rebound effect of these two different ways in the Chinese electricity sector, using the panel data of the electricity industry in 30 provinces of China from 1997 to 2013, and finally concluded that independent innovation promotes electricity conservation more significantly than technology import. Lin and Zhu (2021) found that the direct rebound effect in Chinese residential electricity consumption was 48% or so by modeling the stochastic energy demand Frontier model, based on panel data from the period 2010–2018. Meng and Li. (2021) collected the data of China’s 30 provinces during the period of 2009–2018 and then used a stochastic Frontier model to estimate the direct electricity rebound effect, finally arguing that 24.79% of the effectiveness of the electricity-saving endeavors was achieved because the rebound effect was 75.21%. Apart from the translog cost function, Xin-gang and Pei-Ling. (2020) argued that the average RE of China’s residential electricity use was 84.94% based on the panel linear model. Under the background of energy subsidies reform, Hong et al. (2013) linked the rebound effect and energy subsidies, used the monetary input–output table, and analyzed the data collected for 2007 in China, finally arguing that without energy subsidies, people would decrease their demand of electricity by 15.82 million tce, complying with the assumption that energy subsidies facilitate the rebound effect. As mentioned above, the rebound effect should be estimated by calculating the elasticity of energy demand, numerous studies measured such an index with respect to energy price and assumed that price does not impact energy efficiency. This is unrealistic, so in the latest research, Li et al. (2019) estimated the elasticity of energy demand with respect to energy efficiency to explore whether China’s market-oriented reform increased the energy rebound effect, using data collected in China’s 30 provinces over the period of 2003–2013. Finally, they concluded that 20.4% of originally expected energy conservation from energy efficiency improvement would be offset by the rebound effect. And the magnitudes were even larger in regions with higher degrees of marketization. The western area showed the smallest rebound effect (8.3%), followed by the central area (18.6%), and the eastern area (33%).
Since the reform and opening up in 1978, the Chinese government has always aimed at promoting the orderly process of market-oriented transformation in various fields, and including the electricity market. No matter which country, the electric power industry has acted as a strong monopoly since its inception due to its characteristics. And according to economics, a monopoly would result in higher prices of products and the inefficiency of producers. So, it is significant to initiate reform in this industry. It is notable that, in 2015, the State Council clearly issued relevant documents to announce its ambition to gradually form an electricity market which is sound, and healthy. And this reform covered all aspects, so the year of 2015 can be seen as a turning point in the electricity market. With the slogan “regulating the middle, opening both ends”, the prices of electricity delivery and distribution were established by the central government, who took into account the cost and modest profit of the generators, and then decided a reasonable price. Apart from prices reform, the ways of reform also included loosening the restrictions of electricity consumption and electricity generation, permitting more kinds of entities to take part in electricity trade by inducing competition, making sure that the government can play a regulatory role in electricity trading services, and reducing the cross subsidies to restore the commodity attributes of electricity. All of these measures were carried out with the intention of making sure that the market can play a decisive role in allocating resources, and thus reduce electricity costs for users and improve the efficiency of the generators. Last year, the reform in the electricity power industry progressed forward with the action of canceling the mechanism of the coal-electricity linkage, and such a policy will benefit enterprise because of cost reduction. Logically, such preferred results will induce the rebound effect, so it encouraged us to carry out our research to figure out whether this reform has an effect on the electricity rebound effect.
All papers seemed to fail to consider the effect caused by reduction in electricity cost because of efficiency improvements, and did not analyze the influence of electricity market reform on the rebound effect. In order to explore whether there is a paradox in China, we choose the Chinese chemical industry, one of six energy-intensive sectors. Only a few chemical products were produced in China in 1949. At present, the Chinese chemical industry has surpassed the United States to become the largest producer in the whole world. Its electricity consumption surged from 49 billion KW h in 1980 to 542.738 billion KW h in 2019 to support the increase in the total value of output of the chemical industry from 32 billion to 1,198 billion between 1980 and 2019, and it is expected that China will account for 50% of the world’s total chemical production by 2030 (China Chemical News-weekly). Currently, as far as chemical production, China is ranked first and in the short term, it is still in the stage of expanding due to the fact that China is a developing country, and so it is meaningful to investigated the rebound effect in China’s chemical industry. In this paper, we only measure the rebound effect of one sector, so we use the same method as Bentzen. (2004).
There are two innovations in this paper. First, it analyzes the direct electricity rebound effect of the Chinese chemical industry for the first time combined with the reform of the electricity market. Second, due to the particularity of China’s actual situation, this paper includes the impact of the 13th Five-Year Plan into the analysis of the rebound effect. A comparative analysis of the rebound effect before and after 2015 is made in this paper for the first time.
The structure of this paper is divided into four sections. Section 1 provides a brief introduction of the rebound effect; section 2 contains a brief and intuitive overview of the model; results are shown and discussed in section 3; and section 4 summarizes the results and conclusions and provides policy implications.
In this study, we briefly introduce the theoretical model used to measure the rebound effect in the chemical sector. First of all, a production function may be established to address an economic issue. In general, capital and labor are placed into the function as input factors. Seeing that we aim at estimation of the rebound effect, energy as an important input factor is put into the function. A function introduced by Jorgenson (1987) including capital (K), labor (L), energy (E), and other inputs (O) is applied as the production function of the Chinese chemical industry as follows:
Where
There are many kinds of production functional specifications, such as the Cobb-Douglas (CD) function, and CES function. In this paper, the reason why the translog function is selected is it is easy to estimate and is changed into the CD or CES function by limiting the value of parameters.
If f is a neoclassical production function and the prices of all inputs are given, by the Shepherd duality theorem, and the cost functions are accessed as follows:
Where
The factor demands and the price effects of inputs can be acquired by the first derivatives and the second derivatives of the cost function, respectively (Kim 1992). Urga (1999) claimed that technological progress is not neutral. By Shepard’s lemma, the factor demand function can be acquired by differentiating Eq. 2 with respect to input prices, that is:
We can access the cost share equations by differentiating
There are three constraints among the parameters as follows (Guo et al., 2010):
The add constraint:
The homogeneity constraint:
The Symmetry Constraint:
Tao et al. (2009) asserted that if the sum of
Since the same method as Bentzen (2004) to calculate the estimation of the rebound effect is used in the literature, we overview the price and substitution elasticities in terms of the estimated coefficients. Uzawa (1962) suggested that the Allen-Uzawa Elasticity of Substitution (AES) (Allen, 1938) can be achieved based on the cost share functions. The substitution may be expressed as:
According to the cost function, we can have
The own-price elasticity of demand for the ith input factor is
Blackorby and Russell (1989) provided the weakness of AES. For example, it could not measure curvature or ease of substitution and provide information about relative factor shares. In all, AES does not show the substitution rate between two factors. As a result, we replace AES with MES. Morishima (1967) established the MES model to estimate the impacts of changes in price or quantity rations on relative factor shares. Compared to AES, MES removes inconsistent results from time data, and cross sectional data, respectively.
If
The improved energy efficiency results in the reduction in demand for energy at the given output for a consumer, while efficiency improvements reduces the price of energy compared to other inputs. Based on the minimizing cost, the consumer would substitute energy for other inputs, and which leads to the increase in energy usage. As a result, energy saving is less than expected. The improvement in energy efficiency causes the decrease in effective price of energy and energy consumption increases due to substitution among factors. That is to say, the rebound effect is closely correlative with energy price, especially with the reduction price (Sorrel and Dimitropoulos,. 2008; Sorrel. 2009).
To accurately evaluate the electricity rebound effect of the chemical industry, the original electricity price is decomposed into three parts, and which is the same as Gately and Huntington (2002). They decomposed the log of electricity price into four components: log of energy price in 1980; the maximum historical price; cumulative reduction in the log of electricity price; and cumulative sub-maximum increases in the log of energy price.
Where
Because the data of electricity price in China are inaccessible and unattainable, we construct electricity price according to the marketing price of coal, electricity, and oil in 2011 from the CEIC database and energy structure including coal, electricity, and oil and so on. We convert them into standard coal.
Estimation of capital stock is a difficult and important issue in economic analysis. A method called the perpetual inventory method (PIM) which was proposed by Goldsmith in 1951 is the most popular. There is lots of literature on exploring China’s capital stock of industry (Zhang., 1991; He, 1992; Chow., 1993; Young, 2003; Zhang., 2002; Gong and Xie, 2004 etc.). He (1992) measured productive and non-productive capital in terms of cumulative indicators. Chow (1993) evaluated China’s actual net investment based on national income accounting. Chen (2011) calculated economic indicators of every Chinese industrial sector between 1980 and 2008, including capital stock, the added value, the number of employees, and the total value of output, and so on. In this study, we expand data for the chemical industry in Chen’s paper and choose 1980 as the base year.
Before giving the result, we provide a brief introduction of the perpetual inventory method (PIM) and we assume that the relative efficiency of capital geometrically decreases over time. Based on the assumption, a depreciation rate is equivalent to a replacement rate. The estimation of capital stock is expressed as the following formula:
Where
(i) Investment: In general, total investment in fixed assets, newly increased fixed assets investment, and or gross fixed capital formation is often chosen as a nominal investment. In the light of the consistency of data, newly increased fixed assets investment is used as a nominal investment, like Chen (2011). The data of nominal investment are calculated by the difference of the original value of fixed assets. The data source of the original value of fixed assets is the China Statistical Yearbook.
(ii) Capital stock at the base year: There are two approaches to estimate capital stock at the base year. One is a hypothesis that the capital-output rate is 3 (Zhang 1991); the other is the value of investment divided by the sum of the growth rate and the depreciation rate to measure capital stock (Hall and Jones, 1999). Young (2003) evaluated China’s capital stock using the same approach as Hall and Jones (1999). We directly employ the capital stock in 2008 from Chen (2011) as the base year and expand it to 2019.
(iii) Depreciation rate: Yongfeng et al. (2002) reviewed and summarized the literature and drew the conclusion that depreciation rates of building, equipment, and others were 6.9, 14.9, and 12.2%, respectively. Zhang et al. (2004) summarized all depreciation rates associated with capital share and found that it should be 9.6% of Chinese industry. The same depreciation rate as Zhang et al. (2004) is chosen in this paper to make the process of calculation easy.
(iv) Price index of fixed-asset investment: These data can be easily derived from the China Statistical Yearbook.
We can derive the account of energy consumption from the China Statistical Yearbook and China Energy Statistical Yearbook that cover the period 1980–2019.
Data for the number of employees during 1980–2019 stem from the China Labor Statistical Yearbook. Due to the variation of statistical caliber, we combine the sequences of the number of employees before and after the time when the caliber was changed into a complete annual average of employee series. The specific method, which was adopted in Chen. (2011), is too complex to describe briefly. Therefore, it is omitted here.
The added value is not described by the China Statistical Yearbook after 2007. But the Statistical Bulletin of National Economic and Social Development from 2008 to 2019 shows the growth rate of the added value in every sector. As a result, the added value could be accessed. Then we employ the same method as Chen (2011) and conduct the extension.
The final energy consumption in the chemical industry consists of coal, electricity, and oil. What this paper focuses on is the electricity consumption of the Chinese chemical industry, but data for electricity prices in China are not accessible, and attainable. Accordingly, we construct the electricity price based on the electricity price in 2011 using the price index. That is to say, we use the price index based on 1980 and the electricity price in 2011 to calculate the electricity price from 1980 to 2019 according to the variation of the price index.
In this paper, we make use of the average wage of employees as labor price, and then adjust it in terms of the price index at the constant price for 1980. Data for labor price come from the China Labor Statistical Yearbook.
The price of capital is determined by depreciation rate, tax rate, interest rate, and other factors (Romer, 1999). This article employs the method from Romer to conduct the estimation about capital price of Chinese industry. The specific formula is listed as follows:
Where
We assume that the market price of capital is equal to 1,
The nominal interest rate is the average annual loan interest rate from CEIC and the China Financial Statistical Yearbook. There are many indicators used as the inflation rate, such as consumer price index (CPI), producer price index (PPI), GDP deflator, and index numbers of wholesale prices. We choose GDP deflator as the inflation rate because of the capital price of the industrial sector (Guo et al., 2010).
The other intermediate input is intermediate input except energy. Because electricity price has been acquired, can we also use other input price? According to the input-output table, we can obtain the input structure. Unfortunately, we still do not know the comprehensive price of every input sector. Therefore, we assume that the price is always equal to 1.
The total cost of other intermediate input can be obtained in terms of the input-output table and be expressed as:
Where
In sum, the input share can be listed in terms of the above analysis as follows:
According to the above analysis, we can calculate the value of every variable which is summarized and listed in Table 1. The share of labor share is smallest; capital share and electricity share are 0.1879 and 0.2615, respectively, and their standard deviations are 0.0877 and 0.1438, which suggests that the two variables are relatively stable. The mean of the added value is 14,800,000, and the minimum is in 1980 and maximum is in 2019.
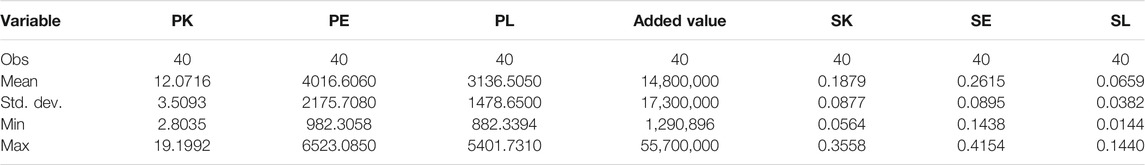
TABLE 1. The value of every variable.
Hall (1986) pointed out that Eq. 4 is not directly estimated, for most variables have no long-run co-integration. When the translog system of equation is used, only few studies consider the problem of non-stationary variables (Christopoulos and Tsionas, 2002; Masih and Masih 1996) Hence, prior to measuring the parameters value of Eq. 4, a unit root test is implemented to examine and inspect whether variables are all stationary. The input price in Table 2 is the relative price. In other words, they are evaluated according to Eq. 4. As seen in Table 2, all variables except lnADD and lnPL are I (1) in terms of the ADF test.
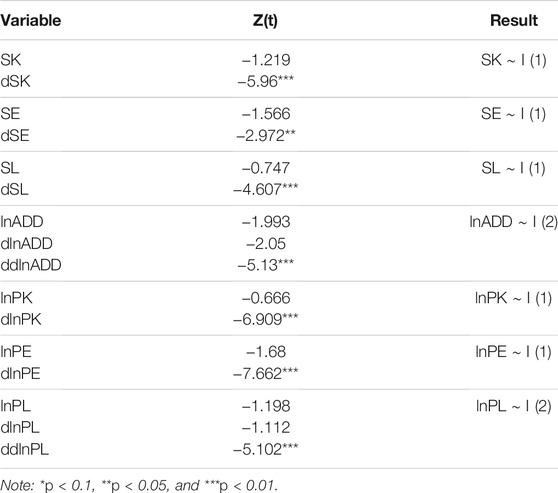
TABLE 2. Unit root test.
Because the order of all variables is not the same, Engel Granger (EG) and Johansen (JJ) co-integrated methods cannot be employed to estimate parameters of Eq. 4. A new approach, called the dynamic OLS procedure (DOLS), was proposed to derive the long-run co-integrated relationship between variables which have different and higher orders of integration (Stock and Watson 1993). Different from the EG approach and JJ approach, DOLS does not demand that all variables have the same orders of integration. By comparison of the three approaches, DOLS is appropriate and applicable. We adopt the DOLS method into Eq. 4 and get the following formula:
Where Δ represents the first difference.
Now we start to estimate parameters using DOLS. The results are presented in Table 3, excluding the coefficients of the leads and lags of the first order due to the number of variables.
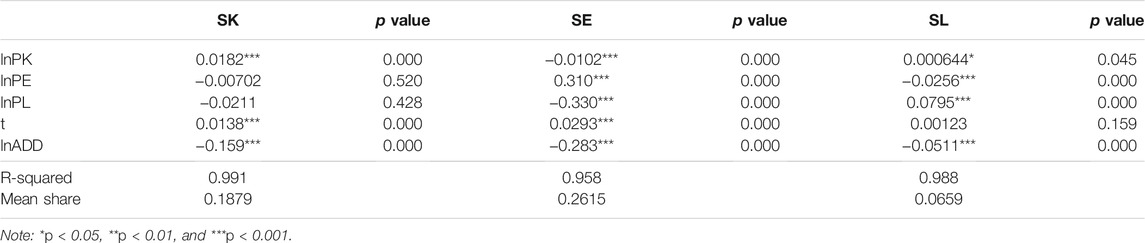
TABLE 3. The results of cost share equations.
As seen in Table 3, although the coefficients of lnPE and lnPL in the capital share equation are not significant, the parameters of electricity cost share equation and labor cost share equation are significant at the 5% confidence level. Especially for electricity cost share equation, which is that we care about most, all parameters are of significance at the 0.1% confidence level. That is to say, we may use the model to estimate the own-price elasticity of energy cost.
To get the elasticity of effective price, we should decompose electricity price according to Eq. 6. Decomposition of electricity price is obtained from three decomposed formulas.
Based on the decomposition of electricity price, we substitute four prices into Eq. 10 for electricity price and use DOLS again to estimate the equation. The results are specified in Table 4. Because we focus on the rebound effect, the estimation of electricity cost share is listed. According to the method from Bentzen (2004), we calculate the rebound effect using the self-price elasticity of lnPcut.
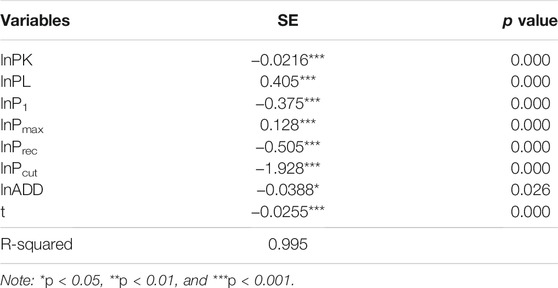
TABLE 4. The results of electricity cost share with decomposed prices.
Table 4 describes the main estimated parameters which are significant under the 5% confidence level. The rebound effect of China’s chemical industry is 811.13%, which illustrates that the electricity price is not able to accurately reflect the real cost and the supply and demand of the market under the control of China, so the rebound effect is quite large.
In order to study the differences of the rebound effect in the two periods separated by the time of 2015 when the thirteenth Five-Year Plan and the reform of electricity market began, we construct a dummy variable t2015, adding it to Eq. 10. Before 2015, t2015 equals 0. When year ≥2015, t2015 equals 1. The new results of electricity cost share with decomposed prices are shown in Table 5.
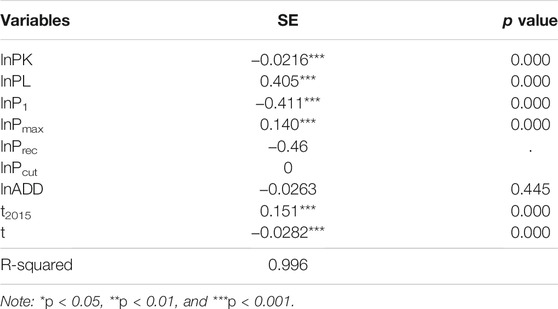
TABLE 5. The new results of electricity cost share with decomposed prices.
It can be seen from Table 5, t2015 is of significance at 0.1%, and its coefficient 0.151 is positive, which means that the cost share of electricity increases after 2015 because a series of punitive policies were adopted against the chemical industry to reduce the emission of carbon. The reform of the electricity market, aiming at improving the electricity pricing mechanism to better transfer market information, and may be another reason why the coefficient of t2015 is positive. However, the coefficient of lnPrec is not significant and lnPcut should be omitted. This may be due to China’s government pricing policy. Chinese electricity price is controlled by the government and could not reflect true costs and the supply and demand of the market. Therefore, lnPrec and lnPcut decomposed from the electricity price with stable growth are fixed values in most years, which cannot really reflect the impact of electricity price on the cost share of electricity. When calculating the rebound effect of China’s chemical industry with the coefficient of lnPcut being 0, the result is 73.85%, which is a sharp weakening compared with the result before. It means that the reform of the electricity market has achieved certain results, for electricity price began to reflect cost information to some extent, and which reduced the rebound effect to 73.85%. However, the rebound effect is still too large. There is still a lot of space for the reform to improve, and the rebound effect could be reduced further once the electricity price is adjusted to transfer market information more correctly by the reform.
The reasons why the rebound effect exists are as follows:
1) External substitution of factors.
Because technological progress decreases energy intensity or increases energy efficiency, the same products are provided with less electricity input. The improvement of energy efficiency decreases actual electricity price. Because of the existence of the substitution effect, the decrease in electricity price stimulates manufacturers to use more electricity and fewer other factor inputs. This partially reduces the electricity saving.
2) Electricity pricing mechanism in China.
The Chinese electricity price is controlled and regulated by the Chinese government and does not reflect market supply and demand. Electricity price only includes internal cost but omits external cost. Electricity price under the control of a visible hand is usually lower than the market price, which encourages consumers to consume more energy. At the same time, low electricity price and the relevant subsidy prevent producers from investing to improve energy efficiency and encourage them to buy electricity-intensive equipment to replace labor with electricity.
This study analyzes the direct rebound effect of the Chinese chemical industry for the first time in terms of a translog cost function where the DOLS method is employed. The improved energy and electricity efficiency caused by technological progress indirectly decreases the effective electricity price and the marginal cost of energy services which reduces expected energy savings. As a result, the rebound effect is highly correlated with the electricity price elasticity. Bentzen (2004) pointed out that the size of the rebound effect is equal to the electricity-price elasticity obtained from the Morishima Elasticity of Substitution of the electricity cost share equation. The decomposition method of energy price proposed by Gately and Huntington (2002) is adopted and placed into the equation of electricity cost share.
We draw the conclusion that the rebound effect in the chemical industry is 811.13%. However, it would decrease to 73.85% between 2015 and 2019 because the reform of the electricity market was under way from 2015. That is to say, it is hard to reduce emission by improving energy efficiency because the real price of electricity would decrease a lot due to the large rebound effect, which may result in a large increase in electricity consumption. However, considering the strict regulation on the chemical industry to reduce the emission of carbon, it is possible to decrease the rebound effect by improving the reform of the electricity market further.
At present, research on the emissions trading scheme is very popular, and industrial electricity consumption is one of the important factors affecting carbon emissions. By studying the electricity rebound effect of the chemical industry, we know more about the changing relationship between electricity efficiency, electricity price, and electricity consumption, which is of great significance to the improvement of China’s national emissions trading scheme.
Based on the above analysis, we suggest the following policy implications:
1) The value of the rebound effect indicates that China’s policy designed for energy saving and emissions reduction in the chemical sector aims at improving energy efficiency by research and development and introducing the advanced technology of developed countries.
i The government sets higher standards of energy efficiency for new factories and eliminates backward production capacity, therefore the electricity intensity will be reduced by 10% in 2025.
ii Chemical enterprises, as the main participants for innovation, should be supported by the Chinese tax policy. Enterprises are stimulated by reducing or remitting taxes to research and develop advanced technology. Specific measures are suggested by learning from foreign experience, for example Japan and the United States.
iii Risk funds of R&D are established by the ministry of industry and information technology to provide a loan for small and medium chemical enterprises which cannot attain a loan from a bank. Loan period and loan quota are set by the government. When enterprises repay the loan, they should be required to pay interest to the ministry. Because China’s state-owned bank is unwilling to provide loans for small and medium enterprises, the fund plays an important role in their research and development.
iv Because there are lots of small and medium enterprises and the majority lack technical experts, the ministry actively promotes the cooperation between enterprises and universities. The government may provide financial assistance. For instance, 10–50% of R&D cost is afforded.
v To reduce the risk of R&D and provide a market for innovative products, the Chinese government and state-owned enterprises are required to buy their products, which contributes to upgrading the chemical industrial structure and promoting technical innovation and product innovation.
2) Electricity price is another effective factor influencing the rebound effect. The improved energy efficiency and market electricity pricing mechanism are the most effective measures to save energy and reduce emissions. Unfortunately, Chinese electricity price does not reflect supply and demand because of the incomplete electricity reform. Lower electricity price encourages enterprises to overuse electricity. Besides, the recent power rationing is highly related to the difficult transmission mechanism of electricity price. Therefore, at present, a transparent and reasonable pricing mechanism needs to build, which would allow the price to go up and down in a certain range. The pricing mechanism reflects not only internal cost, but also the scarcity of resources and environmental cost. What is more, private enterprises are unwilling to enter into the electricity sector, because the electricity price would mean no benefits. A transparent and reasonable pricing mechanism can provide opportunities for them to go into electricity production. Private enterprises can ensure that the supply side of electricity is competitive to help allocate resources.
Publicly available datasets were analyzed in this study. This data can be found here: http://www.stats.gov.cn/tjsj/ndsj/, https://data.cnki.net/yearbook/Single/N2021050066, https://data.cnki.net/yearbook/Single/N2021020042, https://data.cnki.net/yearbook/Single/N2020070552, and https://www.ceicdata.com/zh-hans.
HL: Propose innovative points and be responsible for model building and analysis. HZ: Responsible for data processing and text content writing. XL: Responsible for variable selection and literature review.
This work is supported by National Natural Science Foundation of China (Grant no. 72003033), Natural Science Foundation of Fujian Province (Grant no. 2020J05123) and the project of Fuzhou University (Grant no. GXRC202005 and Grant no. GXRC202104).
The authors declare that the research was conducted in the absence of any commercial or financial relationships that could be construed as a potential conflict of interest.
All claims expressed in this article are solely those of the authors and do not necessarily represent those of their affiliated organizations, or those of the publisher, the editors and the reviewers. Any product that may be evaluated in this article, or claim that may be made by its manufacturer, is not guaranteed or endorsed by the publisher.
Ai, H., Wu, X., and Li, K. (2020). Differentiated Effects of Diversified Technological Sources on China's Electricity Consumption: Evidence from the Perspective of Rebound Effect. Energy Policy 137, 111084. doi:10.1016/j.enpol.2019.111084
Bentzen, J. (2004). Estimating the Rebound Effect in US Manufacturing Energy Consumption. Energ. Econ. 26 (1), 123–134. doi:10.1016/s0140-9883(03)00047-1
Blackorby, C., and Russell, R. R. (1989). Will the Real Elasticity of Substitution Please Stand up?(A Comparison of the Allen/Uzawa and Morishima Elasticities). Am. Econ. Rev., 882–888.
Brookes, L. (1990). The Greenhouse Effect: The Fallacies in the Energy Efficiency Solution. Energy Policy 18 (2), 199–201. doi:10.1016/0301-4215(90)90145-t
Chen, S. Y. (2011). Reconstruction of Sub-industrial Statistical in China (1980-2008). China Econ. Q. 10 (3), 735–776. doi:10.13821/j.cnki.ceq.2011.03.012
Chow, G. C. (1993). Capital Formation and Economic Growth in China. Q. J. Econ. (8), 809–842. doi:10.2307/2118409
Christopoulos, D. K., and Tsionas, E. G. (2002). Allocative Inefficiency and the Capital-Energy Controversy. Energ. Econ. 24, 305–318. doi:10.1016/s0140-9883(02)00020-8
Deng, C., Li, K., Peng, C., and Han, F. (2018). Analysis of Technological Progress and Input Prices on Electricity Consumption: Evidence from China. J. Clean. Prod. 196, 1390–1406. doi:10.1016/j.jclepro.2018.06.103
Dubin, J. A., Miedema, A. K., and Chandran, R. V. (1986). Price Effects of Energy-Efficient Technologies: A Study of Residential Demand for Heating and Cooling. RAND J. Econ. 17 (3), 310–325. doi:10.2307/2555713
Evans, J., and Lester, C. (2009). Hunt International Handbook on the Economics of Energy Printed and Bound by. UK: MPG Books Group, 206.
Gately, D., and Huntington, H. G. (2002). The Asymmetric Effects of Changes in price and Income on Energy and Oil Demand. Energ. J. 23 (1), 19–55. doi:10.5547/issn0195-6574-ej-vol23-no1-2
Gong, L. T., and Xie, D. Y. (2004). Factor Mobility and Dispersion in Marginal Products a Case on China. Econ. Res. (1), 45–53. doi:10.1007/s11459-005-0006-x
Greene, L. D. (1992). Vehicle Use and Fuel Economy: How Big Is the ‘Rebound’ Effect? Energy J 12 (1), 117–143.
Greening, L. A., Greene, D. L., and Difiglio, C. (2000). Energy Efficiency and Consumption—The Rebound Effect—A Survey. Energy Policy 28 (6-7), 389–401. doi:10.1016/s0301-4215(00)00021-5
Grepperud, S., and Rasmussen, I. (2004). A General Equilibrium Assessment of Rebound Effects. Energ. Econ. 26 (2), 261–282. doi:10.1016/j.eneco.2003.11.003
Guo, J., Guo, C. H., and Ling, Y. (2010). Estimating the Rebound Effect in China Industrial Sector Energy Consumption. J. Quantitative Tech. Econ. (11), 114–127. doi:10.13653/j.cnki.jqte.2010.11.006
Hall, R. E., and Jones, C. I. (1999). Why Do Some Countries Produce So Much More Output Per Worker Than Others? Q. J. Econ. 114 (1), 83–116. doi:10.1162/003355399555954
Hall, V. B. (1986). Major OECD Country Industrial Sector Interfuel Substitution Estimates, 1960-1979. Energ. Econ. 8, 74–89. doi:10.1016/0140-9883(86)90032-0
Haugland, T. (1996). Social Benefits of Financial Investment Support in Energy Conservation Policy. Energ. J 17 (2), 79–102. doi:10.5547/issn0195-6574-ej-vol17-no2-5
Hong, L., Liang, D., and Di, W. (2013). Economic and Environmental Gains of China's Fossil Energy Subsidies Reform: A Rebound Effect Case Study with EIMO Model. Energy Policy 54, 335–342. doi:10.1016/j.enpol.2012.11.045
Jones, T. C. (1993). Another Look at US Passenger Vehicle Use and the Rebound Effect from Improved Fuel Efficiency. Energ. J 4 (14), 99–110. doi:10.5547/issn0195-6574-ej-vol14-no4-6
Khazzoom, J. D. (1980). Economic Implications of Mandated Efficiency Standards for Household Appliances. Energ. J. 1 (4), 21–40. doi:10.5547/issn0195-6574-ej-vol1-no4-2
Kim, H. Y. (1992). “The Translog Production Function and Variable Returns to Scale. Rev. Econ. Stat. 3 (47), 546–552. doi:10.2307/2109500
Kok, R., Benders, R. M. J., and Moll, H. C. (2006). Measuring the Environmental Load of Household Consumption Using Some Methods Based on Input-Output Energy Analysis: A Comparison of Methods and a Discussion of Results. Energy Policy 34 (17), 2744–2761. doi:10.1016/j.enpol.2005.04.006
Li, J., Liu, H., and Du, K. (2019). Does Market-Oriented Reform Increase Energy Rebound Effect? Evidence from China's Regional Development. China Econ. Rev. 56, 101304. doi:10.1016/j.chieco.2019.101304
Lin, B., and Liu, X. (2012). Dilemma between Economic Development and Energy Conservation: Energy Rebound Effect in China. Energy 45 (1), 867–873. doi:10.1016/j.energy.2012.06.077
Lin, B., and Long, H. (2015). A Stochastic Frontier Analysis of Energy Efficiency of China's Chemical Industry. J. Clean. Prod. 87, 235–244. doi:10.1016/j.jclepro.2014.08.104
Lin, B., and Tian, P. (2016). The Energy Rebound Effect in China's Light Industry: a Translog Cost Function Approach. J. Clean. Prod. 112, 2793–2801. doi:10.1016/j.jclepro.2015.06.061
Lin, B., and Zhao, H. (2015). Energy Efficiency and Conservation in China's Chemical Fiber Industry. J. Clean. Prod. 103, 345–352. doi:10.1016/j.jclepro.2014.06.070
Lin, B., and Zhu, P. (2021). Measurement of the Direct Rebound Effect of Residential Electricity Consumption: An Empirical Study Based on the China Family Panel Studies. Appl. Energ. 301, 117409. doi:10.1016/j.apenergy.2021.117409
Liu, H., Du, K., and Li, J. (2019). An Improved Approach to Estimate Direct Rebound Effect by Incorporating Energy Efficiency: A Revisit of China's Industrial Energy Demand. Energ. Econ. 80, 720–730. doi:10.1016/j.eneco.2019.02.012
Liu, Y. Y., and Liu, F. C. (2008). Rebound Effect of Energy Consumption Due to Technological Progress: Empirical Analysis Based on Provincial Panel Data in China. Resour. Sci. (09), 1300–1306. doi:10.3321/j.issn:1007-7588.2008.09.003
Masih, R., and Masih, A. M. M. (1996). Stock-Watson Dynamic OLS (DOLS) and Error-Correction Modelling Approaches to Estimating Long- and Short-Run Elasticities in a Demand Function: New Evidence and Methodological Implications from an Application to the Demand for Coal in mainland China. Energ. Econ. 18, 315–334. doi:10.1016/s0140-9883(96)00016-3
Meng, M., and Li, X. (2021). Evaluating the Direct Rebound Effect of Electricity Consumption: An Empirical Analysis of the Provincial Level in China. Energy 239, 122135. doi:10.1016/j.energy.2021.122135
Saunders, H. D. (1992). The Khazzoom–Brookes Postulate and Neoclassical Growth. Energ. J. 13 (4), 131. doi:10.5547/issn0195-6574-ej-vol13-no4-7
Schipper, L., and Grubb, M. (2000). On the Rebound? Feedback between Energy Intensities and Energy Uses in IEA Countries. Energy Policy 28 (6–7), 367–388. doi:10.1016/s0301-4215(00)00018-5
Sorrell, S., and Dimitropoulos, J. (2008). The Rebound Effect: Microeconomic Definitions, Limitations and Extensions. Ecol. Econ. 65 (3), 636–649. doi:10.1016/j.ecolecon.2007.08.013
Sorrell, S. (2009). “The Rebound Effect: Definition and Estimation,” in International Handbook on the Economics of Energy, Chapter 9 (Cheltenham, UK: Edward Elgar Publishing).
Stock, J. H., and Watson, M. W. (1993). A Simple Estimator of Cointegrating Vectors in Higher Order Integrated Systems. Econometrica 61, 783–820. doi:10.2307/2951763
Tao, X. M., Xing, J. W., and Huang, X. (2009). The Measurement of Energy Price Distortions and Factor Substitution in Chinese Industry[J]. J. Quant. Tech. Econ. 26 (11), 3–16. doi:10.1093/molbev/msn221
Urga, G. (1999). An Application of Dynamic Specifications of Factor Demand Equations to Interfuel Substitution in US Industrial Energy Demand [J]. Econ. Model. (4). doi:10.1016/S0264-9993(99)00012-7
Uzawa, H. (1962). Production Function with Constant Elasticities of Substitution. Rew.Econ. Statis. 4 (44), 291–299. doi:10.2307/2296305
Wang, Z., Han, B., and Lu, M. (2016). Measurement of Energy Rebound Effect in Households: Evidence from Residential Electricity Consumption in Beijing, China. Renew. Sustain. Energ. Rev. 58, 852–861. doi:10.1016/j.rser.2015.12.179
Xin-gang, Z., and Pei-ling, L. (2020). Is the Energy Efficiency Improvement Conducive to the Saving of Residential Electricity Consumption in China? J. Clean. Prod. 249, 119339. doi:10.1016/j.jclepro.2019.119339
Yongfeng, H., Ruoen, R., and Xiaosheng, L. (2002). Capital Stock Estimates in Chinese Manufacturing by Perpetual Inventory Approach. China Econ. Q. 2 (1), 377–396.
Young, A. (2003). Gold into Base Metals: Productivity Growth in the People’s Republic of China during the Reform Period. J. Political Econ. 111 (6), 1220–1261. doi:10.3386/w7856
Zhang, J. (2002). Growth Capital Formation and Technological Choice: Why Has China‘s Economic Growth Rate Been Declining? Q. J. Econ. 1 (2), 301–338.
Zhang, J. K. (1991). Comprehensive Analysis of Economic Benefits during the 7th Five-Year Plan Econ. Res. (2), 8–17.
Zhang, J., Wu, G. Y., and Zhang, J. P. (2004). Estimation on China‟s Provincial Material Capital Stock: 1952-2000. Econ. Res. J. 10, 35–44.
Zhang, Y.-J., and Peng, H.-R. (2017). Exploring the Direct Rebound Effect of Residential Electricity Consumption: an Empirical Study in China. Appl. Energ. 196, 132–141. doi:10.1016/j.apenergy.2016.12.087
Keywords: electricity rebound effect, electricity efficiency, electricity price elasticity, chemical industry, the morishima elasticity of substitution
Citation: Long H, Zeng H and Lin X (2022) The Electricity Rebound Effect: Empirical Evidence From the Chinese Chemical Industry. Front. Energy Res. 9:814888. doi: 10.3389/fenrg.2021.814888
Received: 14 November 2021; Accepted: 14 December 2021;
Published: 12 January 2022.
Edited by:
Xin Yao, Xiamen University, ChinaReviewed by:
Chengjin Ye, Zhejiang University, ChinaCopyright © 2022 Long, Zeng and Lin. This is an open-access article distributed under the terms of the Creative Commons Attribution License (CC BY). The use, distribution or reproduction in other forums is permitted, provided the original author(s) and the copyright owner(s) are credited and that the original publication in this journal is cited, in accordance with accepted academic practice. No use, distribution or reproduction is permitted which does not comply with these terms.
*Correspondence: Xinyi Lin, MzQyMjQxNTI4QHFxLmNvbQ==
Disclaimer: All claims expressed in this article are solely those of the authors and do not necessarily represent those of their affiliated organizations, or those of the publisher, the editors and the reviewers. Any product that may be evaluated in this article or claim that may be made by its manufacturer is not guaranteed or endorsed by the publisher.
Research integrity at Frontiers
Learn more about the work of our research integrity team to safeguard the quality of each article we publish.