 Jianxi Wang
 Shida Zhang
 Yonghui Sun
 Xinye Du1
94% of researchers rate our articles as excellent or good
Learn more about the work of our research integrity team to safeguard the quality of each article we publish.
Find out more
ORIGINAL RESEARCH article
Front. Energy Res. , 02 February 2022
Sec. Smart Grids
Volume 9 - 2021 | https://doi.org/10.3389/fenrg.2021.814850
This article is part of the Research Topic Integration and Digitalization of Urban Energy Systems View all 9 articles
In this paper, the probabilistic model of the controllable distributed generation in active distribution network is developed and applied to the daily stochastic optimal dispatch. The probabilistic characteristics of photovoltaic power generation system with active control capability are explored, and the relationship between the reference value of active power and its cumulative distribution function and mean value is obtained. The active power probability model of wind power generation system is improved according to the actual wind speed power curve. By fully utilizing the inverter capacity and coordinating active power, the reactive power of distributed generation is actively controlled under the constraint of power factor. Then considering the chance constraints, a daily optimal scheduling model for active distribution network with the goal of minimizing the operating cost of distribution network is developed, and the constraints that can calculate the charge and discharge times of the energy storage system are designed. The chance constrained programming is solved by the heuristic method, and the deterministic optimization steps are solved by the second-order cone programming method, respectively. The probabilistic power flow method based on stochastic response surface method is utilized to test chance constraints. Finally, the modified IEEE33 node distribution system example shows that the obtained models and algorithms are correct and can meet the requirements of safe and economic operation.
Although the distribution network (DN) is the last part of the power system where the electricity is delivered to the end users, it shoulders the whole task of the final consumption of electricity. The construction and operation of DN directly affect the supply quality of all power users as well as the efficiency of power grid. As an important part of renewable energy technology, DG plays an important role in DN. The distributed generation (DG) is directly connected to DN, closing to the load point. It can provide the voltage support and improve the controllability of DN, which creates a large and adjustable space for optimization. Active distribution network (ADN) is the future form of DN, which is a technical way to integrate DG and improve the intelligence of DN (Liu et al., 2021; Xiao et al., 2021). The ADN is not only a DN with DG but also has a number of controllable devices and a variety of control strategies. DG will take an active part in network dispatching, which will make DN have much controllability (Wang et al., 2021). In many research about ADN, optimal scheduling is a core technology to realize safe and economic operation of DN (Jin et al., 2019).
The energy coupling of the energy storage system on different time intervals along with the mixed integer control of various devices make it relatively difficult for the conventional optimal scheduling model to adapt to the ADN (Sun et al., 2021; Wu et al., 2021). Considering all kinds of controllable devices (capacitors, transformer tap, static reactive generator, DG, ESS, etc.), the optimal power flow of ADN is a complex mixed integer nonconvex linear programming problem (Jiang et al., 2018; Huang et al., 2022)). Considering the randomness of power in DG under the control strategy, the multi-time stochastic optimization of ADN will be investigated, which could be an effective method to solve the optimal scheduling problem of ADN.
The power control strategies of DG connected inverter include both active and reactive power controls. The DG should regulate active power according to the frequency of power grid and dispatching instructions, and support the grid voltage by reactive power adjustment (Safa et al., 2018; Li et al., 2019). In Zeb et al. (2018), the authors summarized the functions of the advanced grid connected inverter, and analyzed the scheduling ability and control capability of the inverter type DG. In Safa et al. (2018), the multi-functional grid connected inverter was taken to provide necessary reactive power support to DN by actual control strategy and circuit topology. The intermittent and stochastic nature of renewable power generation imposes the additional restrictions on the scheduling and control strategies. In Li et al. (2017), the self-adjusting forecasting approach for renewable generations and energy loads was proposed.
Among the active power control of the DG, the most commonly used method is maximum power point tracking (MPPT), which is a method to track the maximum active power point in real time. It is often assumed that all the DGs are running in the MPPT state. Thus, the light and wind speed follow some parameter probability density functions, and the power probability model was obtained according to the power calculation formula under the MPPT control strategy (Fares et al., 2021; Yu et al., 2022). However, it is obviously impossible to obtain a probabilistic model of DG with controllable variables in this way. For reactive power, it will be impossible to compensate reactive power flexibly when the fixed power factor strategy is adopted, and it would increase the fluctuation of the system because of the random fluctuation of the active power in DG.
Based on the above discussions, in order to make the DG participate in the DN optimization actively, in this paper, an active–reactive power decoupling control strategy for DG is presented. Considering the characteristics of DG, a controllable power probability model is proposed. In addition, a day-ahead optimal dispatch of ADN with chance constraints is also proposed. A heuristic method is utilized to solve the chance constraint programming. The step of deterministic optimization in the method adopts the optimal power flow technology based on second-order cone programming.
The remainder of this paper is organized as follows. The Probability model of controllable distributed generation section discusses the power control strategies and probability models of distributed solar and wind power generation. These models are employed in the Day-ahead optimal dispatch of active distribution networks with chance constraints section for day-ahead optimal dispatch of ADN with chance constraints. The efficiency of the proposed approach is illustrated on the modified IEEE 33-node power distribution test system in the Numerical analysis section. The concluding remarks are given in the Conclusion section.
In this paper, The DG should have the controllable ability of active power and reactive power. In the period of strong light or too high wind speed, the active power of renewable energy can be reduced properly, and the reactive power optimization can be realized by adjusting reactive power actively, simultaneously.
In order to study the stochastic optimization of ADN, the DG should be modeled first. The DG in this paper is modeled in the form of PQ nodes, so the power probability model is needed. According to the demand of active and reactive power coordinated optimization in ADN, the appropriate control strategy is discussed, and the simulation model is built and tested. Then the probability model of controlled DG is constructed by using the kernel density estimation method. The photovoltaic (PV) system and wind power generation system are considered in this paper.
In order to implement flexible power control, the control strategy of DG is different from the ordinary ones (Li et al., 2020). The DC–DC part control strategy of the PV system is as follows: set an active power reference value first; the PV generation active power is the same as the reference value when the MPPT power is higher than the reference value, and the PV active power is the same as the MPPT power when the MPPT power is lower than the reference value. The inverter connected to the grid adopts constant power control, which means that the reactive power is equal to the reactive power reference value. Thus, the active power reference value of the PV power control is determined by the above strategy, and the reactive power reference value is determined according to the result of optimal operation. Therefore, when dispatching PV, it is necessary to determine the active power reference value of the DC–DC link and the reactive power reference value of the DC–AC link.
In order to analyze the probabilistic model of PV system, the probability model of light intensity is discussed first. This paper mainly discusses the problem of daily optimal dispatch of ADNs, which is based on prediction of wind speed and illumination. Due to the limited length, it is believed that the application of reasonable prediction method can be more accurate to get the point forecast data in the many intervals of the day. Considering the prediction error and volatility of renewable energy, the PV power of a certain period of time is modeled as a random variable that obeys the normal distribution (for the PV, the mean value is the active predictive value and the standard deviation is 20% of the predictive value) (Fares et al., 2021), that is,
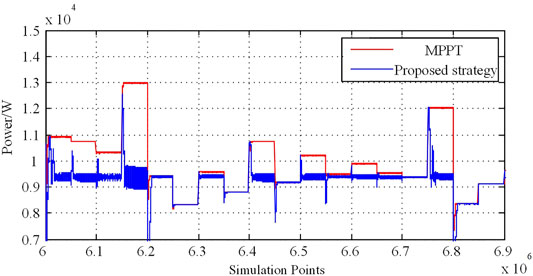
FIGURE 1. Simulation results based on maximum power point tracking (MPPT) control strategy and the proposed control strategy.
The procedure of the active power probability modeling is given as follows:
(1) The PV sequence is generated according to the predicted power probability model and normalized by the predicted power mean
(2) In the interval of 0.7 pu–1.3 pu, active reference values
(3) The photovoltaic power sequence is input into the simulation system to get the actual power
(4) The probability density function of PV power
where the subscript
The cumulative distribution function (CDF)
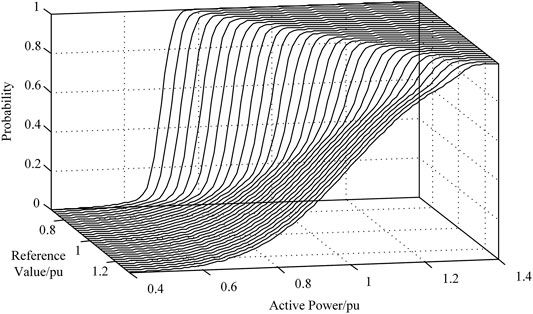
FIGURE 2. The CDF 3D image of
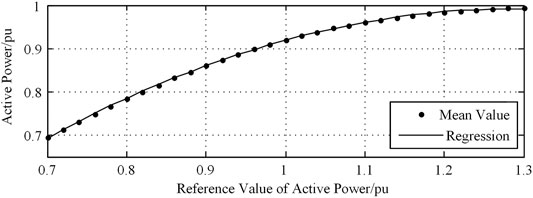
FIGURE 3. The relation between reference value and mean value of controllable photovoltaic (PV) system.
It can be seen from Figures 2 and 3 that the CDF and the mean are basically the same as the original normal distribution when
If the interpolation is performed on the 3D graph, the CDF
where
Based on the above discussion, Eq. 3 represented by the unit value can be applied to any PV system with different capacities at any time. Due to the power decoupling control, the reactive power of PV can achieve its reference value at the same time. According to the connection requirements of DG (Bai et al., 2018), the power of PV needs to meet a certain power factor, where the constraints are formulated as follows
where
According to the power decoupling control (Zeb et al., 2018), the PV reactive power can be controlled by reference value independently in this paper. Thus, the reactive power satisfies Eq. 4.
The control of
where
In this paper, we set
In this paper, the wind speed modeling with random factors is similar to that of the illumination intensity. It is considered that point prediction of wind speed in the future intervals is completed by prediction algorithm with certain accuracy, and if the random error in a period is considered as normal distribution, then the wind speed obeys the normal distribution of the mean value as the predicted value, which is expressed as
The probabilistic modeling of wind power generation system power will be studied. Many distributed wind power generation systems adopt direct drive wind turbines connected by inverter. The active power of wind power generation system is not controlled due to its complexity, and the reactive power reference value of the inverter connected to a grid is controlled solely. The active power tracking MPPT varies in real time according to wind speed. In the case of guaranteed active transmission, reactive power can be adjusted to within the permissible range of the inverter. Therefore, the fluctuation of wind speed will affect the active power of wind power generation system.
Typical wind speed power curve of wind power generation system is shown in Figure 4. The power curve of the wind power generation system is normalized, and the cut in wind speed is set as 5 m/s, and the cutting speed is 15 m/s. Through the MATLAB numerical calculation, the CDF 3D image of
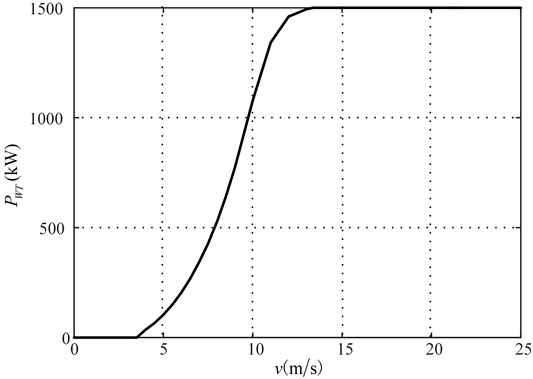
FIGURE 4. Typical power curve of the wind power generation.
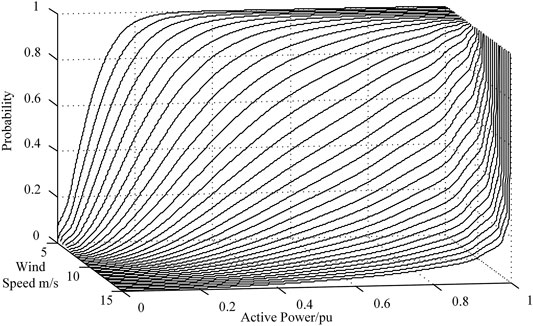
FIGURE 5. The CDF 3D image of
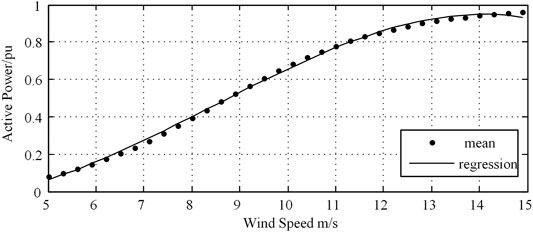
FIGURE 6. Relation between reference value and mean value of controllable PV system.
where
The modeling of reactive power
Based on the probabilistic model of the controllable DG, a day-ahead optimal dispatch model of ADNs with chance constraints is developed and solved. For convenience, the superscript of random variable is marked as “∼”.
The owner of ADN is the main body of interest. It is assumed that the dump energy of the storage system is the same every day. The profit of the owner in a dispatching cycle is detracting the purchase cost from the superior grid and the reward for owner of the DG equipment from the payment of the consumer. The flexible load is not considered in this paper. The objective function of operation cost of the DN enterprise is presented as
The objective function does not contain system loss, such as net loss and charge and discharge loss of energy storage system. The reason is that network loss is already included in the sum of the cost of electricity purchased. Therefore, there is no need to add network loss items into the objective function.
The constraints are given as follows:
(1) The power flow constraint of branch
For the node
where
The power flow equation of branch, taking node
(2) Chance constraints of state variables
Considering the probability of state variables exceeding the boundary, the chance constraints are formulated as
where
(3) Operational constraints of energy storage system considering daily charge and discharge times
It is assumed that the residual energy
where
The power model of the energy storage system is given by
where
In this paper, a constraint that can limit the times of state changes (in charge or discharge) in a dispatch cycle for energy storage system is proposed. Thus, the storage life of the energy storage system cannot be shortened due to frequent charging and discharging. There are three possible values for
Therefore, the constraint of charge and discharge change times in the energy storage system can be formulated as
where
It is to be noted that it is difficult to consider the change times of charging and discharging occurring between two dispatch cycles. Thus, the logic of introducing
(4) Constraint of reactive power compensation equipment
In this paper, capacitor banks and static var generator (SVG) are used as compensation devices. The capacitance can adjust the reactive power by integer switching, and SVG can continuously adjust the output of reactive power. The constraints of tunable capacitors and SVG for node are expressed as
where
A heuristic method is utilized to solve the chance constrained programming for stochastic optimal power flow (Mühlpfordt et al., 2020; Fares et al., 2021; Xu et al., 2021). The solving process of heuristic method is divided into three steps: optimization calculation, the judging of probability exceeding the limit, and adjusting the optimization model. 1) The load power and PV output are substituted by the mean value to obtain the deterministic optimization model and complete the solution. 2) According to the optimization scheme, combined with the probability model of load demand and PV output, the CDF of voltage is calculated by probabilistic power flow (PPF) to judge whether it meets the chance constraints. 3) Based on those judgment results, the deterministic optimization model is adjusted by the heuristic method, and the above steps are, hence, repeated until the solution of the model is finally converged in order to obtain a group of optimization schemes that meet the chance constraints. The detailed description is omitted here.
Through Eq. 3, the reference value of the active power of the DG can be uniquely determined by its active power mean. Therefore, the mean value of the active power can be used directly as the optimization variable. The objective function is a linear function. Except for Eq. 16, all the other constraints are convex constraints. In this paper, the MISOCP method is adopted (Yang et al., 2020; Kayack and Kocuk, 2021; Zografou-Barredo et al., 2021). It follows from Bose et al. (2015) that the non-convex constraint shown in Eq. 16 is relaxed as
Then, Eq. 25 can be equivalent to the second-order cone form
It is worth noting that the objective function of this paper is composed of network loss and PV reduction. The network loss is an increasing function, which has been proven to be accurately solved. When the power of PV system is too large, the right term of Eq. 25 is often smaller than the left term. However, the equivalent constraint effect of Eq. 16 cannot be realized. By using the method (Abdelouadoud et al., 2015; Wang et al., 2021), the optimization solution can be developed as an iteration process by adding a cut set to each iteration
where
In order to verify the feasibility of DG probabilistic model, the optimal power flow model of ADN, and the random optimization method of ADN proposed in this paper, the modified IEEE33 node power distribution system is utilized to illustrate and verify the optimization model, and the model is shown in Figure 7.
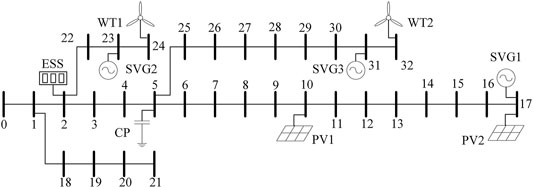
FIGURE 7. A 33-bus radial active distributed network.
The power reference value is 10 MVA, the voltage reference value is 12.66 kV, and the voltage of node 0 is 1.05 pu. By dividing the day-ahead optimization into 24 periods, every period is 1 h. Nodes 10 and 17 are installed 2 PV systems (PV1, PV2) with a maximum inverter capacity
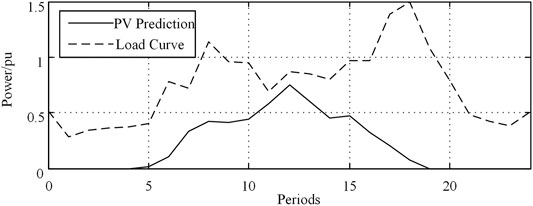
FIGURE 8. PV prediction power curve and load curve.
The prediction curve of wind power generation system is shown in Figure 9, which is based on the wind speed data of a certain place in China on April 14, 2009.
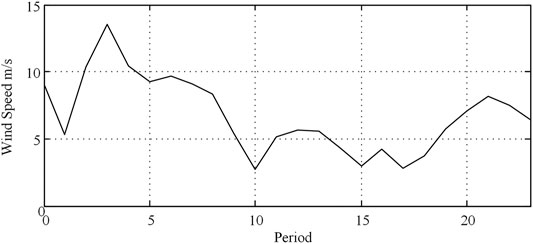
FIGURE 9. Wind speed prediction curve.
Consider the random factors in the system as follows: The inverter capacity is taken as the reference value, the power of DG is treated as the per-unit value. For PV systems,
The price of power purchase adopts a peak valley price: 00:00 to 07:00 is 0.49 yuan/kWh, 07:00 to 17:00 and 22:00 to 24:00 is 0.74 yuan/kWh, 17:00 to 22:00 is 0.98 yuan/kWh, where yuan is the unit of CNY. The electricity price of PV and wind power are 1 and 0.8 yuan/kWh. PV power curtailment compensation electricity price is set to 2 yuan/kWh.
The parameters of other adjustable devices in the system are shown in Table 1. The maximum capacity of the energy storage system (ESS) equipped in node 2 is 5 MWh, and between 20% and 90%, and the charging and discharging efficiency is 98%. The number of charging and discharging cycles in a day is limited tofour times, and the number of capacitor adjustable groups is two. The last time state of the last day is set to discharge
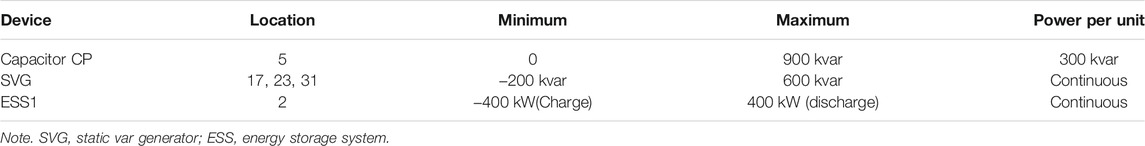
TABLE 1. Parameters of adjustable device.
The upper and lower bounds of the chance constraint of the voltage amplitude for each node in each period are set to 1.05 and 0.95, respectively, and the confidence level is taken as 95%.
Based on the MATLAB + yalmip platform, the SOCP solver of MOSEK is used to solve the deterministic optimization. The stochastic response surface method is used to solve the probabilistic power flow (Ren et al., 2016; Gallego et al., 2021), which will be used in the solving process. The constrained boundaries of the state variable are gradually adjusted according to the heuristic steps. Finally, the stochastic optimal dispatch for ADN is obtained.
The proposed algorithm iterates five times and the objective function of the first iteration is 53,910 yuan, the cost of the last iteration is 53,920 yuan. The first iteration and the fifth iteration’s cost of PV power curtailment compensation are the same (70 yuan), which means no need to curtail PV power. During the 12:00–13:00 period,
The optimal dispatch of all adjustable equipment is shown in Supplementary Table SA1 (Supplementary Material). In the iterative process, nodes that do not meet the chance constraints are mainly concentrated near the nodes where wind power is connected. These nodes are 24, 29, 30, 31, and 32. The average voltage amplitude and
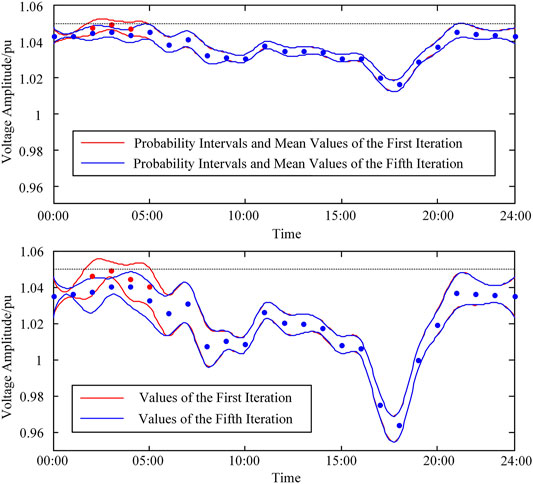
FIGURE 10. Probability intervals of the first iteration and the fifth iteration all day of nodes 24 and 32.
As the wind speed prediction curve shows, the wind speed in the 2:00–4:00 period is high, and the active power of the wind power generation system is higher than normal, which leads to the high voltage of the nodes connected to wind power generation systems. For the first iteration, the deterministic power flow shows that the maximum voltage of node 32 is 1.050 (3:00), which satisfies the upper bound of the deterministic voltage constraints. However, the 90% probability interval of these periods is over 1.05, which means that the chance constraints is not satisfied.
In the first iteration, the periods do not satisfy the chance constraints of 32 nodes; the deterministic voltage constraint, the voltage from deterministic power flow, and 90% probability interval are shown in Table 2.
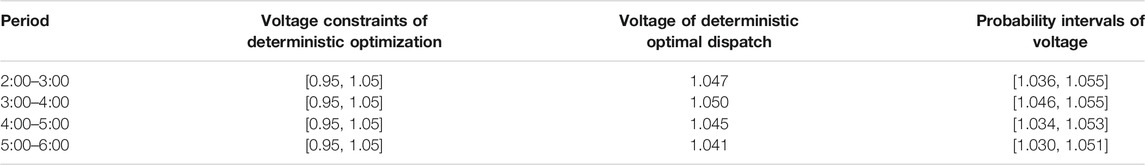
TABLE 2. Variables that do not satisfy the chance constraint of 32-node in first iteration.
In order to reduce the probability risk, the ADN system has to mobilize the adjustable equipment in the whole system, which increases network loss to achieve the effect of reducing voltage. At the fifth iteration, the algorithm ends. The information of the periods shown in Table 2 has been changed into Table 3.
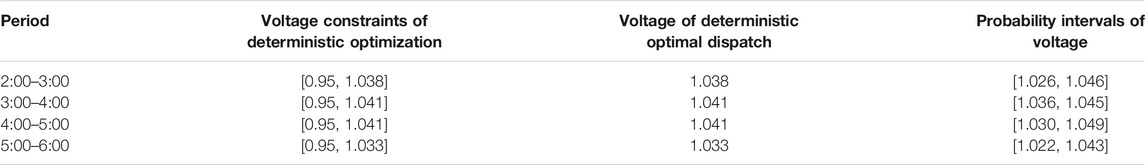
TABLE 3. The same variables of 32-node in fifth iteration.
The
The power and energy of the energy storage system in each period are shown in Figure 11. From 11:00 to 14:00, the energy storage system will charge at the limit of power to reduce the voltage and minimize the curtailment of PV power. At the end of the last day, the state of the energy storage system is discharged; the charging, discharging, charging and discharging are shown. It should be remembered that the charging and discharging should each be done two times. It means the constraints that charge and discharge changing not more than four times has been satisfied, which verifies the rationality of the constraint set.

FIGURE 11. Residual energy and power of the energy storage system.
The average voltage amplitude and
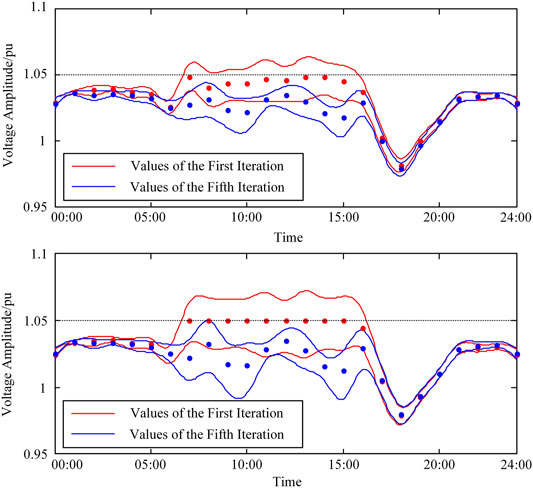
FIGURE 12. Probability intervals of the first iteration and the fifth iteration all day of nodes 10 and 17.
In order to adjust the voltage, the method of PV power curtailment and adjusting other controllable devices is adopted. The voltage and probability interval of voltage are reduced. The upper bound of the probability interval is less than 1.05, which means less randomness and ensures safe operation. The cost is increasing operating cost of 1,950 yuan, while increasing the compensation fee of PV power curtailment for 1,850 yuan.
The above examples illustrate that controlling adjustable devices is enough when the access capacity of the DG is small, and the active power adjustment of PV system is close to zero; the stochastic optimization can be realized at a small cost. In these circumstances, stochastic optimization is similar to deterministic optimization. When the access capacity of PV system is large, it is necessary to avoid the risk of probability limit by PV power curtailment, which would substantially increase operating costs by the compensation fee of PV power curtailment.
In this paper, the probability models of controllable DG were proposed, and a day-ahead coordinated dispatch optimization model of ADN with chance constraints has been modeled. A heuristic method and the MISOCP method were used to solve stochastic optimization. The simulation results showed that the proposed method has the ability to optimize the operation and solve the potential risk of the ADN at the same time. Considering influence of randomness on ADN and PV power curtailment phenomenon, the following conclusions could be obtained:
(1) The large capacity of DG leads to the increase in the voltage amplitude and expands the probability interval of voltage fluctuation.
(2) When regulating voltage methods and capacity are sufficient, the system can be optimized without DG power curtailment, and there is no risk of crossing the limits.
(3) When regulating voltage methods and capacity are not sufficient, it is necessary to reduce the voltage level and intervals of voltage fluctuation, by discarding DG power, so as to ensure the safe and reliable operation of ADN.
The original contributions presented in the study are included in the article/Supplementary Material. Further inquiries can be directed to the corresponding author.
JW developed the methodology, was in charge of the software, wrote the original draft, and was in charge of the data curation. SZ was in charge of the investigation, software, writing the original draft, and data curation. YS conceptualized this study, supervised the study, and reviewed and edited the draft. XD and PW reviewed and edited the draft. RM wrote, reviewed, and edited the manuscript.
This paper was funded by the National Natural Science Foundation of China under Grant 62073121.
The authors declare that the research was conducted in the absence of any commercial or financial relationships that could be construed as a potential conflict of interest.
All claims expressed in this article are solely those of the authors and do not necessarily represent those of their affiliated organizations, or those of the publisher, the editors, and the reviewers. Any product that may be evaluated in this article, or claim that may be made by its manufacturer, is not guaranteed or endorsed by the publisher.
The Supplementary Material for this article can be found online at: https://www.frontiersin.org/articles/10.3389/fenrg.2021.814850/full#supplementary-material
Abdelouadoud, S. Y., Girard, R., Neirac, F. P., and Guiot, T. (2015). Optimal Power Flow of a Distribution System Based on Increasingly Tight Cutting Planes Added to a Second Order Cone Relaxation. Int. J. Electr. Power Energ. Syst. 69, 9–17. doi:10.1016/j.ijepes.2014.12.084
Bai, L., Jiang, T., Li, F., Chen, H., and Li, X. (2018). Distributed Energy Storage Planning in Soft Open point Based Active Distribution Networks Incorporating Network Reconfiguration and Dg Reactive Power Capability. Appl. Energ. 210, 1082–1091. doi:10.1016/j.apenergy.2017.07.004
Bose, S., Low, S. H., Teeraratkul, T., and Hassibi, B. (2015). Equivalent Relaxations of Optimal Power Flow. IEEE Trans. Automat. Contr. 60, 729–742. doi:10.1109/TAC.2014.2357112
Fares, D., Fathi, M., Shams, I., and Mekhilef, S. (2021). A Novel Global Mppt Technique Based on Squirrel Search Algorithm for Pv Module under Partial Shading Conditions. Energ. Convers. Manage. 230, 113773. doi:10.1016/j.enconman.2020.113773
Gallego, L. A., Franco, J. F., and Cordero, L. G. (2021). A Fast-Specialized point Estimate Method for the Probabilistic Optimal Power Flow in Distribution Systems with Renewable Distributed Generation. Int. J. Electr. Power Energ. Syst. 131, 107049. doi:10.1016/j.ijepes.2021.107049
Huang, Y., Ju, Y., Ma, K., Short, M., Chen, T., Zhang, R., et al. (2022). Three-phase Optimal Power Flow for Networked Microgrids Based on Semidefinite Programming Convex Relaxation. Appl. Energ. 305, 117771. doi:10.1016/j.apenergy.2021.117771
Jiang, T., Li, Z., Jin, X., Chen, H., Li, X., and Mu, Y. (2018). Flexible Operation of Active Distribution Network Using Integrated Smart Buildings with Heating, Ventilation and Air-Conditioning Systems. Appl. Energ. 226, 181–196. doi:10.1016/j.apenergy.2018.05.091
Jin, X., Mu, Y., Jia, H., Wu, Q., Jiang, T., Wang, M., et al. (2019). Alleviation of Overloads in Transmission Network: A Multi-Level Framework Using the Capability from Active Distribution Network. Int. J. Electr. Power Energ. Syst. 112, 232–251. doi:10.1016/j.ijepes.2019.05.007
Kayack, S. E., and Kocuk, B. (2021). An Misocp-Based Solution Approach to the Reactive Optimal Power Flow Problem. IEEE Trans. Power Syst. 36, 529–532. doi:10.1109/TPWRS.2020.3036235
Li, P., Ji, J., Ji, H., Jian, J., Ding, F., Wu, J., et al. (2020). Mpc-based Local Voltage Control Strategy of Dgs in Active Distribution Networks. IEEE Trans. Sustain. Energ. 11, 2911–2921. doi:10.1109/tste.2020.2981486
Li, Y., Wen, Z., Cao, Y., Tan, Y., Sidorov, D., and Panasetsky, D. (2017). 114 Tan, Y., Sidorov, D., and Panasetsky, DA Combined Forecasting Approach with Model Self-Adjustment for Renewable Generations and Energy Loads in Smart Community. Energy 129, 216–227. doi:10.1016/j.energy.2017.04.032
Li, Z., Cui, J., Lu, Q., Mi, Y., and Su, X. (2019). Rolling Optimal Scheduling of Active Distribution Network Based on Sequential Dynamic Constraint. Automat. Elect. Power Syst. 43, 17–24. doi:10.7500/AEPS20190128006
Liu, W., Gu, W., Li, P., Cao, G., Shi, W., and Liu, W. (2021). Non-iterative Semi-implicit Integration Method for Active Distribution Networks with a High Penetration of Distributed Generations. IEEE Trans. Power Syst. 36, 438–450. doi:10.1109/TPWRS.2020.3003367
Mühlpfordt, T., Faulwasser, T., Hagenmeyer, V., Roald, L., and Misra, S. (2020). On Polynomial Real-Time Control Policies in Stochastic Ac Optimal Power Flow. Electric Power Syst. Res. 189, 106792. doi:10.1016/j.epsr.2020.106792
Ren, Z., Li, W., Billinton, R., and Yan, W. (2016). Probabilistic Power Flow Analysis Based on the Stochastic Response Surface Method. IEEE Trans. Power Syst. 31, 2307–2315. doi:10.1109/TPWRS.2015.2461159
Safa, A., Madjid Berkouk, E. L., Messlem, Y., and Gouichiche, A. (2018). A Robust Control Algorithm for a Multifunctional Grid Tied Inverter to Enhance the Power Quality of a Microgrid under Unbalanced Conditions. Int. J. Electr. Power Energ. Syst. 100, 253–264. doi:10.1016/j.ijepes.2018.02.042
Sun, Y., Wu, X., Wang, J., Hou, D., and Wang, S. (2021). Power Compensation of Network Losses in a Microgrid with BESS by Distributed Consensus Algorithm. IEEE Trans. Syst. Man. Cybern, Syst. 51, 2091–2100. doi:10.1109/TSMC.2020.2968605
Wang, J., Xu, Q., Su, H., and Fang, K. (2021). A Distributed and Robust Optimal Scheduling Model for an Active Distribution Network with Load Aggregators. Front. Energ. Res. 9, 79. doi:10.3389/fenrg.2021.646869
Wu, C., Gu, W., Zhou, S., and Chen, X. (2021). Coordinated Optimal Power Flow for Integrated Active Distribution Network and Virtual Power Plants Using Decentralized Algorithm. IEEE Trans. Power Syst. 36, 3541–3551. doi:10.1109/TPWRS.2021.3049418
Xiao, J., Wang, Y., and Zu, G. (2021). Analysis of Distributed Generation Accommodation in Flexible Distribution Networks. Front. Energ. Res. 9, 43. doi:10.3389/fenrg.2021.634770
Xu, Y., Korkali, M., Mili, L., Valinejad, J., Chen, T., and Chen, X. (2021). An Iterative Response-Surface-Based Approach for Chance-Constrained AC Optimal Power Flow Considering Dependent Uncertainty. IEEE Trans. Smart Grid 12, 2696–2707. doi:10.1109/TSG.2021.3051088
Yang, W., Chen, L., Deng, Z., Xu, X., and Zhou, C. (2020). A Multi-Period Scheduling Strategy for ADN Considering the Reactive Power Adjustment Ability of DES. Int. J. Electr. Power Energ. Syst. 121, 106095. doi:10.1016/j.ijepes.2020.106095
Yu, H., Tian, W., Yan, J., Li, P., Zhao, K., Wallin, F., et al. (2022). Improved triangle Splitting Based Bi-objective Optimization for Community Integrated Energy Systems with Correlated Uncertainties. Sustainable Energ. Tech. Assessments 49, 101682. doi:10.1016/j.seta.2021.101682
Zeb, K., Uddin, W., Khan, M. A., Ali, Z., Ali, M. U., Christofides, N., et al. (2018). A Comprehensive Review on Inverter Topologies and Control Strategies for Grid Connected Photovoltaic System. Renew. Sustain. Energ. Rev. 94, 1120–1141. doi:10.1016/j.rser.2018.06.053
Keywords: active distribution network, day-ahead optimal dispatch, probability model, controllable distributed generation, chance constraint
Citation: Wang J, Zhang S, Sun Y, Du X, Wu P and Mahfoud RJ (2022) Day-Ahead Optimal Dispatch for Active Distribution Network Considering Probability Model of Controllable Distributed Generation. Front. Energy Res. 9:814850. doi: 10.3389/fenrg.2021.814850
Received: 14 November 2021; Accepted: 15 December 2021;
Published: 02 February 2022.
Edited by:
Yue Zhou, Cardiff University, United KingdomReviewed by:
Jun Wu, Wuhan University, ChinaCopyright © 2022 Wang, Zhang, Sun, Du, Wu and Mahfoud. This is an open-access article distributed under the terms of the Creative Commons Attribution License (CC BY). The use, distribution or reproduction in other forums is permitted, provided the original author(s) and the copyright owner(s) are credited and that the original publication in this journal is cited, in accordance with accepted academic practice. No use, distribution or reproduction is permitted which does not comply with these terms.
*Correspondence: Shida Zhang, emhhbmdzaGlkYUB0anUuZWR1LmNu
Disclaimer: All claims expressed in this article are solely those of the authors and do not necessarily represent those of their affiliated organizations, or those of the publisher, the editors and the reviewers. Any product that may be evaluated in this article or claim that may be made by its manufacturer is not guaranteed or endorsed by the publisher.
Research integrity at Frontiers
Learn more about the work of our research integrity team to safeguard the quality of each article we publish.