 Minghui Liu
 Chunhua Ju
 Yan Wang
94% of researchers rate our articles as excellent or good
Learn more about the work of our research integrity team to safeguard the quality of each article we publish.
Find out more
ORIGINAL RESEARCH article
Front. Energy Res. , 14 January 2022
Sec. Sustainable Energy Systems
Volume 9 - 2021 | https://doi.org/10.3389/fenrg.2021.811577
This article is part of the Research Topic Interactions Between China’s National Emissions Trading Scheme and Electricity Market: Practices and Policies View all 27 articles
China’s power industry is in a critical transformation period. The new round of power system reform in 2015 will have a profound impact on China’s power industry. Therefore, it’s necessary to analyze the influencing factors of thermal power generation efficiency. Based on the thermal power generation industry related data in China’s 30 provinces from 2005 to 2017, this paper studies the impacts of market segmentation on thermal power generation efficiency in China. And the empirical result shows that the market segmentation exhibit significant negative effects on the thermal power generation efficiency, that is, the thermal power generation efficiency significantly decrease 1.6799 for each unit increase of market segmentation index of thermal power industry. Besides, by decomposing the dynamic thermal power efficiency index, we find that the “innovation effect” is the primary channel for the market segmentation to make effects on the thermal power generation efficiency. Furthermore, our findings are still robust after considering endogenous problems and eliminating the relevant data. Finally, research conclusions of our study paper provide empirical supports for the efficient development of China’s power market.
For a long time, the dominant position of thermal power generation in China has attracted considerable attention. Thermal power generation accounts for more than 70% of the total power generation in China (Cheng et al., 2019), and the installed capacity of thermal power accounts for more than 60% of the total power generation capacity. In recent years, the twin problem of global warming and climate change have raised concerns about thermal power generation (Kwakwa, 2021). And the goal of energy structure optimization has made the proportion of thermal power decrease slightly, as shown in Figure 1. However, due to China’s abundant coal resources and the technical requirement and economic cost of various types of power generation, thermal power generation will still account for a large proportion of China’s power supply in the future.
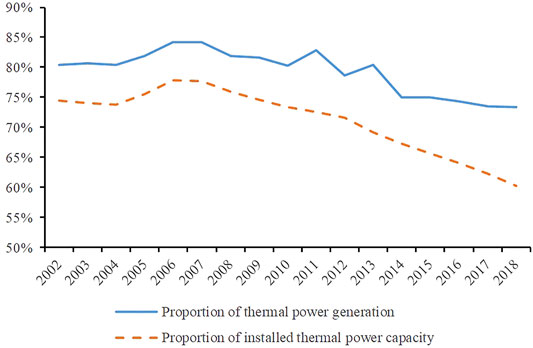
FIGURE 1. Proportion of thermal power generation and installed capacity from 2002 to 2018.
The stylized facts of the uneven distribution of natural resources and local imbalances between power demand and supply exist in China’s power industry (Wang et al., 2014; Lin et al., 2021). In order to alleviate power shortages, the Chinese government has begun to establish provincial power markets since 1988, which is of benefit to the local governments of different provinces. The segmentation of the electricity market among different provinces is accompanied by political competition, and local governments only focus on local economic performance (Zhou, 2004). The resulting inter-regional political competition may lead to the imposition of inter-regional trade barriers by local governments (Young, 2000), which is also called the beggar-thy-neighbor strategy (Li and Lin, 2017). As a result, some more efficient but non-local thermal power generation companies could not get the support of the local government.
Figure 2 shows the relationship between standard coal consumption and average utilization hours for 465 Chinese power plants of 6,000 kW and above in 2011.1 In the absence of market segmentation, priority should be given to the generating set with large capacity and low standard coal consumption. That is to say, power plants with high efficiency should prioritize power generation to meet demand-side power consumption regardless of power plants’ location. But from Figure 2 we can find that some power plants (on the bottom left of Figure 2) with low standard coal consumption is not effectively utilized and the average utilization hours are low, while some power plants (on the top right of Figure 2) with high standard coal consumption and low efficiency have higher utilization hours. Therefore, there is no significant positive correlation between the energy efficiency of the generator set and the utilization hours, which has led to the excessive loss of resources and also put greater pressure on energy conservation and emission reduction. How to solve the imbalance between energy efficiency and utilization rate of power plants and improve the overall efficiency of China’s thermal power industry is the most difficult point for the Chinese government to regulate the power industry. Because of the high degree of power market segmentation, some high-efficiency but non-local thermal power generation enterprises can hardly survive in the local market, and thus can’t obtain the benefits of cross-regional cooperation and trade between different provinces. However, not enough attention was paid to this topic. Therefore, based on the above background, we will study the impact of market segmentation on thermal power generation efficiency in China and hope to provide some empirical supports for solving the problems of thermal power generation efficiency and market segmentation in China.
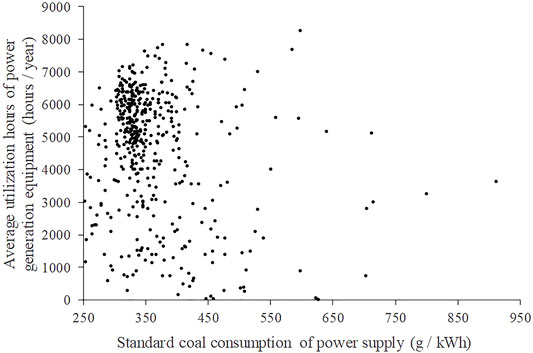
FIGURE 2. Standard coal consumption and annual average utilization hours for Chinese power plants of 6,000 kW and above in 2011.
Air pollution and climate change are two major challenges faced by all countries around the world (Chen et al., 2022). To protect the environment, China put forward to realize peak carbon dioxide emissions by 2030 and carbon neutrality by 2060. However, a key method to achieve these goals is to reduce carbon dioxide emissions. There are many latest studies focus on carbon emission reduction. Song et al. (2019) evaluated the impact of low-carbon city polit policy on air quality. Li et al. (2022) evaluated the changes of carbon emission reduction in China’s provinces during 2001–2016 from the perspective of commercial building operation. Zhang et al. (2021) took China and the United States as research objects, evaluated the carbon dioxide emission reduction of buildings, which are important departments of carbon emission reduction under different emission scales, and investigated them emission efficiency. Thermal power generation plays a dominant role in China’s total power generation, and it also has an important impact on carbon emission reduction. Therefore, the carbon emissions and power generation efficiency of thermal power generation are the two main points of this paper. We find that studies on this topic mainly focus on two aspects.
The first aspect is about thermal power generation efficiency. High efficiency is a goal that thermal power plants have been pursuing (Wang Z. et al., 2021). Some studies emphasized on the influence of thermal power generation efficiency and they showed that regional economic development level (Wang, 2014), technology innovation (Bai and Song, 2009; Duan et al., 2016) and environmental regulation (Jaraitė and Di Maria, 2012; Li, 2015) could influence the efficiency of thermal power generation. Wang R.-M. et al. (2021) studied the regional differences in thermal power generation efficiency in China’s eastern, central, and western regions, and found that the eastern region has the highest thermal power efficiency. Others discussed the calculation of thermal power generation efficiency. The data envelopment analysis (DEA) method is widely applied in the calculation of power generation efficiency (Sueyoshi and Goto, 2011; Fallahi et al., 2011). And many researchers have studied the efficiency of the power industry in China from different levels of data collection. For example, with the assumption of sole frontier technology, Wang et al. (2019) analyzed the “average” change in coal intensity of each group by production scale and region under a traditional DEA framework. At the national level, Zhou et al. (2012a) proposed a non-radial direction distance function method from the perspective of production efficiency. And there are a lot of studies focus on the thermal power efficiency at the provincial level with the DEA method (Song et al., 2017; Sueyoshi et al., 2018). Some other researchers have used the DEA method to measure the performance of coal-fired power plants in China at the micro-enterprise level (Zhao and Ma, 2013; Wei et al., 2015). In recent years, Metafrontier analysis has also been widely used to study regional heterogeneity of energy efficiency in China (Feng et al., 2017; Long et al., 2018; Long et al., 2019). Eguchi et al. (2021) proposed a metafrontier data envelopment analysis decomposition framework to investigate the sources of inefficiency in power generation, finding that technology gap contributes most to the regional heterogeneity of power generation efficiency.
The second aspect concentrates on the impacts of market segmentation on energy efficiency. On the one hand, there is significant spatial imbalance (Zhu et al., 2019) and regional heterogeneity in provincial energy efficiency (Cheng et al., 2020). On the other hand, market segmentation will weaken market competition mechanism and reduce market vitality, and thus reducing regional energy efficiency (Yi et al., 2021). Li and Lin (2017) studied the influence of market segmentation on carbon emission performance in China, and proved that market segmentation has negative effect on carbon emission performance. Zhang and Lu (2017) obtained the same conclusion that market segmentation has significant negative effect on energy efficiency promotion by using panel data of Chinese provinces. Sun et al. (2020) have proved that market segmentation has significantly negative effect on environmental efficiency of electric power industry. Qi and Zhou (2020) found that market segmentation has a significant inhibitory effect on energy efficiency by distorting technological progress, scale efficiency and allocation efficiency.
Based on above analysis, we find that researches in this field are still insufficient in the following aspects. For one thing, the calculation of market segmentation index in existing paper mainly focuses on multi-integral energy products market and calculations of market segmentation of power industry are still scarce; for another thing, there is a lack of research on the impacts of market segmentation on thermal power generation efficiency. Therefore, the contributions of this paper can be summarized as follows. Firstly, this paper checked the influence of market segmentation on thermal power generation efficiency, and contributes to the literature in the fields of thermal power generation efficiency and market segmentation. Second, in this paper, we explore the impacts of market segmentation on thermal power efficiency from different perspectives, i.e., static efficiency, dynamic efficiency, and the decomposition of dynamic efficiency, which enriches the relevant research content. Third, if a clear understanding of the relationship between market segmentation and thermal power generation efficiency lacks, the central government could not better implement the relevant policies to promote the development of the thermal power industry. This paper provides a new perspective for improving power generation efficiency, which gives some reference for China’s ongoing reform in the field of the electricity market.
The rest of this paper is organized as follows. Measurement of Thermal Power Generation Efficiency and Market Segmentation Index Section is about the relevant literature. In Impacts of Market Segmentation on Thermal Power Generation Efficiency Section, we describe the measurement of thermal power generation efficiency and market segmentation index. In Conclusions and Policy Implications Section, we specifically analyze the impact of market segmentation on thermal power generation efficiency. And Conflict of Interest Section is the conclusion and policy recommendations.
To solve the limitation of the conventional DEA model in the measurement of efficiency (Zhu et al., 2020; Wang M. et al., 2021), Chambers et al. (1996) proposed a directional distance function (DDF), which takes into account the maximization of the desired output and the minimization of the undesired output. The emergence of the DDF model overcomes the limitation that the traditional distance function can only adjust the input or output measurement efficiency, and distinguishes between strong and weak disposability between desirable and undesired outputs. Although DDF has its advantages, its limitation lies in the assumption that the increase of desirable output and the decrease of input and undesirable output are strictly proportional, which may lead to “slack bias” (Fukuyama and Weber, 2009). In view of the flaws of traditional DDF, Zhou et al. (2012a) proposed a non-radial DDF (NDDF) method. Compared with DDF, NDDF further relaxes the assumption of proportional change (Zhang and Choi, 2013; Lin et al., 2018), which can be used to adjust different proportions of input factors, desirable outputs and undesirable outputs (Zhou et al., 2012b).
Therefore, we use the NDDF method to measure the efficiency of thermal power generation in this study. Assuming that there are i = 1,2,., N regions as the basic decision-making unit (DMU), and the time period is t = 1,2, ., T. Each DMU uses capital (K), labor (L), and energy (E) to produce the desired output (Y), and undesired output CO2 emissions (C) during the production process. Referring to the work of Li and Xu (2018), we divide 30 Chinese provinces into three groups based on geographical location: eastern, central, and western regions. And we distinguish three types of technology production set based on the boundaries within the group and global boundary. Assuming that there are H groups and T periods. The production technology set for group h in period t is shown as follows.
The set covers the production technology set for all periods of the group and is expressed as follows.
The global production technology set is the set of production technology sets of all groups in all periods, as shown in Eq. 3.
Then the production function is expressed as:
According to the work of Lin and Du (2015), the following NDDF is constructed, which allows the increase of the desired output and the decrease of the undesired output to change in different ratios, and also effectively prevents the problem of slack deviation.
Where, the slack vector
Then we could calculate the static efficiency index (UEI). The direction vector is set as g=(-K, -L, -E, Y, -C), and the weight vector w = (1/9, 1/9, 1/9, 1/3, 1/3).
The Eq. 5 can be solved by the following linear optimization process:
s t.
After solving the Eq. 6, we can get the optimal solution
Where UEI∈[0,1], and the higher value it is, the higher the efficiency level we get. According to the work of Li and Xu (2018) and Li et al. (2018), we further define the dynamic efficiency MMUEI as follows:
In addition, we further decompose the dynamic thermal power generation efficiency MMUEI. Assuming that the number of provinces in each group is
During the whole sample period, the technology set constructed by the sample in the different time is the intertemporal group technology, that is:
The efficiency change index (EC) measures the change in power generation efficiency within a group between two periods, which describes the change in technical efficiency between the decision unit in the group and the current technological frontier of the group. The Best Practice Gap Change Index (BPC) represents the change in
Our sample covers the panel data of the thermal power generation industry in China’s 30 provinces from 2005 to 2017.2 The data of capital input, energy input, and desirable output comes from China Electric Power Yearbook, and the data of labor input comes from China Labor Statistical Yearbook. The undesired output is calculated with the energy consumption and corresponding carbon emissions coefficient
Where
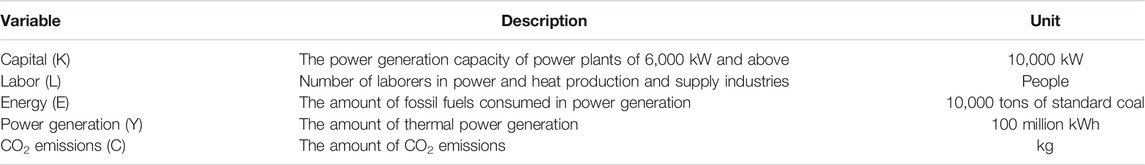
TABLE 1. Data description for measuring thermal power generation efficiency.
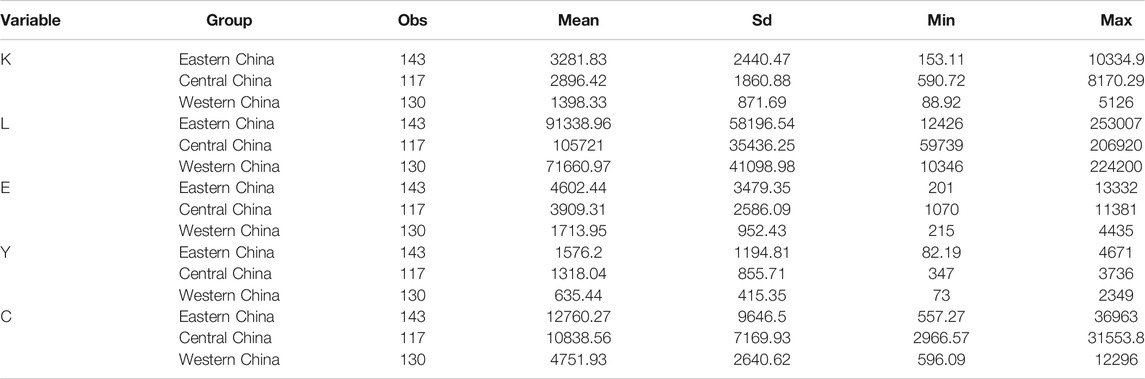
TABLE 2. Statistics summary for measuring thermal power generation efficiency.
In this section, we analyze the static and dynamic thermal power generation efficiency, and further decompose the dynamic thermal power generation efficiency into three parts. The range of efficiency calculated in this paper is [0,1]. A larger efficiency value means that the power plant can produce more desirable outputs with fewer inputs and fewer undesired outputs, and vice versa.
The calculation results of the three static efficiency indexes UEIg, UEIi, and UEIc are shown in Figures 3, 4, 5. The primary difference between UEIi and UEIc is the time period. UEIi is a whole cycle index, while UEIc is a specific cycle index. And both UEIi and UEIc are calculated based on the efficiency distance between the decision unit and the group boundary. However, UEIg is calculated based on the efficiency distance between the decision unit and the global boundary. It can be seen from Figure 3 that the UEIg index in the eastern region is significantly higher than that in the central region, and the UEIg index in the western region is the lowest, indicating that there exists a large regional difference. At the same time, the UEIg index is showing a slight upward trend in all regions, which illustrates that the static thermal power efficiency has gradually improved over time. From Figure 4 we can find that the results of UEIi index are similar to UEIg index. However, as shown in Figure 5, the results of UEIc index are different. Specifically, the UEIc index in the central region is higher than that in the eastern region, while the UEIc index in the western region has a large fluctuation.
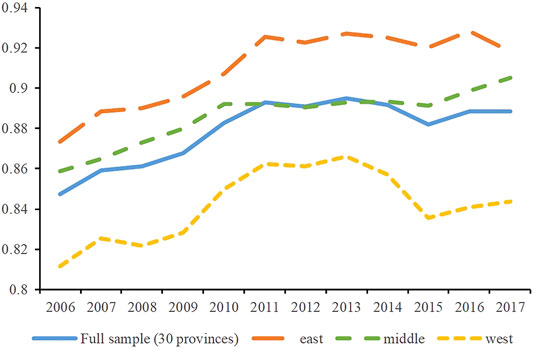
FIGURE 3. The average value of UEIg in different regions.
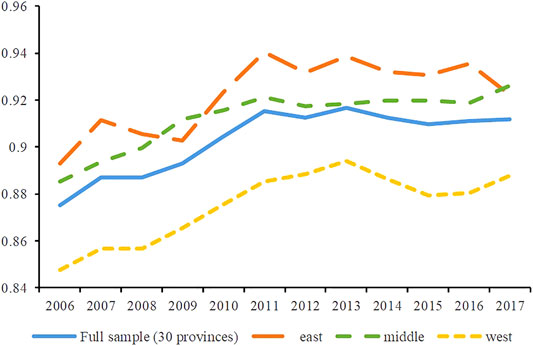
FIGURE 4. The average value of UEIi in different regions.
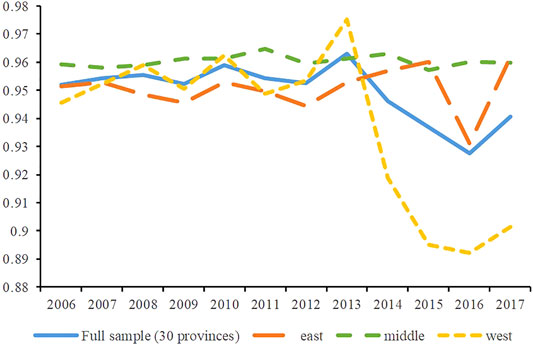
FIGURE 5. The average value of UEIc in different regions.
Compared with the static efficiency indexes, the dynamic efficiency index MMUEI can describe the dynamic change of thermal power generation efficiency. From 2006 to 2017, the average MMUEI value is 1.00057 in China, indicating that on average, the static thermal power generation efficiency is gradually increasing, but the process is slow. As shown in Table 3, the average MMUEI value of 18 provinces is greater than 1, and the average MMUEI value of 12 provinces is less than 1. Furthermore, the three decomposition parts of the dynamic efficiency index MMUEI are shown in Table 4. From Table 4, we can draw the following conclusions: 1) More than half of the provinces are closer to the technological frontier in the current group than in the previous period; 2) The current technology frontier of most provinces is biased towards the intertemporal technology frontier; 3) The gap between intertemporal group technology and global technology is decreasing in most provinces.
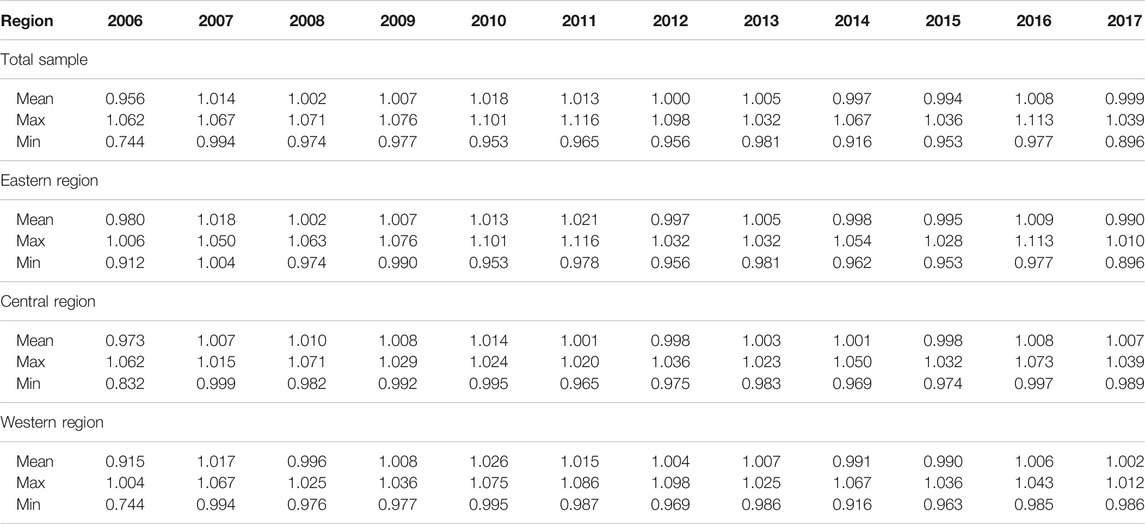
TABLE 3. Calculation results of MMUEI index.
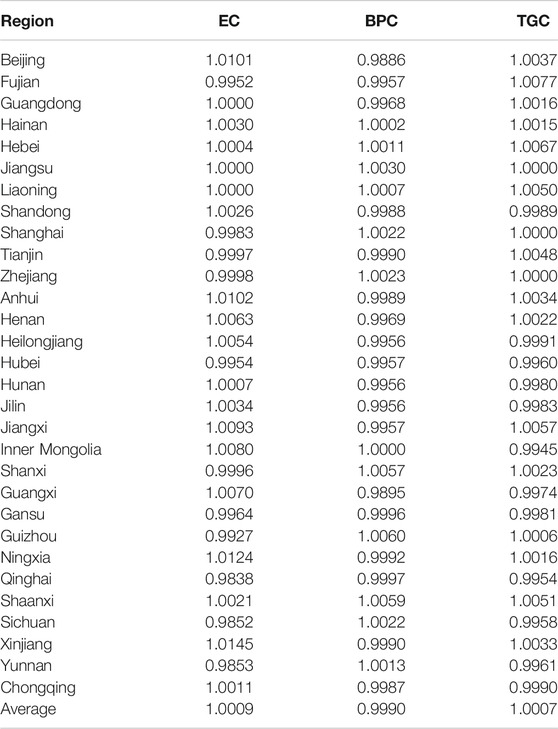
TABLE 4. Decomposition results of MMUEI index.
The measurement methods of market segmentation can be divided into five different types (Yu and Liu, 2009). And the detailed introduction is shown in Table 5. Although each method has its own advantages and disadvantages, overall, the index constructed by “price method” can measure the degree of market segmentation more directly. The index is based on strict theory and methods to obtain objective measures of inter-regional market segmentation. Based on the classical literature of Paresley and Wei (1996); Paresley and Wei (2001a); Paresley and Wei (2001b), it has been widely used in similar studies.
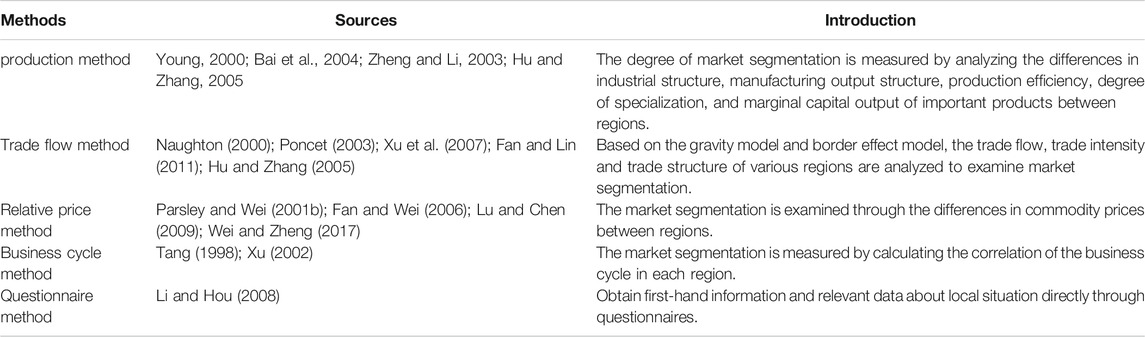
TABLE 5. Measurement of market segmentation index.
In our study, a kind of relative price method, Amazon Glacier Cost (Samuelson, 1964), has been widely applied in studies to measure the degree of market segmentation (Li and Lin, 2017; Wei and Zheng, 2017; He et al., 2018). Parsley and Wei (2001b) further developed this method based on the law of one price. Specifically, the larger the price difference between regions, the greater the degree of market segmentation. Therefore, the market segmentation index can be obtained by combining the price information related to various commodities. To better reflect the characteristics of the thermal power industry, this paper uses the ex-factory price index of power, coal and oil industries to measure the market segmentation index. The relevant data comes from China Price Statistical Yearbook. With reference to Li and Lin (2017), the steps to construct the market segmentation index are shown as follows.
Step 1: Build the relative price index. Suppose
Step 2: Eliminate the corresponding systematic deviation. Since
Step 3: Combine price differences and derive market segmentation index. We calculate 435 pairs () of provincial combinations.
Based on Eqs 12–15, the specific market segmentation index of the thermal power industry in each province can be calculated. Figure 6 shows the time trend of the market segmentation index in the thermal power industry. It can be seen that from 2006 to 2017, the market segmentation index of China’s thermal power industry fluctuated greatly. And three rebounds occurred in 2008, 2015, and 2017, respectively.
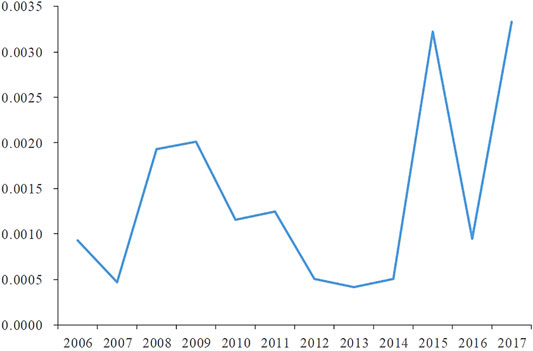
FIGURE 6. Trend of market segmentation index of thermal power industry.
In addition, from Figure 7 we can find that from 2006 to 2012, in general, the market segmentation index of the thermal power industry in most provinces showed a slight downward trend, and the fluctuation range was small, basically between 0 and 0.005. Besides, from 2008 to 2010, the thermal power market segmentation index increases significantly. This finding is consistent with Wei and Zheng (2017). In addition, the market segmentation index fluctuations of most provinces are large between 2015 and 2017. During the entire sample period, the fluctuations in Guizhou, Guangdong, and Tianjin are large, while the fluctuations in Anhui, Hunan, and Inner Mongolia are relatively small and stable, indicating that the price fluctuations of the thermal power industry in different provinces show heterogeneity. We can also see from Figure 7 that the market segmentation index of almost all provinces reached a peak in 2008. This may be due to the widespread impact of the 2008 financial crisis, as local governments tend to increase market intervention to ensure economic stability within the province. Local governments set up barriers for the entry and operation of non-local enterprises to ensure the survival and development of local enterprises, which led to the peak of market segmentation index in most provinces during this period.
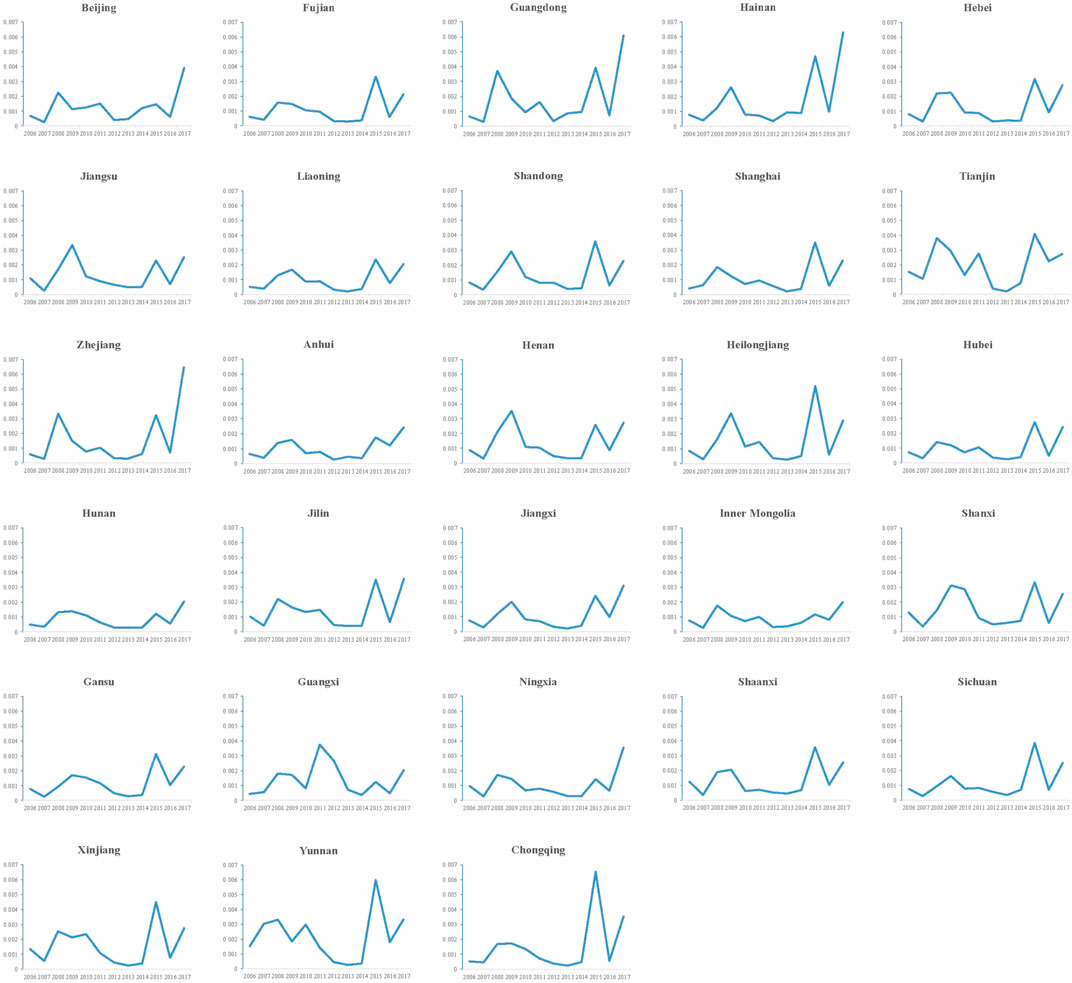
FIGURE 7. Time trend of market segmentation index in different provinces.
In order to analyze the impacts of market segmentation on thermal power generation efficiency, we construct the following regression model:
Where MMUEI is the dynamic efficiency index of thermal power generation in province i at time t, and seg is the core explanatory variable, which indicates the degree of market segmentation in the thermal power industry of each province. The control variables are as follows: lnfdbh is the standard coal consumption for power generation, state is the ownership structure, er is the environmental regulation, lncp is the coal price, and ε is the disturbance unrelated to the explanatory variables.
We use the non-radial direction distance function (NDDF) to measure the thermal power generation dynamic efficiency index MMUEI, and the degree of market segmentation is calculated based on the Amazon Glacier Cost model. The data of standard coal consumption for power generation comes from China Electric Power Yearbook. We use the ratio of state capital in total capital in the electricity, heat production and supply industries to represent the ownership structure, and the data comes from China Industry Statistical Yearbook. The intensity of environmental regulation can be measured by the amount of sulfur dioxide emissions. We use the amount of sulfur dioxide emissions per unit of electricity generated to represent the level of environmental regulation, the relevant data comes from China Electric Power Yearbook and China Industry Statistical Yearbook. And the ex-factory price index of coal industrial products is represented as the coal price. The data comes from China Price Statistical Yearbook and is deflated as the 2005 constant price. The summary statistics of the above main indicators are shown in Table 6.
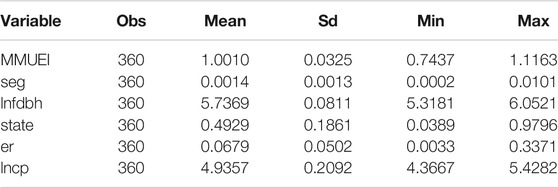
TABLE 6. Summary statistics of variables in the benchmark regression.
We do the Hausman test and find that the null hypothesis is rejected, which means that unobservable random variables that represented the original heterogeneity are related to all the explanatory variables. Therefore, the fixed effect model is selected and corrected by the heteroscedasticity standard error. The regression results are shown in Table 7.
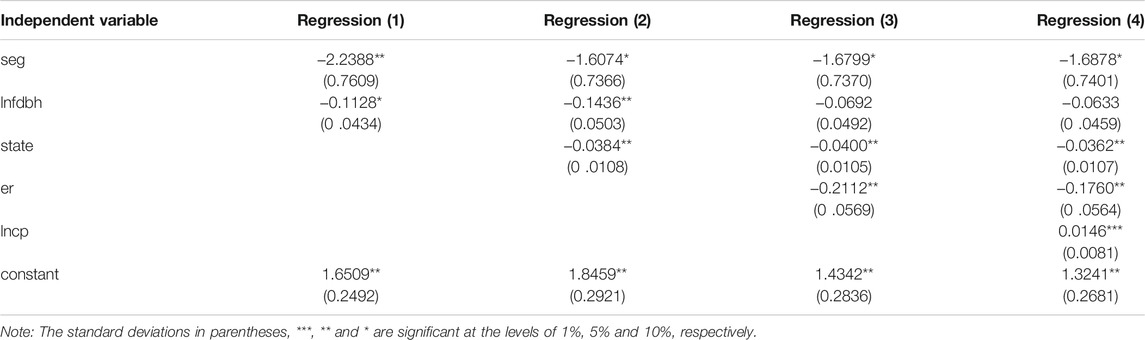
TABLE 7. The impacts of market segmentation on thermal power generation efficiency.
Through the regression results in Table 7, we find that after adding control variables one by one, the regression coefficient of the market segmentation index on the thermal power generation dynamic efficiency has always been significantly negative, indicating that the larger the degree of market segmentation, the lower the thermal power generation efficiency. Therefore, the existence of market segmentation significantly inhibits the improvement of thermal power generation efficiency. Theoretically, the reasons for this result may be as follows: 1) Market segmentation hinders the effective allocation of resources. The direct result of market segmentation is that resources cannot flow effectively in the region, which leads to the distortion of factor market. In the case of market segmentation, the price signal of power market can only play a local role, and cannot reflect the scarcity of power industry resource factors, which is not conducive to the improvement of thermal power efficiency; 2) Market segmentation may hinder technological innovation. In a segmented market, companies may seek profits from low-cost factor inputs and rental income rather than invest in research and development projects. The factor market distortion caused by market segmentation will restrain regional technological innovation to some extent. And the backward development of innovation will inevitably have a negative impact on thermal power efficiency. 3) Market segmentation hinders regional competition and cooperation. In order to protect and stabilize the local economy, some local governments provide “umbrella”, such as subsidies, to efficient power generation companies, while discouraging more competitive non-local companies from entering. The lack of competition hampers efficiency gains because greater competition leads to increased output and incentivizes companies to adopt technology to improve efficiency. Besides, market segmentation has narrowed the scope of regional cooperation, and some provinces and cities often only communicate and cooperate with their neighbors in their geographical locations.
In addition, the coefficient of standard coal consumption for power generation to thermal power generation efficiency is negative, which is in line with expectations. The coefficient of the ownership structure on thermal power generation efficiency is always significantly negative, indicating that the higher the proportion of state-owned assets, the lower the efficiency of thermal power generation. And the coefficient of environmental regulation is significantly negative, indicating that environmental regulation (the stricter environmental regulation will lead to less SO2 emission per unit of power generation) has a promoting effect on the improvement of thermal power generation efficiency. Besides, the coefficient of coal price is significantly positive, which means that the increase in coal price is conducive to the improvement of the thermal power generation efficiency. If the coal price increases, the power plants will inevitably improve fuel utilization through improving technologies and other energy-saving measures, which can improve the level of thermal power generation efficiency at the same time.
In order to test the robustness of the regression results, we replace the dependent variable MMUEI with the three static efficiency indexes UEIg, UEIi, and UEIc. The regression results are shown in columns 1)–3) in Table 8. It can be seen that the impacts of market segmentation on thermal power generation efficiency are still significantly negative. In addition, we exclude the data in 2006 and conducts an empirical regression with the data from 2007 to 2017. It is found that the market segmentation is still not conducive to help improve the efficiency of thermal power generation (see column 4) in Table 8). In order to solve the endogenous problem, we further use the two-step regression system GMM method and take the lag terms of core independent variable and environmental regulation as the tool variables. Column 5) in Table 8 shows that the sign and significance of the coefficient do not change. Therefore, we claim that the results obtained are robust.
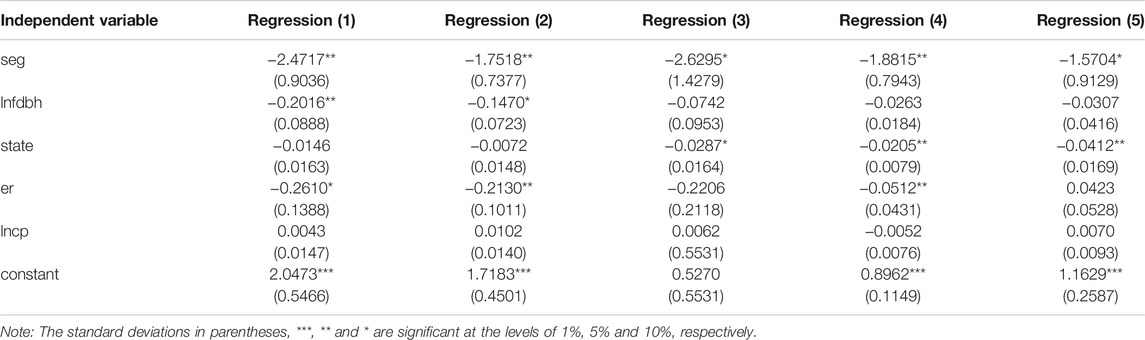
TABLE 8. Robustness test and endogenous processing results.
In order to figure out how does the market segmentation affect the efficiency of thermal power generation, we replace the dependent variable with EC, BPC, and TGC respectively. The regression model is as follows:
Where s can be EC, BPC or TGC, and the key explanatory variable and other control variables remain unchanged.
EC measures the change of intra-group generation efficiency between two periods, so it describes the “catch-up effect” of intra-group decision units on the technological frontier of the current period While TGC describes the “technology leader transfer effect” relative to the global frontier. As can be seen from Table 9, when the dependent variables are EC and TGC, there is no evidence that market segmentation has a significant impact on thermal power efficiency. This indicates that market segmentation does not significantly promote intra-regional technology sharing and development, nor does it significantly hinder inter-regional technology dissemination and sharing. As can be seen from column 3 of Table 9, the effects of market segmentation on thermal power generation efficiency are mainly achieved through BPC. This result has two main implications. Firstly, BPC measures the change of thermal power efficiency gap in the group with intertemporal technology and current technology. An increase in BPC can be seen as a kind of “innovative effect” of technology, which indicates that the gap between the current technological frontier and the inter-period technological frontier is shrinking. Thus, the degree of market segmentation may reduce the incentives for provinces to increase the efficiency of thermal power generation through investment in R&D and technological innovation. Secondly, the market segmentation mainly affects the change of thermal power generation efficiency within the group, so different regions may have unchanged and different power generation technology models due to differences in market segmentation.
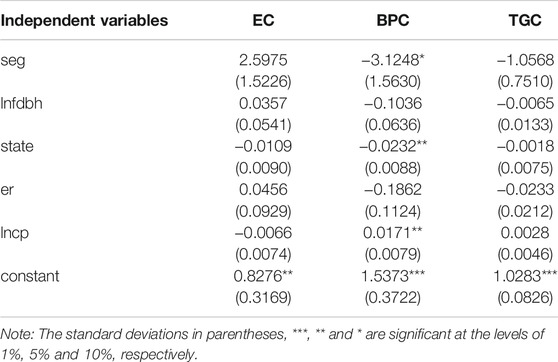
TABLE 9. The influencing path of market segmentation on thermal power efficiency.
China’s power industry is in a critical transformation period. The new round of power system reform in 2015 will have a profound impact on China’s power industry. Therefore, it’s necessary to analyze the influencing factors of thermal power generation efficiency. Based on the related data of thermal power industry in 30 provinces of China from 2005 to 2017, this paper mainly studies the influence of market segmentation on thermal power generation efficiency, and also do mechanism analysis and robustness test.
1) different regions have different thermal power efficiency. Among them, the static efficiency index expressed by UEIi and UEIg in the eastern region is significantly higher than that in the central and eastern regions, while the static efficiency index expressed by UEIc in the central region is higher than that in the eastern region. There is a clear gap. For dynamic efficiency, it is found that the average dynamic efficiency of thermal power generation in the eastern region is higher than that in the central region. And the dynamic efficiency of thermal power generation in the western region is the lowest.
2) From 2006 to 2017, the market segmentation index of China’s thermal power industry has changed significantly. The price fluctuation of thermal power industry in different provinces is heterogeneous. Guizhou, Guangdong and Tianjin have larger fluctuations, while Anhui, Hunan and Inner Mongolia have relatively small and stable fluctuations.
3) The market segmentation exhibits a significant negative impact on the efficiency of thermal power generation. And we further find that the impact of market segmentation on thermal power generation efficiency is mainly achieved through BPC. The probably reason is that the power market segmentation prevent the high-efficiency non-local power generation enterprises from surviving in the local market, which leads to the reduction of thermal power generation efficiency nationwide.
1) The government should break down local protection and inter-provincial barriers, integrate power market resources, and strengthen the union of the provincial power generation market. The primary reason for the market segmentation is that under the GDP assessment system in China, local governments have excessively pursued economic development and fiscal revenue. And the local governments have implemented local protection policies to tilt local resources to local enterprises and aimed to promote the development of local enterprises. To break down local protection and inter-provincial barriers, the central government must change the assessment mechanism for local officials, consider other factors such as regional interconnection and cross-regional trade into the assessment mechanism. This can promote the diversification of the assessment mechanism, reduce the interests of local protection, and motivate local governments to reduce direct intervention in the market. Besides, the central government should strengthen the supervision and punishment of market segmentation behaviors of the local governments. At the national level, the central government can do this through real-time monitoring of market prices. For example, using big data to analyze the price index, thereby promptly discovering and preventing market segmentation behaviors. Moreover, the central government should encourage the areas with poor economic development to actively integrate into the domestic market. The long distance between power transmission and distribution makes the cost high, and the gains from power market transactions cannot cover their cost. Therefore, the central government can promote the reasonable allocation of power resources between regions through government subsidies, and accelerate the integration of the power generation market.
2) The government should improve cross-province and cross-region power trading mechanisms and promote the optimal allocation of power resources in a larger area. The government should implement uniform power market trading rules nationwide to prevent some local governments from hindering power market transactions in order to protect their own interests, which reduces the role of market allocation of power resources. And the government should also encourage the western regions to strengthen the construction of power market trading mechanism, further improve the subsidy policy for clean power transmission in the western region on the demand side, and optimize the allocation of national power resources. Besides, the government should allow price signals exist at different times and different regions to more fully reflect the supply and demand of power, realizing the market-oriented adjustment. Under the condition of satisfying the security constrain, the optimal dispatch should be carried out for the generator set, so as to reduce the social cost for the balance of power, and realize the maximum benefit of the entire power generation system. At the same time, the government can explore the establishment of the electricity futures market, which is conducive to the formation of a unified standard in the power market. And the electricity prices will be more transparent, and grid companies can realize reasonable predictions for the electricity price.
3) The government should enhance the incentives of the power industry to improve efficiency with scientific and technological innovation in various regions, and try to realize the replication and popularization of advanced technologies. The existence of market segmentation has also led to the gradual formation and solidification of power generation technology patterns in various regions. Local enterprises lack the motivation to compete under local protection, and lack the motivation for technological innovation. All of these restrict the incentive of the thermal power industry to invest in R&D and improve efficiency, which inhibits the promotion of overall thermal power generation efficiency. In order to improve the efficiency of thermal power generation, the local governments should encourage the innovation of power plants within the region due to the actual conditions, continue to improve the power generation technology, and resolve the contradiction between high energy consumption and low output. Through the establishment of innovative subsidies for invention patents, research projects, and so on to stimulate the enterprises and researchers. And at the same time, the government should realize the sharing mechanism of technology innovation, promote the exchange of advanced experience among power plants. Furthermore, the government should set up efficient and advanced power market pilots, so as to promote the complete replication and reference of advanced technological concepts to improve the overall efficiency of thermal power generation.
The original contributions presented in the study are included in the article/Supplementary Material, further inquiries can be directed to the corresponding author.
Conceptualization, methodology and writing – original draft, ML; Software, data curation, writing – original draft, review and editing, CJ; conceptualization, data curation, writing – review and editing, supervision, YW. All authors have read and agreed to the published version of the manuscript.
ML was employed by the Company State Grid Zhejiang Electric Power Co., Ltd.
The remaining authors declare that the research was conducted in the absence of any commercial or financial relationships that could be construed as a potential conflict of interest.
All claims expressed in this article are solely those of the authors and do not necessarily represent those of their affiliated organizations, or those of the publisher, the editors and the reviewers. Any product that may be evaluated in this article, orclaim that may be made by its manufacturer, is not guaranteed or endorsed by the publisher.
1Due to the availability of data, we only have data for 2011.
2Tibet, Hong Kong, Macau, and Taiwan are not included due to the data unavailability.
Bai, X. J., and Song, Y. (2009). Environment Regulation, Technology Innovation and Efficiency Improvement of Chinese thermal Power Industry. China Ind. Economy 11, 10581. doi:10.19581/j.cnki.ciejournal.2009.08.007
Bai, C., Du, Y., Tao, Z., and Tong, Y. (2004). Local Protectionism and Industrial Concentration in China: Overall Trend and Important Factors. Economic Research Journal 04, 29–40. (In Chinese)
Chambers, R. G., Chung, Y., and Färe, R. (1996). Benefit and Distance Functions. J. Econ. Theor. 70 (2), 407–419. doi:10.1006/jeth.1996.0096
Chen, M., Ma, M., Lin, Y., Ma, Z., and Li, K. (2022). Carbon Kuznets Curve in China's Building Operations: Retrospective and Prospective Trajectories. Sci. Total Environ. 803, 150104. doi:10.1016/j.scitotenv.2021.150104
Cheng, S., Wu, Y., Chen, H., Chen, J., Song, M., and Hou, W. (2019). Determinants of Changes in Electricity Generation Intensity Among Different Power Sectors. Energy Policy 130, 389–408. doi:10.1016/j.enpol.2019.04.029
Cheng, Z., Liu, J., Li, L., and Gu, X. (2020). Research on Meta-Frontier Total-Factor Energy Efficiency and its Spatial Convergence in Chinese Provinces. Energy Econ. 86, 104702. doi:10.1016/j.eneco.2020.104702
Duan, N., Guo, J.-P., and Xie, B.-C. (2016). Is There a Difference between the Energy and CO2 Emission Performance for China's thermal Power Industry? A Bootstrapped Directional Distance Function Approach. Appl. Energ. 162, 1552–1563. doi:10.1016/j.apenergy.2015.02.066
Eguchi, S., Takayabu, H., and Lin, C. (2021). Sources of Inefficient Power Generation by Coal-Fired Thermal Power Plants in China: A Metafrontier DEA Decomposition Approach. Renewable and Sustainable Energy Reviews 138, 110562. doi:10.1016/j.rser.2020.110562
Fallahi, A., Ebrahimi, R., and Ghaderi, S. F. (2011). Measuring Efficiency and Productivity Change in Power Electric Generation Management Companies by Using Data Envelopment Analysis: A Case Study. Energy 36 (11), 6398–6405. doi:10.1016/j.energy.2011.09.034
Fan, C. S., and Wei, X. (2006). The Law of One price: Evidence from the Transitional Economy of China. Rev. Econ. Stat. 88, 682–697. doi:10.1162/rest.88.4.682
Fan, J. Y., and Lin, Y. (2011). Product’s Homogeneity, Local Protection of Investment and Measure of the Integration of Domestic Market. Econ. Res. J. 46 (11), 48–59.
Feng, C., Zhang, H., and Huang, J.-B. (2017). The Approach to Realizing the Potential of Emissions Reduction in China: an Implication from Data Envelopment Analysis. Renew. Sust. Energ. Rev. 71, 859–872. doi:10.1016/j.rser.2016.12.114
Fukuyama, H., and Weber, W. L. (2009). A Directional Slacks-Based Measure of Technical Inefficiency. Socio-Economic Plann. Sci. 43 (4), 274–287. doi:10.1016/j.seps.2008.12.001
He, W., Wang, Danish, B., Danish, Z., and Wang, Z. (2018). Will Regional Economic Integration Influence Carbon Dioxide Marginal Abatement Costs? Evidence from Chinese Panel Data. Energ. Econ. 74, 263–274. doi:10.1016/j.eneco.2018.06.010
Hu, X. T., and Zhang, L. (2005). Local Protectionism and Regional Specialization—A Model and Econometric Evidences. Econ. Res. J. 02, 102–112.
Jaraitė, J., and Di Maria, C. (2012). Efficiency, Productivity and Environmental Policy: A Case Study of Power Generation in the EU. Energ. Econ. 34 (5), 1557–1568. doi:10.1016/j.eneco.2011.11.017
Kwakwa, P. A. (2021). The Carbon Dioxide Emissions Effect of Income Growth, Electricity Consumption and Electricity Power Crisis. Meq 32 (3), 470–487. doi:10.1108/MEQ-11-2020-0264
Li, A., Zhang, A., Huang, H., and Yao, X. (2018). Measuring Unified Efficiency of Fossil Fuel Power Plants across Provinces in China: An Analysis Based on Non-radial Directional Distance Functions. Energy 152, 549–561. doi:10.1016/j.energy.2018.03.164
Li, J., and Lin, B. (2017). Does Energy and CO2 Emissions Performance of China Benefit from Regional Integration? Energy Policy 101, 366–378. doi:10.1016/j.enpol.2016.10.036
Li, J. L., and Xu, B. (2018). Curse or Blessing: How Does Natural Resource Abundance Affect Green Economic Growth in China? Econ. Res. J. 53 (09), 151–167.
Li, K., Ma, M., Xiang, X., Feng, W., Ma, Z., Cai, W., et al. (2022). Carbon Reduction in Commercial Building Operations: A Provincial Retrospection in China. Appl. Energ. 306, 118098. doi:10.1016/j.apenergy.2021.118098
Li, S. (2015). Technical Efficiency Analysis of thermal Power Industry Based on Stochastic Frontier Production Function and Provincial Panel Data. Macroeconomics 23, 16304. doi:10.16304/j.cnki.11-3952/f.2015.10.002
Li, S. T., and Hou, Y. Z. (2008). Regional Coordinated Development and Market Integration in China. Beijing: Economic Science Press.
Lin, B., and Du, K. (2015). Energy and CO2 Emissions Performance in China's Regional Economies: Do Market-Oriented Reforms Matter? Energy Policy 78, 113–124. doi:10.1016/j.enpol.2014.12.025
Lin, B., and Liu, H. (2018). Do Energy and Environment Efficiency Benefit from Foreign Trade?——The Case of China's Industrial Sectors. Economic Research Journal 50 (09), 127–141. (In Chinese).
Lin, C., Li, Y., Cai, Q., Shi, P., Song, M., and Wu, W. (2021). Evaluation on the Cost of Energy Transition: A Case Study of Fujian, China. Front. Energ. Res. 9. doi:10.3389/fenrg.2021.630847
Liu, Y., Zhao, G., and Zhao, Y. (2016). An Analysis of Chinese Provincial Carbon Dioxide Emission Efficiencies Based on Energy Consumption Structure. Energy Policy 96, 524–533. doi:10.1016/j.enpol.2016.06.028
Long, X., Chen, B., and Park, B. (2018). Effect of 2008's Beijing Olympic Games on Environmental Efficiency of 268 China's Cities. J. Clean. Prod. 172, 1423–1432. doi:10.1016/j.jclepro.2017.10.209
Long, X., Wang, X., Mensah, C. N., Wang, M., and Zhang, J. (2019). Spatial and Temporal Heterogeneity of Environmental Efficiency for China's Hotel Sector: New Evidence through Metafrontier Global Malmquist-Luenberger. Environ. Sci. Pollut. Res. 26 (26), 27534–27541. doi:10.1007/s11356-019-05963-9
Lu, M., and Chen, Z. (2009). Fragmented Growth: Why Economic Opening May Worsen Domestic Market Segmentation? Econ. Res. J. 44 (03), 42–52.
Naughton, B. (2000). How Much Can Regional Integration Do to Unify China's Markets. Paper for Conference on Policy Reform in China, Center for Research on Economic Development and Policy Research. (Working Paper No.58).
Parsley, D. C., and Wei, S.-J. (1996). Convergence to the Law of One price without Trade Barriers or Currency Fluctuations. Q. J. Econ. 111 (4), 1211–1236. doi:10.2307/2946713
Parsley, D. C., and Wei, S.-J. (2001a). Explaining the Border Effect: the Role of Exchange Rate Variability, Shipping Costs, and Geography. J. Int. Econ. 55 (1), 87–105. doi:10.1016/S0022-1996(01)00096-4
Parsley, D. C., and Wei, S. J. (2001b). Limiting Currency Volatility to Stimulate Goods Market Integration: a Price-Based Approach. CEPR Discussion Papers. No.W8468.
Poncet, S. (2003). Measuring Chinese Domestic and International Integration. China Economic Review 14 (1), 1–21. doi:10.1016/S1043-951X(02)00083-4
Qi, X.-F., and Zhou, L.-H. (2020). Market Segmentation and Energy Efficiency-An Empirical Study Based on China's Provincial Panel Data. Energy Efficiency 13 (8), 1781–1797. doi:10.1007/s12053-020-09908-x
Samuelson, P. A. (1964). Theoretical Notes on Trade Problems. Rev. Econ. Stat. 46, 145–154. doi:10.2307/1928178
Song, H., Sun, Y. J., and Chen, D. K. (2019). Assessment for the Effect of Government Air Pollution Control Policy: Empirical Evidence from “Low-Carbon City” Construction in China. Manag. World 16, 19744. doi:10.19744/j.cnki.11-1235/f.2019.0082
Song, W., Bi, G.-b., Wu, J., and Yang, F. (2017). What Are the Effects of Different Tax Policies on China's Coal-Fired Power Generation Industry? an Empirical Research from a Network Slacks-Based Measure Perspective. J. Clean. Prod. 142, 2816–2827. doi:10.1016/j.jclepro.2016.10.187
Sueyoshi, T., and Goto, M. (2011). DEA Approach for Unified Efficiency Measurement: Assessment of Japanese Fossil Fuel Power Generation. Energ. Econ. 33 (2), 292–303. doi:10.1016/j.eneco.2010.07.008
Sueyoshi, T., Li, A., and Gao, Y. (2018). Sector Sustainability on Fossil Fuel Power Plants across Chinese Provinces: Methodological Comparison Among Radial, Non-radial and Intermediate Approaches under Group Heterogeneity. J. Clean. Prod. 187, 819–829. doi:10.1016/j.jclepro.2018.03.216
Sun, X., Zhou, X., Chen, Z., and Yang, Y. (2020). Environmental Efficiency of Electric Power Industry, Market Segmentation and Technological Innovation: Empirical Evidence from China. Science of the Total Environment 706, 135749. doi:10.1016/j.scitotenv.2019.135749
Tang, K. K. (1998). Economic Integration of the Chinese Provinces : A Business Cycle Approach. Jei 13, 549–570. doi:10.11130/jei.1998.13.4.549
Wang, C., Cao, X., Mao, J., and Qin, P. (2019). The Changes in Coal Intensity of Electricity Generation in Chinese Coal-Fired Power Plants. Energ. Econ. 80, 491–501. doi:10.1016/j.eneco.2019.01.032
Wang, F. (2014). Study on Regional Differences and Influencing Factors of Environmental Efficiency in Thermal Power Industry. Baoding: North China Electric Power University.
Wang, J., Dong, Y., and Jiang, H. (2014). A Study on the Characteristics, Predictions and Policies of China's Eight Main Power Grids. Energ. Convers. Manag. 86, 818–830. doi:10.1016/j.enconman.2014.06.045
Wang, M., Chen, Y., and Zhou, Z. (2021). Assessing Environmental Efficiency of China's Industry System Using Two-Stage Range-Adjusted Measure Model. Meq 32 (6), 1401–1421. doi:10.1108/MEQ-12-2020-0282
Wang, R.-M., Tian, Z., and Ren, F.-r. (2021). Energy Efficiency in China: Optimization and Comparison between Hydropower and thermal Power. Energ Sustain. Soc. 11 (1), 1–21. doi:10.1186/s13705-021-00311-7
Wang, Z., Liu, M., and Yan, J. (2021). Flexibility and Efficiency Co-enhancement of thermal Power Plant by Control Strategy Improvement Considering Time Varying and Detailed Boiler Heat Storage Characteristics. Energy 232, 121048. doi:10.1016/j.energy.2021.121048
Wei, C., Löschel, A., and Liu, B. (2015). Energy-saving and Emission-Abatement Potential of Chinese Coal-Fired Power enterprise: A Non-parametric Analysis. Energ. Econ. 49, 33–43. doi:10.1016/j.eneco.2015.02.002
Wei, C., and Zheng, X. Y. (2017). A New Perspective of Energy Efficiency Improvement: A Test Based on Market Segmentation. Social Sci. China 10, 90–111.
Xu, X. (2002). Have the Chinese Provinces Become Integrated under Reform? China Econ. Rev. 13, 116–133. doi:10.1016/S1043-951X(02)00058-5
Xu, X. X., Li, X., and Wang, M. J. (2007). Regional Integration, Economic Growth and Political Promotion. China Econ. Q. 04, 1075–1096.
Yi, L., Zhang, W., Liu, Y., and Zhang, W. (2021). An Analysis of the Impact of Market Segmentation on Energy Efficiency: A Spatial Econometric Model Applied in China. Sustainability 13 (14), 7659. doi:10.3390/su13147659
Young, A. (2000). The Razor's Edge: Distortions and Incremental Reform in the People's Republic of China. Q. J. Econ. 115 (4), 1091–1135. doi:10.1162/003355300555024
Yu, C., Liu, Y., and Wang, C. (2009). Research on ZigBee Wireless Sensors Network Based on ModBus Protocol. Wsn 01, 43–47. doi:10.4236/wsn.2009.11007
Zhang, N., and Choi, Y. (2013). Total-factor Carbon Emission Performance of Fossil Fuel Power Plants in China: A Metafrontier Non-radial Malmquist index Analysis. Energ. Econ. 40, 549–559. doi:10.1016/j.eneco.2013.08.012
Zhang, D., and Lu, Y. (2017). Impact of Market Segmentation on Energy Efficiency. China Population, Resources and Environment 27 (1), 65–72. (In Chinese). doi:10.3969/j.issn.1002-2104.2017.01.008
Zhang, S., Ma, M., Li, K., Ma, Z., Feng, W., and Cai, W. (2022). Historical Carbon Abatement in the Commercial Building Operation: China versus the US. Energ. Econ. 105, 105712. doi:10.1016/j.eneco.2021.105712
Zhao, X., and Ma, C. (2013). Deregulation, Vertical Unbundling and the Performance of China's Large Coal-Fired Power Plants. Energ. Econ. 40, 474–483. doi:10.1016/j.eneco.2013.08.003
Zheng, Y. S., and Li, C. G. (2003). Efficiency Loss Caused by Regional Separation. Soc. Sci. China 01, 64–72.
Zhou, L. A. (2004). Incentives and Cooperation of Government Officials in the Promotion Game——Also on the Long-Standing Reasons for China's Local Protectionism and Repeated Construction Problems. Econ. Res. J. 06, 33–40.
Zhou, P., Ang, B. W., and Wang, H. (2012a). Energy and CO2 Emission Performance in Electricity Generation: A Non-radial Directional Distance Function Approach. Eur. J. Oper. Res. 221 (3), 625–635. doi:10.1016/j.ejor.2012.04.022
Zhou, P., Ang, B. W., and Zhou, D. Q. (2012b). Measuring Economy-wide Energy Efficiency Performance: A Parametric Frontier Approach. Appl. Energ. 90 (1), 196–200. doi:10.1016/j.apenergy.2011.02.025
Zhu, Q., Song, M., and Wu, J. (2020). Extended Secondary Goal Approach for Common Equilibrium Efficient Frontier Selection in DEA with Fixed-Sum Outputs. Comput. Ind. Eng. 144, 106483. doi:10.1016/j.cie.2020.106483
Zhu, L., Wang, Y., Shang, P., Qi, L., Yang, G., and Wang, Y. (2019). Improvement Path, the Improvement Potential and the Dynamic Evolution of Regional Energy Efficiency in China: Based on an Improved Nonradial Multidirectional Efficiency Analysis. Energy Policy 133, 110883. doi:10.1016/j.enpol.2019.110883
Keywords: thermal power generation efficiency, market segmentation, non-radial direction distance function, amazon glacier cost model, innovation effect
Citation: Liu M, Ju C and Wang Y (2022) The Impacts of Market Segmentation on Thermal Power Generation Efficiency. Front. Energy Res. 9:811577. doi: 10.3389/fenrg.2021.811577
Received: 09 November 2021; Accepted: 13 December 2021;
Published: 14 January 2022.
Edited by:
Yongping Sun, Hubei University Of Economics, ChinaReviewed by:
Ming Zhang, China University of Mining and Technology, ChinaCopyright © 2022 Liu, Ju and Wang. This is an open-access article distributed under the terms of the Creative Commons Attribution License (CC BY). The use, distribution or reproduction in other forums is permitted, provided the original author(s) and the copyright owner(s) are credited and that the original publication in this journal is cited, in accordance with accepted academic practice. No use, distribution or reproduction is permitted which does not comply with these terms.
*Correspondence: Yan Wang, d2FuZ3lhbl94bXVAMTYzLmNvbQ==
Disclaimer: All claims expressed in this article are solely those of the authors and do not necessarily represent those of their affiliated organizations, or those of the publisher, the editors and the reviewers. Any product that may be evaluated in this article or claim that may be made by its manufacturer is not guaranteed or endorsed by the publisher.
Research integrity at Frontiers
Learn more about the work of our research integrity team to safeguard the quality of each article we publish.