- Key Laboratory of Modern Power System Simulation and Control and Renewable Energy Technology, Ministry of Education, Northeast Electric Power University, Jilin, China
The high proportion of renewable energy sources (RESs) in the system reduces the frequency support capacity and aggravates the generation of unbalanced power, while the dynamic frequency dispersion makes it difficult for a centralized energy storage system (ESS) to take into account the frequency requirements of different regions. In this context, the research takes the region with high penetration of RESs and frequent power fluctuations as the grid node of the ESS. By configuring the parameters of the ESS under the control strategy of virtual synchronous generators, the inertia and the primary frequency reserve of the system are supplemented, and the regulation characteristics of the ESS are depicted. Taking the steady-state recovery time and the amplitude coefficient as the evaluation indexes, the effects of the virtual inertia constant, the virtual damping coefficient, and the virtual frequency regulation coefficient on the behavior of the ESS are deeply analyzed. Finally, the quantitative configuration of the ESS is realized by considering the frequency response and the dynamic frequency dispersion.
1 Introduction
The substitution of RESs for fossil fuels is an effective way to achieve carbon neutrality. However, the frequency regulation characteristics of the power electronic converter–based RESs differ from those of the traditional synchronous units (Zhang and Sun, 2020; Zhang et al., 2020). Therefore, a high proportion of RES penetration will reduce the stability of the system operation to a certain extent (Nasirov and Agostini, 2021).
After generating the unbalanced power, the system establishes a new stable state through the inertia response (IR), the primary frequency regulation (PFR), the secondary frequency regulation (SFR), and the tertiary frequency regulation (TFR) (Rodrigues et al., 2020). Most of the fluctuations caused by the load and RESs are frequent, and their predictability is weak. This should be adjusted by the IR and the PFR automatically (Yi et al., 2020). During the adjustment process, the rate of change of frequency (ROCOF) and the steady-state frequency deviation (SSFD) are the main indices to evaluate the frequency stability of the system (Homan et al., 2021).
To improve the frequency supportability of the system, RESs usually simulate the inertia response and the frequency regulation process of the synchronous generators by optimizing the control strategy (Vidyanandan and Senroy, 2013; Gholamrezaie et al., 2018; Peng et al., 2019; Tang et al., 2019). But this method needs the active power reserve of the RESs, which makes it difficult to operate at the maximum power, resulting in low power conversion efficiency. Therefore, to absorb the redundant power, a combined strategy for the frequency regulation control of wind and its storage has been adopted that considers the wind speed fluctuation range (Zhang et al., 2017). The technology of demand side management (DSM) based on various energy storage devices was proposed in the studies by Douglass et al., 2013; Qi et al., 2021; and Sm et al., 2021. However, the location of the energy storage equipment at the RESs and the users is scattered, which makes it difficult to regulate centrally. This also reduces the reliability and flexibility of the regulation process.
The development of large-scale energy storage technology results in the wide use of the ESS for the frequency support of the grid (Miguel et al., 2014; Yue and Wang, 2015; Knap et al., 2016; Liu et al., 2018; Zhao et al., 2019; Sockeel et al., 2020; Zhang et al., 2020; Liu et al., 2021; Pinthurat and Hredzak, 2021; Wei et al., 2021). By simulating the external characteristics of the synchronous units in the control strategy, the response speed of the ESS can be consistent with the frequency regulation process of the system (Miguel et al., 2014; Liu et al., 2018; Zhang et al., 2020; Pinthurat and Hredzak, 2021; Wei et al., 2021). In the study by Miguel et al., (2014), an adaptive control strategy for adjusting the ESS output with the state of charge and the frequency deviation was proposed, which took into account both the frequency regulation effect and the charge retention rate of the ESS. In the study by Zhang et al., (2020), the integral control based on the frequency deviation was introduced into the ESS controller, where the system frequency was adjusted without an error through the coordination of the end frequency converter. In the study by Liu et al., (2018), a virtual synchronous generator control strategy based on the third-order model of the synchronous generators was proposed by simulating the process of automatic excitation voltage regulation, which further enhanced the support capacity of the ESS. However, these research studies mainly focused on the design of the VSG control strategies so that the influence of the ESS capacity and the parameter configuration on the frequency supportability was less concerned.
As an important study part of the VSG, the energy storage unit realizes the reasonable configuration of the capacity and the parameters, which can greatly reduce the cost of the configuration and promote the popularization of the ESS technology. To make the ESS provide better frequency supportability for a high RES penetration system, the current research mainly focused on the following two aspects:
In order to optimize the investment and the economic benefit of the ESS, improving the multi-objective optimization model and algorithm to realize the rational allocation of the multi-energy systems has become one of the hotspots of current research. The reference (Li et al., 2020) established a dual-mode energy management model and proposed a distributed dynamic event-triggered Newton–Raphson algorithm to realize the optimal allocation of power, heat, and gas energy prices in multi-energy systems. The reference (Li et al., 2021) further optimized the algorithm on this basis. By analyzing the impact of the persistent DoS attacks on the system, the stability and the economy of the multi-energy system are improved. Aiming at the combined economic environmental dispatch, a distributed consensus-based algorithm combined with dynamic weights was proposed in the reference (Liu et al., 2021) to realize the reasonable allocation of the ESS. In the above research, the ESS configuration was studied through algorithms, which cannot analyze in detail the participation of the ESS in the frequency adjustment.
To analyze the frequency supportability of the ESS, the configuration parameters of the ESS are usually taken as variables to evaluate their contribution to the frequency response (Yue and Wang, 2015; Knap et al., 2016; Zhao et al., 2019; Sockeel et al., 2020; Liu et al., 2021). The relationship curves of the virtual inertia provided by the ESS along with its size and control parameters were described in the studies by Yue and Wang, 2015; Zhao et al., 2019; and Sockeel et al., 2020. Based on the target values of the inertia constant and the droop coefficient, the capacity of the ESS in different frequency support stages was estimated (Knap et al., 2016). To optimize the configuration result of the ESS, the coordination relationship between the ESS capacity and its control parameters was established (Liu et al., 2021). However, the ESS configuration process mainly considers the magnitude of the unbalanced power in recent research; it lacks a discussion on the spatial position of the power fluctuation, and the study on the differences between the effects of different control parameters was superficial, which partly reduces the accuracy of the ESS configuration results.
Therefore, based on the generation position of the unbalanced power, this research investigates the influence of the dispersion of the dynamic frequency in the system on the behaviors of the ESS under the VSG control strategy, compares the active output curves of the ESS and the synchronous generator through theoretical analysis and simulations, and analyzes the frequency regulation characteristics of the ESS. Finally, the regions with high RES permeability and frequent power fluctuations are selected as the grid connection node of the ESS to ensure the optimal regulation performance. On this basis, the steady-state recovery time and the amplitude coefficient are defined as evaluation indexes. Based on these indexes, the effects of the virtual inertia constant, the virtual damping coefficient, and the virtual frequency regulation coefficient on the dynamic behavior and the support capacity of the ESS are analyzed, and their optimal configuration is realized, to realize the quantitative configuration of the ESS that meets the frequency response and the dynamic frequency dispersion of the system.
2 Characteristics of the Frequency Response
2.1 Frequency Response Requirements
The difference in the increment between the load and the power output in the system is defined as an unbalanced power ΔPsys. If only the supporting effect of the synchronous unit is considered before the governor is started, the expression of the initial ROCOF concerning the ΔPsys can be expressed as follows:
where Hsys and Ssys are the equivalent inertia constant and the installed capacity of the system, respectively. Hsys describes the value of the mechanical inertia, which can be obtained by the following equation:
where Hi and Si are the inertia constant and rated capacity of each synchronization unit in the system.
After the governor is put into operation, the system enters the stage of the PFR. If no further regulation process is considered, the relationship between the SSFD and the ΔPsys can be expressed as follows:
where Ksys is the frequency regulation coefficient of the system, which can be obtained as follows:
where σi is the adjustment coefficient of each synchronization unit.
Therefore, when the maximum unbalanced power ΔPsysm and the frequency response requirements of the system are known, the relationship between the inertia constant, the frequency regulation coefficient, and the capacity of the frequency support unit that the system needs to supplement can be established using the relevant equations.
2.2 Dynamic Frequency Dispersion
The frequency of each region is synchronous when the system is in a steady state. However, the fluctuation in the output of the RESs and the load switching causes the system to go through the process of balancing the supply and the demand balance for a long time, which leads to the continuous redistribution of the unbalanced power among the units. Due to the different electrical distances between the power fluctuation point and each bus, the uneven geographical distribution of the generators and the loads, different inertia and damping among the synchronous units, and the frequency of each node in the power grid cannot be adjusted synchronously in a short time scale, and the transient process is complex. The frequency response presents a spatial-temporal distribution, i.e., the dynamic frequency dispersion (Li et al., 2019).
As a result, the response mode of the synchronous unit after the unbalanced power is generated and can be expressed as a three-stage principle (Sonny, 2007). When the power fluctuates, the impact power is distributed according to the electrical distance, and the unit which is closer to the disturbance location bears the most power; in the inertia support stage, the transient process is described by the rotor motion equation, and the unit with a larger inertia constant and damping coefficient has a higher proportion of the support power. When the system is stabilized after the primary frequency regulation, each regulation unit allocates the unbalanced power according to the frequency regulation coefficient. Affected by this, it is difficult to accurately configure the virtual inertia according to the requirements of the specified region only by the theoretical derivation.
3 Control Strategy of the ESS
Without considering the limitations of the ESS source characteristics, the energy throughput of the ESS is mainly decided by the control strategy of its grid-connected inverter. The virtual synchronous generator (VSG) control is usually adopted to make the ESS have the same frequency regulation characteristics as the synchronous units and to improve the power angle stability.
Most of the research studies found that the difference between the droop control and the VSG control is mainly reflected in the introduction of the virtual angular velocity and the use of the phase-locked loop. Some studies also regard droop control as a typical VSG control. Although the related control is different in structure, it has its applicable scenarios and advantages.
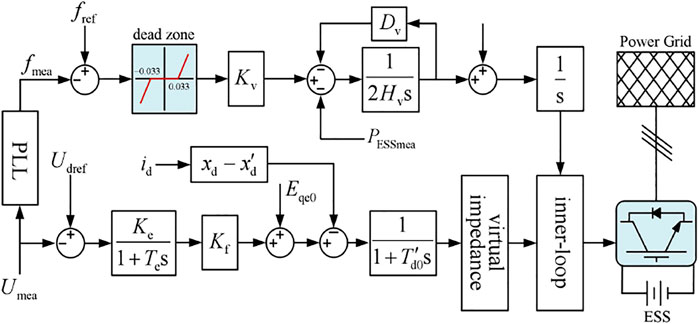
To simulate the external characteristics of synchronous generators preferably and supplement the inertia, the damping, and the capacity of the PFR distinctively, the ESS in this study adopts the control strategy shown in Figure 1. By simulating the IR and the PFR processes of the synchronous units, the time scale of the ESS speed regulation system can be consistent with the adaptive process of the system, which ensures the smooth power angle switching of the converter.
Among these, the second-order rotor motion equation of the synchronous generator is as follows:
where Hv is the virtual inertia constant, Dv is the virtual damping coefficient, ω is the virtual angular velocity, Δω is the virtual angular velocity deviation, δ is the virtual power angle, and Pt and Pe are the mechanical power and the electromagnetic power of the generator, corresponding to the reference power and the output power of the ESS, respectively.
On this basis, by simulating the power-frequency process of the synchronous units, the ESS realizes the automatic allocation of the unbalanced power with the synchronous units in the PFR:
where Kv is the virtual frequency regulation coefficient, fref is the reference frequency, fmea is the measured frequency, and Pref is the reference value of the steady-state ESS output power.
Meanwhile, based on the traditional second-order control model of the VSG, the first-order transient voltage equation of the synchronous generator is simulated, and the transient voltage regulation process is introduced to improve the transient voltage regulation process of the ESS converter. The third-order model of the VSG is established, and the equation is as follows:
where Eq’ is the transient electromotive force, Eqe is the forced no-load electromotive force, id is the direct axis current component, xd is the direct axis synchronous reactance, and x’d is the direct axis transient reactance. Td0’ is the time constant of excitation windings of the synchronous generator.
On this basis, to maintain the terminal voltage stability of the ESS grid-connected inverter, the automatic regulating excitation system is introduced into the control, which is equivalent to the first-order inertia link, where the starting signal is the voltage deviation.
where Umea is the measured value of the inverter outlet voltage, Uref is the reference value of the inverter outlet voltage, ΔEqe is the forced no-load electromotive force deviation, Ke is the equivalent magnification, Te is the time constant, and Kf is the excitation proportional coefficient.
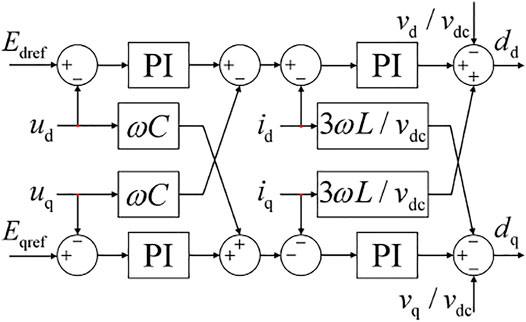
The VSG control strategy shown in Figure 1 can be obtained by combining formulas (Eqs 5–8), in which the inner-loop control is realized by using the voltage and current double-loop control, as shown in Figure 2 (Liu and Yang, 2021), that is, the droop control of the ESS grid-connected inverter is realized through the power outer loop and the voltage and current inner loop, and finally, the modulation signal is the output through SVPWM.
From the above derivation process, it can be seen that Hv determines the duration of the power output and the inertia support capacity of the ESS in the phase of IR, Dv determines the oscillations in the ESS frequency regulation output during the transient phase, which significantly affects the steady-state recovery time of the system, and Kv determines the frequency regulation depth of the ESS to meet the PFR demand of the grid.
In addition, the voltage regulation process of the ESS is also designed in the control strategy, which is thoroughly described in (Liu et al., 2018). Since the configuration of the ESS is mainly applied to the active power/frequency support requirements of the system, the change in the node voltage and the reactive power output of the ESS will not be discussed in depth.
4 Configuration of the ESS
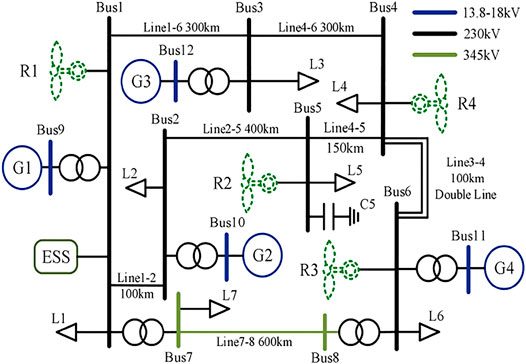
To validate the proposed work, the 12-bus power system shown in Figure 3 is built in the PowerFactory/DIgSILENT, where the system is divided into 7 regions according to the bus and the load location. Among them, the total installed capacity of the system is 2248MVA (1124MVA for RESs R1–R4 and 1124MVA for traditional power plants G1–G4), the total active load L1–L7 is 1450MW, the maximum output power of the ESS is 70MW, and the inertia constant and the adjustment coefficient of the synchronous units are 5s and 0.04, respectively. Under the time scales and the assumptions discussed in the study, the RES units operate at the maximum power, ignoring the frequency support capacity.
Without considering the fault, the unbalanced power in the 12-bus system is mainly caused by the switching of the generator, the uncertainty of the RES output, and the fluctuation in the load. Compared to the pure power fluctuation, the switching of synchronous units will change the inertia and the PFR capacity of the system itself; as a result, the influence on the frequency response should be more obvious. However, the time scale of the traditional unit switching is beyond the discussion scope of the IR and the PFR, and so, in this study, the load power increment of 145 MW is taken as the reference maximum power increment ΔPsysm to configure the control parameters of the ESS.
4.1 The Influence of the Dynamic Frequency Dispersion
To analyze the influence of the dynamic frequency dispersion on the frequency response at different regions in the system, bus 1 and bus 4 are taken as the measuring points in this case, and the same active power increment of 145 MW is set for L1–L4 in 200s, respectively. The waveforms of the frequency response are obtained and are shown in Figures 4, 5.
As shown in Figure 4, when the same power increment is generated in different regions of the system, the SSFD after the PFR will not be affected, but the transient process differs. Specifically, the closer the frequency measurement point is to the power fluctuation point, the faster is the change rate of the frequency measurement value. This is also reflected in Figure 5.
On this basis, comparing Figures 4, 5, it can be seen that in the initial stages of power fluctuation, the frequency measurement data at bus 1 are smoother than that at bus 4. The main reason is that bus 1 is directly connected to the synchronous power plant G1, which has a strong inertia support capacity, while the RES plant R4 at bus 4 operates at a constant power, and so, initially it is unable to supplement the active power shortage.
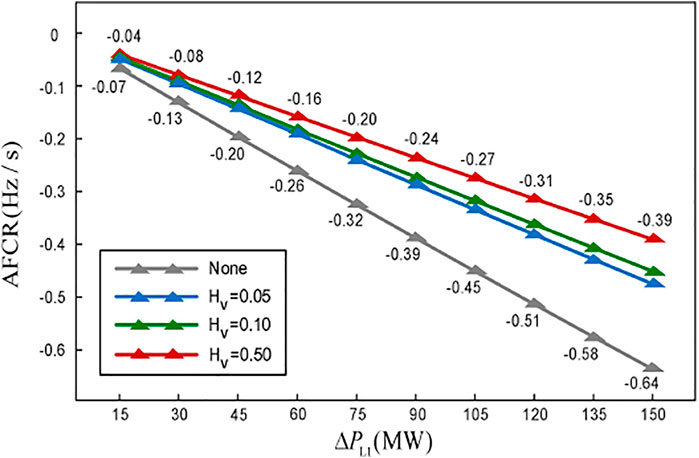
In general, the measurement window (frequency sampling period) of the ROCOF is between 40 ms and 2s (Ten and Crossley, 2008). The smaller the measurement window, the more accurate is the measurement result for the ROCOF. However, the influence of the high-frequency signal is pronounced. Conversely, the larger the measurement window, the smoother is the ROCOF measurement result, but it is more difficult to accurately describe the trend of the ROCOF. Therefore, to avoid the error caused by the ROCOF measurement process and considering the actual engineering requirements, the average frequency change rate (AFCR) within 0–0.25 s after the unbalanced power is generated is defined as the initial ROCOF, and the corresponding inertia of the system is defined as the equivalent inertia constant Hess according to (1). This processing method can reduce the influence of high-frequency signals on the measurement results of the PLL, and it converts the effect of the damping and the electrical distance into relative inertia, which lays the foundation for the quantitative configuration of the virtual inertia below.
The active power output curves of the ESS and the G3 are shown in Figure 6. It can be seen that the ESS under the control strategy of the VSG has similar frequency regulation characteristics as the synchronous unit. That is, the ESS or the synchronous unit close to the power fluctuation point provides more power support in the event of the unbalanced power generation, which eventually reaches the steady state through the IR and the PFR according to the three-stage principle mentioned above.
In summary, due to the dispersion of the dynamic frequency, the position of the power fluctuation will significantly impact the output power of frequency support units and the frequency response in different regions, within a short time period. Therefore, to ensure the frequency response requirements of different time scales and different regions, the ESS should select the region with the most serious power fluctuation to configure its parameters without considering the capacity limitation. Considering the distribution of the generators and the load in the system, the following example takes the frequency response requirements of region 1 under the maximum power increment to configure the related parameters of the ESS.
4.2 Configuration of the Damping
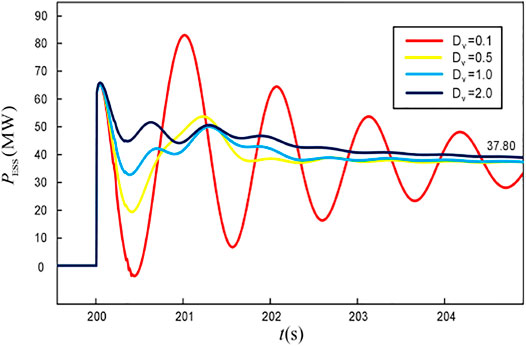
The virtual damping coefficient Dv mainly affects the oscillation mode of the frequency and the unit output, which determine the steady-state recovery time of the system after the disturbance, so it needs to be prioritized. In case 2, bus 1 is taken as the frequency measurement point, and the active power increment of 145 MW is set for L1 at 200s. The system frequency response and the ESS output waveforms under different Dv are obtained as shown in Figures 7, 8.
It can be seen from the figure that the improvement of the virtual damping coefficient can effectively suppress the frequency oscillation and smoothen the transient output of the ESS. Under the control strategy of the grid-connected inverter, the value of Dv will not affect the steady-state output power of the ESS, so it will not change the PFR result of the system. Moreover, both the rotor motion equation in Eq. 5 and the simulation results in Figure 7 show that the existence of the damping can reduce the ROCOF of the system, and its effect increases with the increase of Δf before the governor acts.
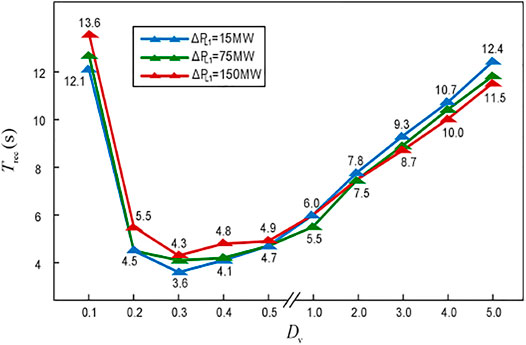
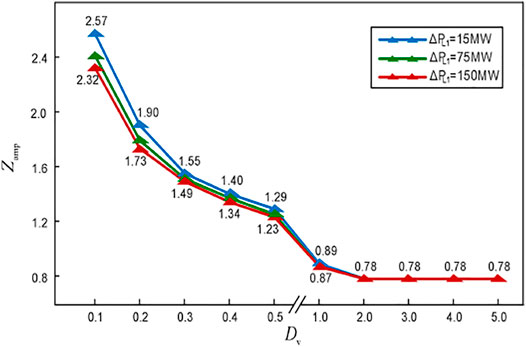
Furthermore, to quantitatively analyze the influence of the virtual damping coefficient on the system frequency recovery process, the time interval from the power fluctuation to system frequency fluctuation less than 1% is defined as the steady-state recovery time Trec, and the ratio of the difference between the maximum and minimum output power of the ESS and its steady-state output power is defined as the amplitude coefficient Zamp. The changing trends of the Trec and the Zamp under different power fluctuations and different virtual damping coefficients are shown in Figures 9, 10, respectively, and the simulation waveforms are shown in Supplementary Appendix Figure SA1.
As shown in Figure 9, the variation in Trec with respect to Dv is the same under different power increments. The specific performance is as follows: when Dv is very small, Trec is large and the system frequency’s steady-state recovery process takes a long time; with the increase in Dv, Trec decreases, and it again increases when Dv reaches a certain value. It can be seen that the unreasonable damping value will have adverse effects on the steady-state recovery of the system.
The amplitude coefficient Zamp in Figure 10 describes the oscillation characteristics of the ESS output power. Thus, it is clear that a large value of Zamp will not only aggravate the output fluctuation of the ESS but also increases the power capacity requirement. Therefore, considering the indices, Trec and the Zamp, the Dv is set as 1.0 in the example.
4.3 Configuration of the Inertia
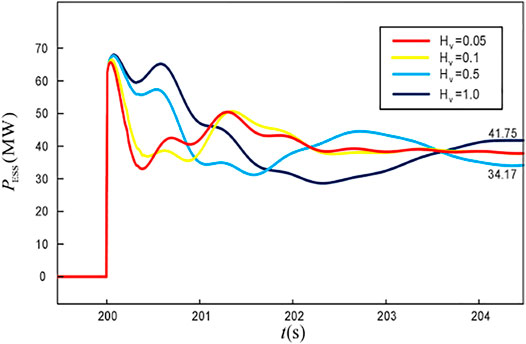
The inertia is the ability of the system to block the sudden change in the frequency, which mainly affects the ROCOF and the smoothness of the unit output. In case 3, bus 1 is still taken as the frequency measurement point, and the active power increment of 145 MW is set for L1 at 200s. The frequency response and the ESS output waveforms for the different virtual inertia constants Hv are obtained, as shown in Figures 11, 12.
As seen from Figure 11, the increase in the virtual inertia constant can reduce the ROCOF within a certain range. Compared to Figures 7, 11, it can be seen that Hv improves the ROCOF in a short time scale after the unbalanced power generation. This improvement is more profound than that achieved using Dv.
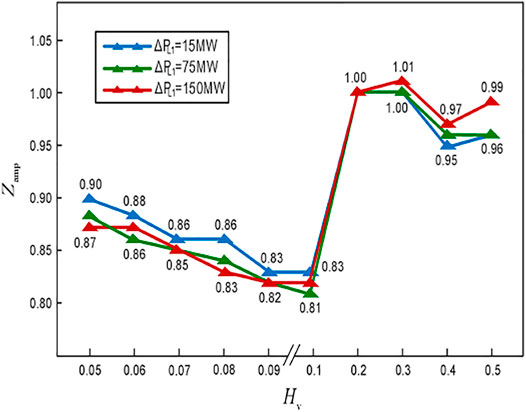
To further compare the effect of Hv and Dv on the ESS dynamic behavior and frequency recovery process, the variations in Trec and Zamp for different power fluctuations and different virtual inertia constants are shown in Figures 13, 14, respectively, while the corresponding simulations are shown in Supplementary Appendix Figure SA2.
It can be seen that the variations in Trec with respect to Hv are similar for different power increments, i.e., the steady-state recovery time of the frequency increases with the increase in Hv. In addition, although Zamp has no fixed trend with respect to Hv, it does not change on a large scale, so the value of Hv will not significantly affect the upper and lower limits of the ESS output power.
In conclusion, both the enhancement of Hv and Dv can reduce the ROCOF after the power fluctuation, but the regulation characteristics are different. Among them, Dv can suppress the frequency oscillation and smoothen the ESS output, but when the configuration value is unreasonable, the steady-state recovery time of the system will be prolonged. Compared to the Dv, Hv can restrain the ROCOF faster, but it cannot eliminate the oscillation and even prolong the oscillation time of the frequency. In addition, an increase in Hv produces adverse effects on the recovery process. Therefore, for the control of the ESS grid-connected inverter, Hv and Dv need to be configured coordinately according to the requirements of the ROCOF, to reduce the change of the frequency, suppress the oscillation, and promote the steady-state recovery at the same time.
Figure 15 shows the relationship of the initial ROCOF with respect to the ΔPL1 measured at region 1 under different values of Hv. It can be seen that the input of the ESS can effectively reduce the ROCOF, and the initial ROCOF is approximately linear with ΔPL1. So, the equivalent inertia constant Hess contributed by the ESS is invariant, i.e., according to the requirements of the ROCOF, the quantitative configuration of the Hv can be realized in a controlled way.
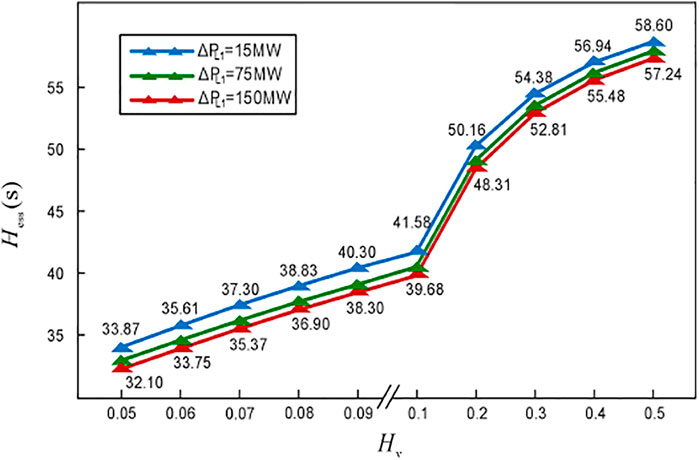
On this basis, the relationship of Hess with respect to Hv for different power increments is depicted in Figure 16, where Hess is obtained by the Eqs 1, 2 and the simulation results of the initial ROCOF.
It can be seen that although Hess is approximately proportional to the value of Hv in a certain range, Hess is not always proportional to the Hv even under the premise of the sufficient ESS capacity so that the inertia support work of the system cannot be fully allocated according to the inertia constant. It can be understood as the influence of the first stage of the three-stage principle, that is, the influence of the electrical distance on the IR in the transient process.
In addition, the value of Hess changes slightly with respect to ΔPL1, as shown in Figure 16. This is because the relative inertia defined in the study is equivalent to regulating the effect of damping, and the effect of the damping depends on the size of the frequency deviation and the power increment before the PFR. As a result, there is a certain coupling relationship between the Hess and the ΔPL1, that is, the equivalent inertia constant decreases with the increase in the ΔPL1.
4.4 Configuration of the Frequency Regulation Coefficient
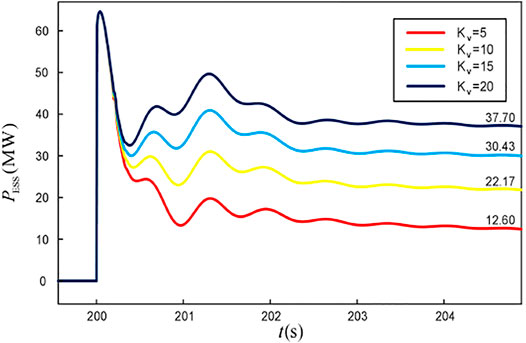
The simulation results from case 1 to case 3 show that the position of the power fluctuation and the values of Hv and Dv will not have a significant impact on the steady-state output of the ESS and the PFR results of the system. Therefore, the virtual frequency regulation coefficient Kv of the ESS can be configured separately according to the SSFD requirements, and it does not have to be limited by the factors such as geographical locations. To further discuss the influence of Kv on the frequency regulation characteristics of the ESS, bus 1 is taken as the frequency measurement point in case 4, and the active power increment of 145 MW is set for L1 at 200s. The frequency response and the ESS output waveforms for different virtual frequency regulation coefficients are shown in Figures 17, 18.
The value of Kv will not affect the initial ROCOF and the active power of the ESS in a short time scale, i.e., the configuration results of the Hv and the Dv need not be further adjusted according to the Kv. In addition, under the premise of sufficient ESS capacity, the simulation results in Figures 17, 18 show that the equivalent frequency regulation coefficient Kess provided by the ESS during the PFR is proportional to the magnitude of Kv, and it can also be proved in the study by Liu et al. (2021).
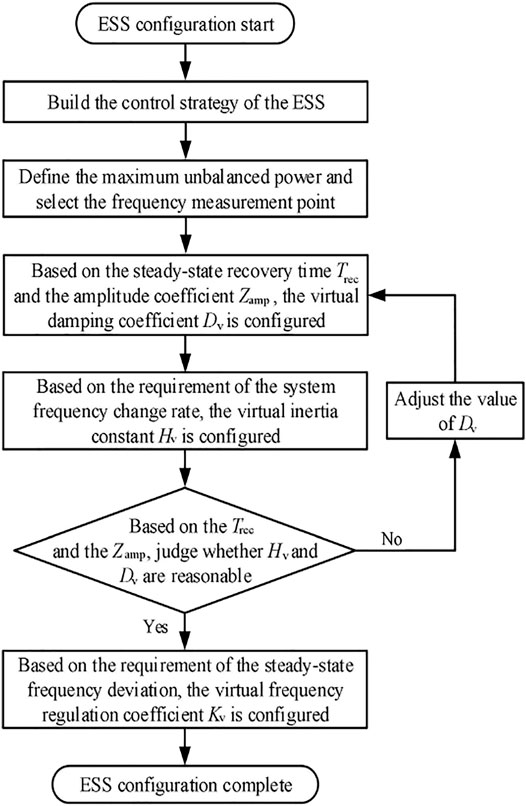
Finally, the flow chart of the ESS configuration method considering the frequency response and dynamic frequency dispersion is shown in Figure 19.
5 Conclusion and Prospect
To supplement the missing inertia and the PFR capacity of the high RES penetration system, the study takes the initial ROCOF and the SSFD after the unbalanced power generation as restrictions and proposes an ESS configuration method under the VSG control strategy on the basis of considering the dynamic dispersion; the conclusions are as follows:
1) The ESS with the VSG control strategy has similar frequency support and regulation characteristics as synchronous units, and the transient process will be greatly affected by the dynamic frequency dispersion.
2) The improvement in the virtual inertia constant and the virtual damping coefficient in the ESS can effectively reduce the change rate of the frequency, but the regulation characteristics are different; so, they need to be coordinated according to the ROCOF requirements of the system.
3) When the inertia of the system is sufficient or the ROCOF requirement is low, the ESS can choose the region far away from the power fluctuation to reduce its assembly capacity; when the inertial demand of the system is high, the ESS configuration in the region with the most severe power fluctuation can better take into account the frequency response requirements of the whole system, but the demand of the ESS capacity also increases.
To sum up, the configuration method of the ESS and the regulation characteristics of its related parameters are compared and analyzed deeply by defining the relative inertia, the steady-state recovery time, and the amplitude coefficient. However, the characteristics of RES units and ESS are not considered in this study. Therefore, the next work will be carried out on the basis of considering the type of ESS and the control of RES units.
Data Availability Statement
The original contributions presented in the study are included in the article/Supplementary Material, further inquiries can be directed to the corresponding author.
Author Contributions
HL proposed the methodology. YL and CZ designed the model and the computational framework and analyzed the data. YL and CZ wrote the original draft which was reviewed and edited by LS and XW. All authors agree to be accountable for the content of the work.
Funding
This research was financially supported by the National Key Research and Development Program of China (2017YFB0902000).
Conflict of Interest
The authors declare that the research was conducted in the absence of any commercial or financial relationships that could be construed as a potential conflict of interest.
Publisher’s Note
All claims expressed in this article are solely those of the authors and do not necessarily represent those of their affiliated organizations, or those of the publisher, the editors, and the reviewers. Any product that may be evaluated in this article, or claim that may be made by its manufacturer, is not guaranteed or endorsed by the publisher.
Supplementary Material
The Supplementary Material for this article can be found online at: https://www.frontiersin.org/articles/10.3389/fenrg.2021.807763/full#supplementary-material
References
Douglass, P. J., Garcia-Valle, R., Nyeng, P., Ostergaard, J., and Togeby, M. (2013). Smart Demand for Frequency Regulation: Experimental Results. IEEE Trans. Smart Grid. 4 (3), 1713–1720. doi:10.1109/tsg.2013.2259510
Gholamrezaie, V., Dozein, M. G., Monsef, H., and Wu, B. (2018). An Optimal Frequency Control Method through a Dynamic Load Frequency Control (LFC) Model Incorporating Wind Farm. IEEE Syst. J. 12 (1), 392–401. doi:10.1109/jsyst.2016.2563979
Homan, S., Dowell, N. M., and Brown, S. (2021). Grid Frequency Volatility in Future Low Inertia Scenarios: Challenges and Mitigation Options. Appl. Energ. 290, 116723. doi:10.1016/j.apenergy.2021.116723
Knap, V., Chaudhary, S. K., Stroe, D.-I., Swierczynski, M., Craciun, B.-I., and Teodorescu, R. (2016). Sizing of an Energy Storage System for Grid Inertial Response and Primary Frequency reserve. IEEE Trans. Power Syst. 31 (5), 3447–3456. doi:10.1109/tpwrs.2015.2503565
Li, X., Lu, L., Cheng, L., Wang, J., Lu, Z., and Li, W. (2019). Virtual Synchronous Power Decoupling Control Strategy Based on Adaptive Virtual Impedance Improved Reactive Power Loop. Power grid Technol. 43 (10), 3752–3760. (in China). doi:10.13335/j.1000-3673.pst.2019.0012
Li, Y., Gao, D. W., Gao, W., Zhang, H., and Zhou, J. (2020). Double-Mode Energy Management for Multi-Energy System via Distributed Dynamic Event-Triggered Newton-Raphson Algorithm. IEEE Trans. Smart Grid. 11 (6), 1. doi:10.1109/tsg.2020.3005179
Li, Y., Wang, J., Wang, R., Gao, D. W., Sun, Q., and Zhang, H. (2021). A Switched Newton-Raphson-Based Distributed Energy Management Algorithm for Multienergy System Under Persistent DoS Attacks. IEEE Trans. Automat. Sci. Eng., 1–13. doi:10.1109/TASE.2021.3104393
Liu, C., Sun, T., and Cai, G. (2018). Active Support Control and Primary Frequency Modulation Contribution Analysis of Battery Energy Storage Power Station Based on Synchronous Machine Third Order Model. Chin. J. Electr. Eng. 40 (15), 4854–4866. (in China). doi:10.13334/j.0258-8013.pcsee.191277
Liu, H., Zhang, C., Peng, X., and Zhang, S. (2021). Configuration of an Energy Storage System for Primary Frequency Reserve and Inertia Response of the Power Grid. IEEE Access. 9, 41965–41975. doi:10.1109/access.2021.3065728
Liu, L.-N., and Yang, G.-H. (2021). Distributed Optimal Economic Environmental Dispatch for Microgrids Over Time-Varying Directed Communication Graph. IEEE Trans. Netw. Sci. Eng. 8 (2), 1913–1924. doi:10.1109/TNSE.2021.3076526
Miguel, A., Torres, L., Luiz, A. C., Lopes, L. A., Moran, T., Jose, R., et al. (2014). Self-Tuning Virtual Synchronous Machine: a Control Strategy for Energy Storage Systems to Support Dynamic Frequency Control. IEEE Trans. Energ. Convers. 29 (4), 833–840. doi:10.1109/tec.2014.2362577
Nasirov, S., and Agostini, C. A. (2021). The Role of Frequency Regulation Remuneration Schemes in an Energy Matrix with High Penetration of Renewable Energy. Renew. Energ. 171 (2), 1097–1114. doi:10.1016/J.RENENE.2021.02.167
Peng, X., Yao, W., Yan, C., Wen, J., and Cheng, S. (2019). Two-stage Variable Proportion Coefficient Based Frequency Support of Grid-Connected DFIG-WTs. IEEE Trans. Power Syst. 35 (2), 962–974.
Pinthurat, W., and Hredzak, B. (2021). Fully Decentralized Control Strategy for Heterogeneous Energy Storage Systems Distributed in Islanded DC Datacentre Microgrid. Energy 231 (11), 120914. doi:10.1016/j.energy.2021.120914
Qi, H., Yue, H., Zhang, J., and Lo, K. L. (2021). Optimisation of a Smart Energy Hub with Integration of Combined Heat and Power, Demand Side Response and Energy Storage. Energy 234, 121268. doi:10.1016/j.energy.2021.121268
Rodrigues, Y. R., Monteiro, M., Abdelaziz, M., Wang, L., and Ribeiro, P. F. (2020). Improving the Autonomy of Islanded Microgrids Through Frequency Regulation. Int. J. Electr. Power Energ. Syst. 115, 105499. doi:10.1016/j.ijepes.2019.105499
Sm, A., Acba, B., Sk, C., Wnb, A., and Db, A. (2021). Strategic Design Optimisation of Multi-Energy-Storage-Technology Micro-Grids Considering a Two-Stage Game-Theoretic Market for Demand Response Aggregation. Appl. Energ. 287, 116563. doi:10.1016/J.apenergy.2021.116563
Sockeel, N., Gafford, J., Papari, B., and Mazzola, M. (2020). Virtual Inertia Emulator-Based Model Predictive Control for Grid Frequency Regulation Considering High Penetration of Inverter-Based Energy Storage System. IEEE Trans. Sustain. Energ. 11 (4), 2932–2939. doi:10.1109/tste.2020.2982348
Tang, X., Yin, M., Shen, C., Xu, Y., Dong, Z. Y., and Zou, Y. (2019). Active Power Control of Wind Turbine Generators via Coordinated Rotor Speed and Pitch Angle Regulation. IEEE Trans. Sustain. Energ. 10 (2), 822–832. doi:10.1109/tste.2018.2848923
Ten, C. F., and Crossley, P. A. (2008). “Evaluation of Rocof Relay Performances on Networks with Distributed Generation,” in let International Conference on Developments in Power System Protection (Glasgow: DPSP), 523–528. doi:10.1049/cp:20080092
Vidyanandan, K. V., and Senroy, N. (2013). Primary Frequency Regulation by Deloaded Wind Turbines Using Variable Droop. IEEE Trans. Power Syst. 28 (2), 837–846. doi:10.1109/tpwrs.2012.2208233
Wei, X., Wang, H., Lu, L., Han, X., and Ouyang, M. (2021). An Adaptive Virtual Inertia Control Strategy for Distributed Battery Energy Storage System in Microgrids. Energy. 233, 121155. doi:10.1016/j.energy.2021.121155
Yi, C. A., Aa, B., Sa, C., Lei, D. D., and Vt, A. (2020). Smart Frequency Control in Low Inertia Energy Systems Based on Frequen Response Techniques: A Review. Appl. Energ. 279, 115798. doi:10.1016/j.apenergy.2020.115798
Yue, M., and Wang, X. (2015). Grid Inertial Response-Based Probabilistic Determination of Energy Storage System Capacity under High Solar Penetration. IEEE Trans. Sustain. Energ. 6 (3), 1039–1049. doi:10.1109/tste.2014.2328298
Zhang, F., Hu, Z., Xie, X., Zhang, J., and Song, Y. (2017). Assessment of the Effectiveness of Energy Storage Resources in the Frequency Regulation of a Single-Area Power System. IEEE Trans. Power Syst. 32 (5), 3373–3380. doi:10.1109/tpwrs.2017.2649579
Zhang, M., and Sun, L. (2020). PLL and Additional Frequency Control Constituting an Adaptive Synchronization Mechanism for VSCs. IEEE Trans. Power Syst. 35 (6), 4920–4923. doi:10.1109/tpwrs.2020.3020725
Zhang, Q., Li, Y., Ding, Z., Xie, W., and Li, C. (2020). Self-Adaptive Secondary Frequency Regulation Strategy of Micro-Grid with Multiple Virtual Synchronous Generators. IEEE Trans. Ind. Applicat. 56 (5), 6007–6018. doi:10.1109/tia.2020.2975144
Keywords: high wind power penetration, frequency response, dynamic frequency dispersion, energy storage system, steady-state recovery time, amplitude coefficient
Citation: Liu H, Liu Y, Zhang C, Sun L and Wu X (2022) Configuration of an Energy Storage System Considering the Frequency Response and the Dynamic Frequency Dispersion. Front. Energy Res. 9:807763. doi: 10.3389/fenrg.2021.807763
Received: 02 November 2021; Accepted: 10 December 2021;
Published: 14 January 2022.
Edited by:
Wei Wang, North China Electric Power University, ChinaCopyright © 2022 Liu, Liu, Zhang, Sun and Wu. This is an open-access article distributed under the terms of the Creative Commons Attribution License (CC BY). The use, distribution or reproduction in other forums is permitted, provided the original author(s) and the copyright owner(s) are credited and that the original publication in this journal is cited, in accordance with accepted academic practice. No use, distribution or reproduction is permitted which does not comply with these terms.
*Correspondence: Li Sun, eGlhb3poYW5nc3kxMjFAMTYzLmNvbQ==
 Hongbo Liu
 Li Sun