 Jiaxin Zhang
 Bo Wang
 Hongxia Wang1
- 1School of Electrical Engineering and Automation, Wuhan University, Wuhan, China
- 2Tus-Institute for Renewable Energy, Qinghai University, Qinghai, China
In view of the current situation that the new generation of smart grids with “double high” characteristics is in urgent need of effective state evaluation methods due to the characteristics of strong volatility and diverse demands, a method of operation state evaluation of smart distribution networks based on free probability theory is proposed, which is combined with high-order moment indexes to describe the operation trajectory of distribution networks from a data-driven perspective. First, the state assessment problem of smart distribution networks is modeled as a binary hypothesis testing problem, and the asymptotic free equation is established based on free probability theory to provide a framework for state assessment of distribution networks. Then, a high-order moment evaluation index is proposed, combined with the sliding time window processing, and the high-order moment sequence was obtained based on the high-dimensional data of the distribution network, which is used to describe the state evolution of the distribution network. Finally, this method is applied to a certain 110-kV distribution network. The analysis of an example shows that the proposed evaluation framework and indicators can effectively reflect the data changes in the distribution network and support the state assessment and evolution analysis of the distribution network.
Introduction
As China proposes “to achieve carbon peak before 2030 and achieve carbon neutrality before 2060,” improving overall energy utilization efficiency and focusing on developing renewable energy has become an inevitable choice. The power system is closely related to the production, transportation, and consumption of renewable energy, which also plays a key role in promoting energy transformation (Zhou et al., 2018). Moreover, the new generation smart grid has the characteristics of “double high”: the high proportion of renewable energy and the high proportion of power electronic equipment. Distributed power supply, charging pile/station, and controllable load, along with other devices, are developing rapidly, and their large-scale access to the distribution network has brought strong uncertainties to the distribution network due to their characteristics of strong intermittent and diverse demands, making the operation mode of the distribution network increasingly complex and changeable.
As a pivotal link of energy, an intelligent distribution network is the key to the smooth operation of “the production-supply-marketing” of electric energy. The ultimate goal of the intelligent distribution network is to build and form a panoramic real-time system covering the distribution network. The basis of supporting the panoramic real-time system of the distribution network is the collection, transmission, and storage of panoramic real-time data of the distribution network and the effective technology for rapid analysis of massive multi-source data (Liu, 2010; Yang et al., 2019; Shen and Raksincharoensak, 2021a; Yang et al., 2021a; Shen and Raksincharoensak, 2021b; Yang et al., 2021b; Zhang et al., 2021). The application of cloud computing, big data, Internet of Things, 5G information communication technology, and artificial intelligence in the power system provides a data basis for the realization of real-time state estimation and situation awareness of the smart distribution network (Yang et al., 2018; Shen et al., 2020a; Ma et al., 2020; Wang et al., 2020). However, the existing distribution network state estimation and situation awareness methods find it difficult to meet the requirements in many aspects of calculation accuracy, calculation speed, and visualization. Thus, it has become a hot topic for experts, scholars, and engineers at home and abroad to construct an effective state estimation and situation awareness system for the intelligent distribution network to support comprehensive, accurate, and real-time control of the operation situation of the distribution network.
In the field of power system state assessment, apart from the specific model method, classical research methods also include the analytic hierarchy process (AHP), the fuzzy comprehensive evaluation method, and principal component analysis (PCA). The literature (Cao et al., 2007) has proposed a comprehensive evaluation method for a new rural low-voltage distribution network based on the AHP and realized practical application. However, this method mainly solved the problems of distribution network construction planning and transformation in the near future and could not evaluate the real-time status. The literature (Sun et al., 2017) combined PCA and system clustering analysis to establish a comprehensive evaluation system of county power grids, which could evaluate the power grid from five aspects of security, economy, reliability, adaptability, and quality, but also could not evaluate the real-time state.
In recent years, data-driven state assessment has also been applied in the power field. The literature (Xu et al., 2016) proposed a correlation analysis method based on random matrix theory (RMT). Combining real-time separation window technology with RMT, the mean spectrum radius (MSR) index was used to evaluate the correlation of distribution network data. In the literature (Xu et al., 2018), the evaluation indexes of the hit ratio and the false alarm rate were proposed, and the vulnerability of the distribution network was evaluated based on RMT. The literature (He et al., 2017a) used the basic breakthrough of high-dimensional statistics in recent years to put forward the research framework of space-time big data of the distribution network based on the random matrix. For power system fault identification, the literature (Xu et al., 2019) proposed a feature self-learning method based on deep learning for high-dimensional space-time fault samples, which had fast calculation speed and strong robustness. However, the method itself had high requirements on source data but low comprehensibility. The literature (Wei et al., 2016) proposed a high-dimensional power data fusion method based on correlation mining in order to solve the key problem of online stability analysis of large power grids. This method mainly solved the problem of data fusion and did not directly evaluate the status of the large power grid.
The key of power system state evaluation based on high-dimensional big data should be the construction of an evaluation framework and an evaluation index system and identification of a power grid or equipment evolution situation. In this study, the free probability theory (FPT) is introduced into the electric power field for the first time in China, providing a complete and clear evaluation framework for the operation status of the smart distribution network, combining with sliding time window processing to solve the high-dimensional source data to obtain the time series of the index. In this study, the high-order moment index is also proposed to analyze the distribution network from the perspective of the state assessment and evolution trend and is applied to the state assessment of the 110-kV distribution network to verify the effectiveness of the proposed method.
Free Probability Theory and Big Data Processing Methods
Introduction to Free Probability Theory
A random matrix is a matrix whose elements are random variables. Through the high-dimensional statistical analysis, important information can be extracted from massive disordered data in a random matrix.
Free probability theory can provide an effective analysis framework for the asymptotic spectrum distribution of high-dimensional random matrices. In the 1980s, Voiculescu proposed FPT to deal with abstract “non-commutative space,” and the random matrix is a special case of “non-commutative space” (Dan, 1986; Voiculescu, 1987). The purpose of FPT is to introduce a concept similar to “independence” in classical probability theory, namely, “freedom,” and make it applicable to non-commutative random variables such as random matrices and extend it to the case of large dimensions, namely, “asymptotic freedom.”
Different from traditional mathematical theory, FPT defines some new operators, including additive-free convolution ⊞ and its inverse operation additive-free deconvolution
FPT has become a powerful tool to describe the characteristics of wireless communication systems. Spectrum sensing algorithms based on FPT have fast convergence, which are also suitable for the limited number of samples, and have high sensing performance in the case of low signal-to-noise ratio (Tulino and Verdu, 2004). Domestic and foreign scholars have made great academic achievements in this field. This study is the first attempt to apply the FPT to the electric power field, which selects the operation of the smart distribution network as the application scenario and evaluates the operation status of the distribution network based on FPT, providing real-time and efficient support for intelligent operation and maintenance.
Free Probability Theory
Definition 1 (Dan, 1986) The empirical spectrum distribution of an
where
where
Definition 2 (Couillet and Debbah, 2011) Let B be a non-commutative algebraic system with unit element I; if
where
Definition 3 (Couillet and Debbah, 2011) Let
1)
2) i1≠i2,i2≠i3, … ,in-1≠in
3) for all
Then, a family of the subalgebra systems of B
Definition 4 (Couillet and Debbah, 2011) If the following two conditions are met
1) for all k∈{1,…,K}, XN,K has an asymptotic spectral distribution;
2) for all {i1,…in}
and
Then the
where
where
Distribution Network State Estimation Method Based on FPT
Data Pre-Processing
Supervisory Control and Data Acquisition (SCADA) is widely applied in the power system and collects the branch power, branch current amplitude, and node voltage amplitude in the system with high maturity, mainly through the remote terminal unit (RTU) and the feeder terminal unit (FTU) (Yang et al., 2020a; Shen et al., 2020b; Zhu et al., 2020; Li et al., 2021a; Shen et al., 2021a; Shen et al., 2021b; Qi et al., 2021; Xiang et al., 2021). The data collected by SCADA has the characteristics of mass and high dimension, so a high-dimension random matrix can be constructed according to the collected data. Combined with the sliding time window processing, the data characteristics of the distribution network can be analyzed based on FPT, and the distribution network state before and after can be compared in time to further realize the evolution of the distribution network operation state.
Assume that i nodes in the distribution network are equipped with measuring devices, and the sampling interval is 0.01 s. At the sampling time tn, i nodes each generate a state data (which can be voltage, current, and power angle), and the state data of all nodes at this time constitute a column vector x (tn), as shown in the following formula:
When there are a total of j sampling moments, the j column vectors are arranged to form a high-dimensional random matrix Xi×j, as shown below:
In the above formula, each row of Xi×j is the state data of the same node at different times, and each column is the state data of different nodes at the same time.
The normalization process is carried out according to Eq. 10 below, and the normalized matrix
where Xl is the lth row of X.
In statistical analysis of high-dimensional data, when the amount of data is large enough, the data as a whole will show certain random statistical characteristics after corresponding processing, such as the single ring theorem and the M–P law (Ling et al., 2018; Jain et al., 2019; Deepa et al., 2020; Xiong et al., 2020; Yang et al., 2020b; Li et al., 2021b; Li et al., 2021c; Yang et al., 2021c; Li et al., 2021d; Ye et al., 2021; Dong and Li, 2021; Liu et al., 2021; Mousavizadeh et al., 2021; Ouyang and Xu, 2021; Zhu et al., 2021). In the statistical analysis of high-dimensional power data, the corresponding linear eigenvalue statistics (LES) are constructed, such as MSR, high-order moment, etc., which can effectively represent the state of the distribution network. When there are only random fluctuations and measurement errors in the measured data, the data present a random statistical characteristic as a whole. If abnormal events occur in the power system, the original stable operation state of the system will be broken, and the measured data will change accordingly.
State Assessment Model Construction
The problem of distribution network operation state assessment is understood as a binary hypothesis testing problem, as follows:
where
The above binary hypothesis testing problem is further explained.
In this study, the basic idea of the distribution network state estimation method based on FPT is to estimate the asymptotic spectrum distribution of the event signal component
Assuming that N received sampled signals y (1), y (2), …, y(N) are used for distribution network state estimation and each sampled signal is composed of M signal components, the sample covariance matrix of received sampled signals is as follows:
The sample covariance matrix of signal component
In FPT, for the signal–noise model, the asymptotic spectral distributions of the above two sample covariance matrices
where
After rigorous mathematical derivation, the spectral distribution between the sample covariance matrix and the statistical covariance matrix of the event signal components can be obtained to satisfy the following relation:
Substituted into Eq. 10, the asymptotic free equation becomes the following:
The asymptotic spectrum distribution of event signal component
Based on the established asymptotic free equation and the sliding time window method, the high-order moment index of the continuous time window matrix is obtained to observe the state of the distribution network.
The state assessment process of the distribution network is shown in Figure 1 below.
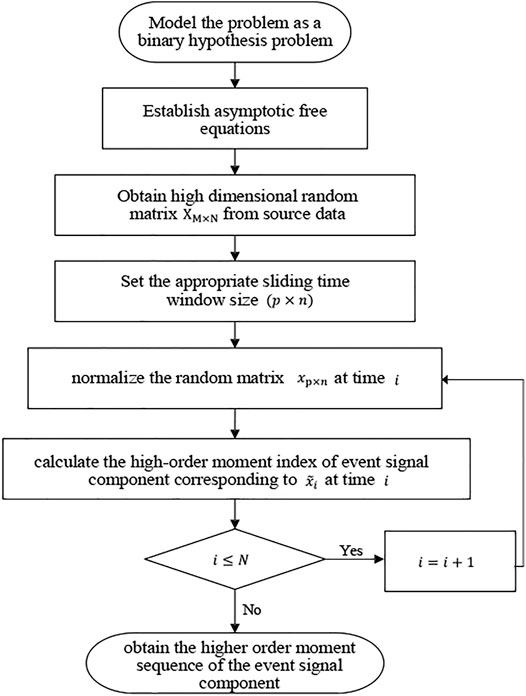
FIGURE 1. Distribution network status evaluation process based on FPT.
Calculation of High-Order Moment Index
From the above analysis, it can be seen that the calculation process of solving the high-order moment index is based on the asymptotic free equation, which involves new operators defined by FPT, namely, additive-free convolution and its inverse operation and multiplicative-free convolution and its inverse operation. It is a relatively simple calculation method to calculate additive-free convolution through the moment-cumulant formula (Ryan and Debbah, 2007).
1) Additive-free convolution
The moment-cumulant formula describes the relationship between the moments of a certain measure and the related R transformation. The R transformation of a probability distribution μ is defined as follows:
where
which is equivalent to that the cumulative measure has additivity under additive-free convolution. That is,
The moment-cumulant of the distribution μ is given as follows:
where
The bidirectional conversion between the cumulant sequence and the moment sequence can be completed by using the above formula, that is, the first n-order cumulants can be obtained from the first n-order moments and vice versa.
This article gives a brief description of the use of the moment-cumulant formula in free convolution calculation, and the specific process is described as follows:
1) Taking the sequence of moments as input, vector f=(1,m1,…,mn) with length n+1 is formed, where m1 is the first-order moment, and mn is the nth-order moment. Then n vectors are obtained by convolution calculation according to the following formula:
where * stands for the convolution operation, and *n stands for n-fold classical convolution with itself. With the accumulation of the convolution operation, the length of vector F increases gradually. Since only the first n+1 elements of M1,…,Mn are used in subsequent operations, the length of vector F is uniformly trimmed to n+1 after the convolution operation in order to simplify calculation and reduce the storage space of the operation.
2) Calculate each cumulant iteratively. After the cumulants α1, …, αn-1 are obtained by solving the moment-cumulant formula shown in Eq. 21 for n-1 times, αn can be obtained by solving the equation for the nth time. It should be added that the relation between each F vector in Step 1) and Eq. 21 can be expressed by the following:
This equation can also be understood as writing the coefficients in the moment-cumulant formula as k-fold convolution. Based on this formula, it can be known that the kth cumulant is equivalent to the following expression:
Thus, the additive-free convolution and additive-free deconvolution can be easily calculated by means of the moment-cumulant formula.
2) Multiplicative-free convolution
Computation involving multiplicative-free convolution and its inverse operation requires the transformation of boxed convolution, denoted as ⧆. Boxed convolution can be understood as a convolution operation acting on a power series polynomial, which involves the concept of non-cross partition not being repeated. Among the various forms of power series, the commonly used power series is Zeta-series, defined as
It can be proven that the boxed convolution acting on the power series polynomial is the combination of multiplicative-free convolution on each measure, where the boxed convolution of power series
also written as follows:
It can be found that, in fact, the above equation is the moment-cumulant formula, which is equivalent to Eq. 21. Thus, in the calculation process, the cumulant is replaced by the coefficient of
Case Studies
Data Sources
Based on Matlab, this study uses the voltage data of 40 buses under the maximum operation mode of the 110-kV distribution network in a certain province in the summer of 2020 to conduct simulation verification. The total duration of voltage data is 5s, the number of each sampled signal components is
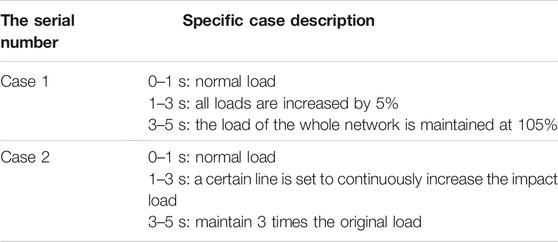
TABLE 1. Case scenario description.
Analysis of Cases
In this study, the high-dimensional random matrix of source data is
In addition, in the power system, the voltage of each user must be kept at the rated value or within the allowable range of voltage offset. Currently, the percentage of voltage offset at the power supply end of 35 kV and above is defined as ±5% in China.
1) Case 1
By observing the voltage fluctuation of the 40 buses in Figure 2 below, it can be seen intuitively that the voltage unit values of the 40 buses are initially distributed between (0.955,0.995), which are in a normal level, and obvious drops occur at about the 100th sampling time point, that is, the bus voltage drops at about 1s. Subsequently, the buses’ voltage stops falling around the 300th sampling time point, that is, the bus voltage gradually stabilized after 3s and successfully reached a new stable state.
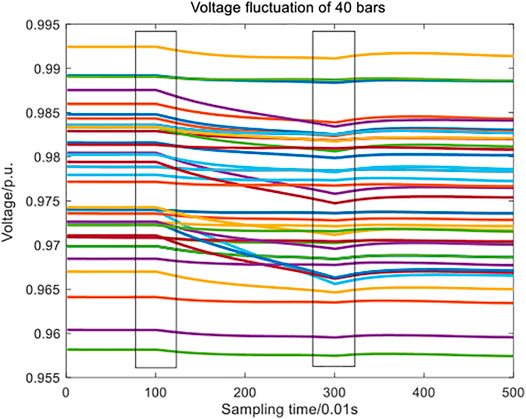
FIGURE 2. Original voltage data of 40 buses in case 1.
In Figure 3, the red dotted lines are control limits
2) Case 2
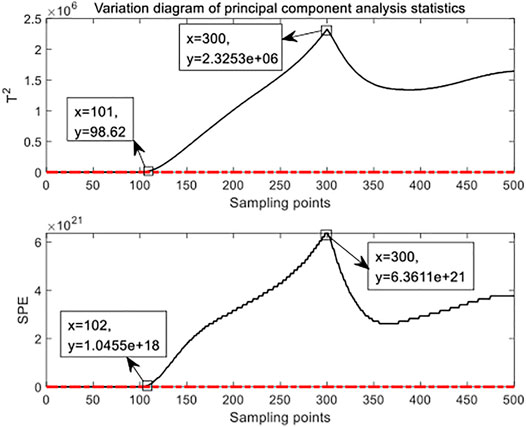
FIGURE 3.
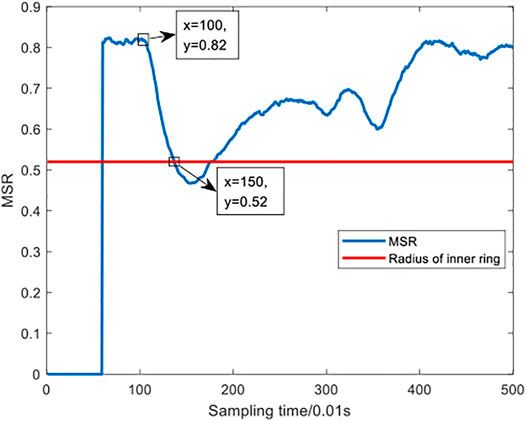
FIGURE 4. MSR index of case 1.
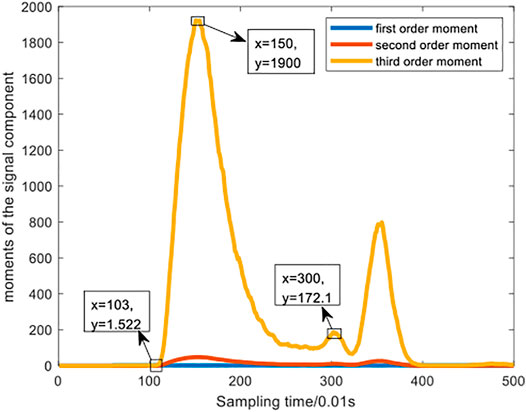
FIGURE 5. Moments of the signal component in case 1.
By observing the voltage fluctuation of the 40 buses in Figure 6, it can be seen intuitively that the voltage unit values of the 40 buses are initially distributed between (0.95,1), which are in a normal level. After the 100th sampling point, as the impact load continues to increase, the voltage level drops sharply, and the minimum voltage unit value is as low as 0.82, which is at the abnormal operation level. After the 300th sampling point, the load level remains 3 times that of the original load, and the power grid tries to re-establish a stable state. It can be speculated that due to the limited capacity of the system, the new equilibrium state is not reached, and the voltage level is in continuous oscillation during 3–5 s.
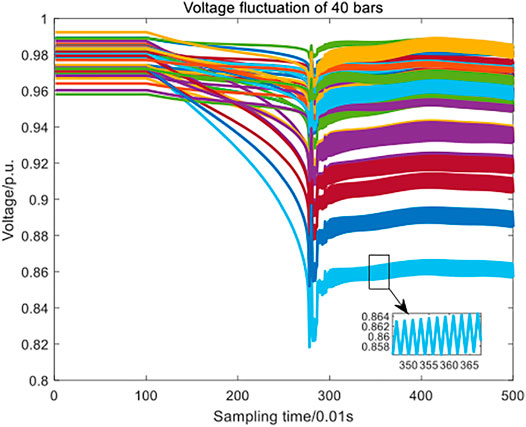
FIGURE 6. Original voltage data of 40 buses in case 2.
By observing various indicators in the figures of case 2 (i.e. Figures 7, 8, 9), the
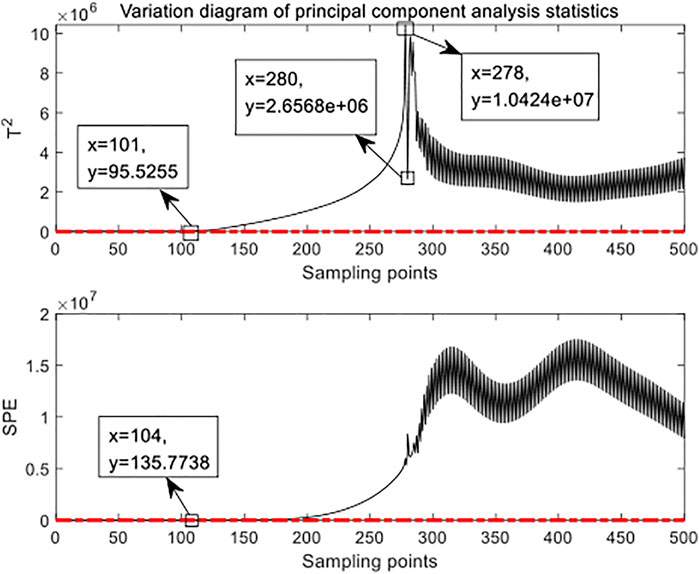
FIGURE 7.
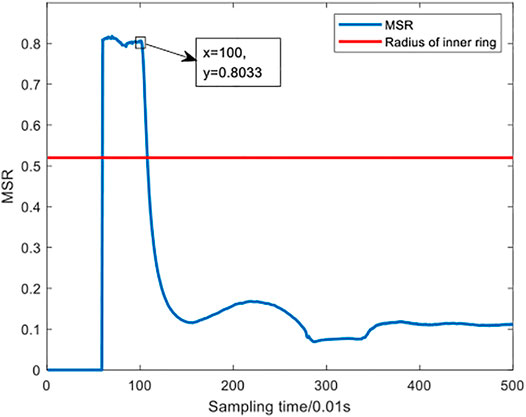
FIGURE 8. MSR index of case 2.
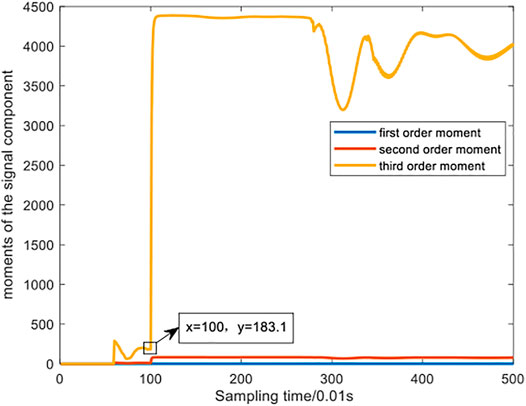
FIGURE 9. Moments of the signal component in case 2.
Through the analysis of the above two cases, it can be found that the performance of the third-order moment index is better than that of the
Conclusion
This study proposes a state evaluation method based on FPT, aiming to evaluate the operation of the distribution network according to high-order moment indexes. Through simulation cases, the following conclusions are obtained:
1) Based on the high-dimensional measurement data of the distribution network, the relevant asymptotic free equation is established, and the high-order moment index is proposed to evaluate the distribution network state, which verifies the feasibility of the proposed evaluation framework based on FPT, applied to the distribution network state analysis.
2) The free probability theory itself tends to be abstract. When calculating the high-order moment index, the moment-cumulant formula can effectively simplify the calculation process of the high-order moment. In addition, the evaluation index is the high-order moment. Theoretically, the index system can be extended to N-order moments, and the selection of specific indicators should be determined based on the actual application scenarios.
3) The proposed high-order moment index is compared with the classical
In this study, the free probability theory is applied to the electric power field for the first time, and the proposed evaluation framework can be extended to high-dimensional electric power data processing, such as power dispatching, operation and maintenance control, new energy consumption, reliability evaluation, and other scenarios to provide decision support. Based on the above analysis, the follow-up work of this study will focus on three aspects: the application of multiple power scenarios, internal performance comparison of high-order moment indicators, and further expansion as well as optimization of the evaluation index system (Xue and Lai, 2016, He et al., 2016, Liu et al., 2016, Wang et al., 2019, Chen et al., 2017, He et al., 2017b, Zhang et al., 2018, Xue, 2015).
Data Availability Statement
The raw data supporting the conclusion of this article will be made available by the authors, without undue reservation.
Author Contributions
JZ selected and studied the sources, designed the structure of the manuscript, and wrote the first draft of the manuscript. BW and HW contributed with supervision over the study of the literature and the writing of the manuscript. All authors contributed to manuscript revision and read and approved the submitted version.
Funding
This research is supported by a project from the National Natural Science Foundation of China (51907096).
Conflict of Interest
The authors declare that the research was conducted in the absence of any commercial or financial relationships that could be construed as a potential conflict of interest.
Publisher’s Note
All claims expressed in this article are solely those of the authors and do not necessarily represent those of their affiliated organizations, or those of the publisher, the editors, and the reviewers. Any product that may be evaluated in this article, or claim that may be made by its manufacturer, is not guaranteed or endorsed by the publisher.
References
Cao, Y., Meng, H., Zhao, L., Wang, T., and Chen, S. (2007). Comprehensive Evaluation Method of New Rural Low-Voltage Distribution Network Based on ANALYTIC Hierarchy Process. Power Grid Tech. (08), 68–72. doi:10.3389/fenrg.2021.800906
Chen, P., Tao, S., and Xiao, X. (2017). Network Model for Correlation Analysis of Short-Term Electricity Consumption Behavior. Automation Electric Power Syst. 41 (03), 61–69. doi:10.7500/AEPS20160127014
Couillet, R., and Debbah, M. (2011). Random Matrix Methods for Wireless Communications. London: Cambridge University Press.
Dan, V. (1986). Addition of Certain Non-commuting Random Variables. J. Funct. Anal. 66 (3), 323–346. doi:10.1016/0022-1236(86)90062-5
Deepa, S. K., Savier, J. S., and Biju, S. S. (2020). Micro-synchrophasor Based Special protection Scheme for Distribution System Automation in a Smart City. Prot. Control. Mod. Power Syst. 5 (1), 97–110. doi:10.1186/s41601-020-0153-1
Dong, W., and Li, S. (2021). Reliability Sensitivity of Wind Power System Considering Correlation of Forecast Errors Based on Multivariate NSTPNT Method. Prot. Control. Mod. Power Syst. 6 (1), 136–146. doi:10.1186/s41601-021-00192-0
He, X., Ai, Q., Qiu, C., Zang, J., and Xu, X. (2017). Application of Stochastic Matrix Theory in Power System Cognition. Power grid Technol. 41 (04), 1165–1173. doi:10.13335/j.1000-3673.pst.2016.1956
He, X., Qiu, C., Ai, Q., Chu, L., and Ling, Z. (2017). Research on Spatial and Temporal Big Data of Distribution Network Based on Random Matrix Theory. Power supply and consumption 34 (06), 14–19+7. doi:10.19421/j.cnki.1006-6357.2017.06.003
He, X., Qiu, R. C., Ai, Q., Chu, L., Xu, X., and Ling, Z. (2016). Designing for Situation Awareness of Future Power Grids: An Indicator System Based on Linear Eigenvalue Statistics of Large Random Matrices. IEEE Access 4, 3557–3568. doi:10.1109/access.2016.2581838
Jain, T., Ghosh, D., and Mohanta, D. K. (2019). Augmentation of Situational Awareness by Fault Passage Indicators in Distribution Network Incorporating Network Reconfiguration. Prot. Control. Mod. Power Syst. 4 (4), 323–336. doi:10.1186/s41601-019-0140-6
Li, H., Deng, J., Feng, P., Pu, C., Arachchige, D. D., and Cheng, Q. (2021). Short-term Nacelle Orientation Forecasting Using Bilinear Transformation and ICEEMDAN Framework. Front. Energ. Res. 9, 697. doi:10.3389/fenrg.2021.780928
Li, H., Deng, J., Yuan, S., Feng, P., and Arachchige, D. D. Monitoring and Identifying Wind Turbine Generator Bearing Faults Using Deep Belief Network and EWMA Control Charts. Front. Energ. Res. 9, 770. doi:10.3389/fenrg.2021.799039
Li, Z., Jiang, W., Abu-Siada, A., Li, Z., Xu, Y., and Liu, S. (2021). Research on a Composite Voltage and Current Measurement Device for HVDC Networks. IEEE Trans. Ind. Electron. 68 (9), 8930–8941. doi:10.1109/tie.2020.3013772
Li, Z., Wan, J., Wang, P., Weng, H., and Li, Z. (2021). A Novel Fault Section Locating Method Based on Distance Matching Degree in Distribution Network. Prot. Control. Mod. Power Syst. 6 (2), 253–263. doi:10.1186/s41601-021-00194-y
Ling, Z., Qiu, R., and He, X. (2018). A New Approach of Exploiting Self-Adjoint Matrix Polynomials of Large Random Matrices for Anomaly Detection and Fault Location. arXiv:1802.03503v1.
Liu, W., Zhang, D., and Wang, X. (2016). Power System Transient Stability Analysis Based on Random Matrix Theory. Proc. CSEE 36 (18), 4854–4864. doi:10.13334/j.0258-8013.pcsee.160779
Liu, Y., Chen, S., Cong, Z., Jiang, Q., Yan, Y., and Jiang, X. (2021). Key Technology and Application Prospect of Digital Twin in Power Equipment Industry. High Voltage Tech. 47 (05), 1539–1554. doi:10.13336/j.1003-6520.hve.20210194
Ma, F., Wang, B., and Dong, X. (2020). Power Vision Edge Intelligence: Power Depth Vision Acceleration Technology Driven by Edge Computing. Power Syst. Tech. 44 (06), 2020–2029. doi:10.13335/j.1000-3673.pst.2019.2382
Mousavizadeh, S., Alahyari, A., Ghodsinya, S. R. M., and Haghifam, M. (2021). Incorporating Microgrids Coupling with Utilization of Flexible Switching to Enhance Self-Healing Ability of Electric Distribution Systems. Prot. Control. Mod. Power Syst. 6 (3), 300–310. doi:10.1186/s41601-021-00197-9
Ouyang, S., and Xu, W. (2021). Power Grid Fault Identification and Cause Identification Method Considering External Environmental Information. High Voltage Tech. 47 (03), 1075–1082. doi:10.13336/j.1003-6520.hve.20200106
Qi, B., Zhang, P., Zhang, S., Zhao, L., Wang, H., Huang, M., et al. (2021). Application Status and Development Prospect of Digital Twin Technology in State Evaluation of Power Transmission and Transformation Equipment. High Voltage Tech. 47 (05), 1522–1538. doi:10.13336/j.1003-6520.hve.20210093
Rong, Z., Qi, B., Zhang, P., Li, C., Yang, Y., Gu, C., et al. (2019). Fast Identification of Abnormal State of Oil Chromatography Online Monitoring Device Based on Nuclear Principal Component Analysis. High voltage Technol. 45 (10), 3308–3316. doi:10.13336/j.1003-6520.hve.20190624006
Ryan, Ø., and Debbah, M. (2007). “Free Deconvolution for Signal Processing Applications[C],” in Proceeding of the Information Theory, 2007. ISIT 2007. IEEE International Symposium on, Nice, France, June 2007 (IEEE), 1846–1850.
Shen, X., Ouyang, T., Khajorntraidet, C., Li, Y., Li, S., and Zhuang, J. (2021). “Mixture Density Networks-Based Knock Simulator,” in Proceeding of the IEEE/ASME Trans. Mechatron., February 2021 (IEEE), 1. doi:10.1109/TMECH.2021.3059775
Shen, X., Ouyang, T., Yang, N., and Zhuang, J. (2021). “Sample-based Neural Approximation Approach for Probabilistic Constrained Programs,” in Proceeding of the IEEE Trans. Neural Netw. Learning Syst., August 2021 (IEEE), 1–8. doi:10.1109/TNNLS.2021.3102323
Shen, X., and Raksincharoensak, P. (2021). “Pedestrian-aware Statistical Risk Assessment,” in Proceeding of the IEEE Transactions on Intelligent Transportation Systems, June 2021 (IEEE), 1–9. doi:10.1109/TITS.2021.3074522
Shen, X., and Raksincharoensak, P. (2021). Statistical Models of Near-Accident Event and Pedestrian Behavior at Non-signalized Intersections. J. Appl. Stat., 1–21. doi:10.1080/02664763.2021.1962263
Shen, X., Zhang, X., Ouyang, T., Li, Y., and Raksincharoensak, P. (2020). Cooperative Comfortable-Driving at Signalized Intersections for Connected and Automated Vehicles. IEEE Robot. Autom. Lett. 5 (4), 6247–6254. doi:10.1109/LRA.2020.3014010
Shen, X., Zhang, Y., Sata, K., and Shen, T. (2020). Gaussian Mixture Model Clustering-Based Knock Threshold Learning in Automotive Engines. Ieee/asme Trans. Mechatron. 25 (6), 2981–2991. doi:10.1109/TMECH.2020.3000732
Sun, Y., Li, Q., Ding, Y., Quan, S., Guan, Z., Yang, D., et al. (2017). Power System protection and Control, 45, 30–36.
Tulino, A. M., and Verdu, S. (2004). Random Matrix Theory and Wireless Communications. Hanover, USA: Now Publishers Inc.
Voiculescu, D. (1987). Multiplication of Certain Non-commuting Random Variables. J. Oper. Theor. 18 (2), 223–235. doi:10.1016/0022-1236(86)90062-5
Wang, B., Ma, F., Ge, L., Ma, H., Wang, H., and Mohamed, M. A. (2020). Icing-EdgeNet: A Pruning Lightweight Edge Intelligent Method of Discriminative Driving Channel for Ice Thickness of Transmission Lines. IEEE Trans. Instrum. Meas. 70, 1–12. Art no. 2501412. doi:10.1109/TIM.2020.3018831
Wang, B., Wang, J., Liu, D., and Chen, S. (2019). Research on Evaluating Vulnerability of Power Network Based on High-Dimensional Random Matrix Theory. Proc. CSE 39 (06), 1682–1691+1864. doi:10.13334/j.0258-8013.pcsee.180284
Wei, D., Wang, B., Liu, D., Chen, D., Tang, F., and Guo, K. (2016). WAMS/SCADA Data Fusion Method Based on Time-Series Data Correlation Mining. High voltage Technol. 42 (01), 315–320.
Xiang, C., Zeng, X., Yan, P., Zhao, J., and Jia, B. (2021). Typical Application and Prospect of Digital Twin Technology in Power Grid Operation. High Voltage Tech. 47 (05), 1564–1575.
Xiong, S., Liu, Y., Fang, J., Cong, Z., Yan, Y., and Jiang, X. (2020). Detection Method of Incipient Faults of Power Distribution Lines. High voltage technolo-gy 46 (11), 3970–3976.
Xu, S., Qiu, C., Zhang, D., He, X., Chu, L., and Yang, H. (2019). Identification of Transmission Line Fault Type Based on Deep Learning. Proc. CSEE 39 (01), 65–74+321.
Xu, X., He, X., and Ai, Q. (2016). A Correlation Analysis Method Foroperation Status of Distribution Network Based on Random Matrixtheory. Power Syst. Tech. 40 (3), 5414–5420. doi:10.13335/j.1000-3673.pst.2016.03.018
Xu, Z., Han, Y., He, X., Zhuo, Y., and Shi, X. (2018). Design of Distribution Network Array Vulnerability Evaluation System Based on Random Matrix Theory. Electr. Appliances Energ. Efficiency Manag. Tech. 2018 (09), 54–59. doi:10.16628/j.cnki.2095-8188.2018.09.011
Xue, H. (2015). Research on Spectrum Sensing Technology Based on Free Probability Theory. Nanjing: Nanjing University of Posts and Telecommunications.
Xue, Y., and Lai, Y. (2016). The Integration of Big Energy Thinking and Big Data Thinking (I) Big Data and Power Big Data. Automation electric Power Syst. 40 (01), 1–8. doi:10.7500/AEPS20151208005
Yang, F., Wei, M., and Ling, Z. (2020). Brown Measure Based Spectral Distribution Analysis for Spatial-Temporal Localization of Cascading Events in Power Grids. IEEE Trans. Smart Grid 12 (99), 1805–1820. doi:10.1109/tsg.2020.3037542
Yang, N., Huang, Y., and Hou, D. (2019). Adaptive Nonparametric Kernel Density Estimation Approach for Joint Probability Density Function Modeling of Multiple Wind Farms. Energies 2019, 12. doi:10.3390/en12071356
Yang, N., Liu, S., Deng, Y., and Xing, C. (2020). An Improved Robust SCUC Approach Considering Multiple Uncertainty and Correlation. IEEJ Trans. Elec Electron. Eng. 16, 21–34. doi:10.1002/tee.23265
Yang, N., Qin, T., Wu, L., Huang, Y., Huang, Y., Xing, C., et al. (2021). A Multi-Agent Game Based Joint Planning Approach for Electricity-Gas Integrated Energy Systems Considering Wind Power Uncertainty. Electric Power Syst. Res. 2021, 107673. ISSN 0378-7796. doi:10.1016/j.epsr.2021.107673
Yang, N., Yang, C., Wu, L., Shen, X., Jia, J., Li, Z., et al. (2021). “Intelligent Data-Driven Decision-Making Method for Dynamic Multi-Sequence: An E-Seq2Seq Based SCUC Expert System,” in Proceeding of the IEEE Transactions on Industrial Informatics, August 2021 (IEEE), 1. doi:10.1109/TII.2021.3107406
Yang, N., Yang, C., Xing, C., Ye, D., Jia, J., Chen, D., et al. (2021). Deep Learning-Based SCUC Decision-Making: An Intelligent Data-Driven Approach with Self-Learning Capabilities. IET Gener. Transm. Distrib., 1–12. doi:10.1049/gtd2.12315
Yang, N., Ye, D., Zhou, Z., Cui, J., Chen, D., and Wang, X. (2018). Research on Modelling and Solution of Stochastic SCUC under AC Power Flow Constraints. IET Generation, Transm. Distribution 12 (15), 3618–3625. doi:10.1049/iet-gtd.2017.1845
Ye, J., Zhao, D., and Zhang, L. (2021). Research on Combined Electricity and Heating System Scheduling Method Considering Multi-Source Ring Heating Network. Front. Energ. Res. 9. doi:10.3389/fenrg.2021.800906
Zhang, L., Xie, Y., and Ye, J. (2021). Intelligent Frequency Control Strategy Based on Reinforcement Learning of Multi-Objective Collaborative Reward Function. Front. Energ. Res. 9. doi:10.3389/fenrg.2021.760525
Zhang, L., Zhang, Z., and Gu, J. (2018). State Analysis and Disturbance Positioning Method of Power Grid Based on Random Matrix Theory. Automation Electric Power Syst. 42 (12), 93–99+126. doi:10.7500/AEPS20171106006
Zheng, K., Geng, Z., Wang, H., Ma, F., and Zhang, G. (2020). Detection and Location Method of Single-phase Grounding Fault in Distribution Network Based on Synchronous Measurement Data. Power Grid Clean. Energy 36 (09), 50–56. doi:10.3969/j.issn.1674-3814.2020.09.008
Zhou, X., Chen, S., and Lu, Z. (2018). Technology Features of the New Generation Power System in China. Proc. CSEE 38 (07), 1893–1904+2205. doi:10.13334/j.0258-8013.pcsee.180067
Zhu, B., Ding, F., and Vilathgamuwa, D. M. (2020). Coat Circuits for DC-DC Converters to Improve Voltage Conversion Ratio. IEEE Trans. Power Electron. 35 (4), 3679–3687. doi:10.1109/tpel.2019.2934726
Keywords: free probability theory, asymptotic spectral distribution, free convolution operation, distribution network status assessment, moments
Citation: Zhang J, Wang B, Wang H, Ma H, Ma F, Li Y and Zhang Y (2022) Operation State Evaluation Method of Smart Distribution Network Based on Free Probability Theory. Front. Energy Res. 9:803010. doi: 10.3389/fenrg.2021.803010
Received: 28 October 2021; Accepted: 08 December 2021;
Published: 20 January 2022.
Edited by:
Yusen He, Grinnell College, United StatesReviewed by:
Lei Zhang, China Three Gorges University, ChinaTongmao Zhang, The University of Manchester, United Kingdom
Copyright © 2022 Zhang, Wang, Wang, Ma, Ma, Li and Zhang. This is an open-access article distributed under the terms of the Creative Commons Attribution License (CC BY). The use, distribution or reproduction in other forums is permitted, provided the original author(s) and the copyright owner(s) are credited and that the original publication in this journal is cited, in accordance with accepted academic practice. No use, distribution or reproduction is permitted which does not comply with these terms.
*Correspondence: Bo Wang, d2h3ZHdiQHdodS5lZHUuY24=