
94% of researchers rate our articles as excellent or good
Learn more about the work of our research integrity team to safeguard the quality of each article we publish.
Find out more
ORIGINAL RESEARCH article
Front. Energy Res. , 10 December 2021
Sec. Sustainable Energy Systems
Volume 9 - 2021 | https://doi.org/10.3389/fenrg.2021.802697
This article is part of the Research Topic Advanced Models of Energy Forecasting View all 14 articles
 Zhang Lianwei*
 Xiaoni Wen
The energy price influence system is one of the key mechanisms in the study of energy consumption. China’s household energy consumption has obvious regional differences, and rising income levels and urbanisation have changed the willingness and ability of households to make energy consumption choices. Based on the linear price effect of household energy consumption, this paper explores the scenario characteristics of energy prices affecting energy consumption, taking electricity and natural gas consumption as examples. Based on household energy consumption statistics from 2005 to 2018 in 36 major cities across China, the accuracy and change trends of household energy consumption forecasts are investigated through the decision tree-support vector machine (DT-SVR) non-linear forecasting technique. The study shows that the non-linear forecasting technique accurately portrays the predicted trends of changes in total urban household electricity and natural gas consumption. Within the less developed regions of economic development, income levels are still the main constraint on changes in urban household energy consumption, and the stimulating effect of income levels on household energy consumption has not been seen in the process of economic development in these less developed regions. Urbanisation as an important factor in examining household energy consumption, different development patterns and development processes will gradually be reflected in scenario aspects such as the choice of urban household energy consumption and changes in total consumption.
Globally, household energy consumption has reached nearly 35% of energy end-use consumption; the actual figures for China reflect this proportion to be over 10%, making it the second largest energy consuming sector in addition to industrial energy consumption. With the rapid economic and social development of China, household energy consumption has been growing at a relatively fast rate, with an average annual growth rate of 8% over the last two decades (Zheng et al., 2014), and this growth trend will continue to accelerate in the future (Yuan et al., 2015).
In terms of the main types of energy consumed by households in China, the use of fossil fuels is still the main source of household energy consumption. Under the constraints of global warming and environmental pollution, policy changes in household energy consumption will face reconciliation of accounts in terms of consumption structure and consumption patterns. There are many factors influencing household energy consumption, including per capita income, urbanisation and climatic conditions, when examined in terms of economic, social and environmental factors. Among these, there are inconsistent findings on the impact of urbanisation on household energy consumption. As the role of the population changes with urbanisation, the increased demand for electricity and the consumption of new electrical products are the main reasons for the increase in energy consumption due to the shift from rural to urban households (Fan et.al., 2017) Another type of study suggests that the efficient use of public facilities due to dense urban populations will help reduce the growth of household energy consumption (Han et al., 2016), etc. In addition, the main factor influencing household energy consumption is temperature conditions, which is important for the characteristics of household energy consumption in China. Energy consumption in the country is concentrated in a number of typical economic regions. Overall, there is a significant spatial distribution of household energy consumption in China. Beijing, Tianjin and Hebei are the main centres of energy consumption. In terms of changes in total per capita energy consumption, the main regional characteristics are “high in the north and low in the south”, and the national trend of household coal consumption is “high in the west and low in the east”. In the area of household electricity consumption, the nationwide pattern is “high in the south and low in the north”.
In terms of the influence of key factors on changes in total household energy consumption, income levels and population size are the main drivers of changes in household energy consumption. Increasing per capita income is positively correlated with household energy consumption; urbanisation has a typical “U” shaped non-linear relationship with household energy consumption; and energy prices have a significant negative relationship in influencing the change in total household energy consumption. At the same time, the trend of the influence of regional temperature on household energy consumption varies from region to region. In terms of household electricity consumption, per capita income, energy price, regional temperature, and urbanisation all show non-linear relationships on changes in household electricity consumption (Ding and Peng, 2020).
The consumption of energy in households has become a major sector contributing to the main growth in energy consumption. In this context, domestic and international research on household energy consumption is increasing year by year. In terms of exploring the factors influencing household energy consumption, Barnes et al. found, based on the energy ladder theory, that the structure of energy consumption shifts as household income increases; when household income increases by a certain amount (US$1000-1500) the consumption of electricity and natural gas increases significantly (Dougherty, 1993). Of course, changes in household energy mix need to take into account other factors such as utilities, resource endowments, cultural preferences, etc. However, because of possible economies of scale, demographic factors are important factors in examining structural changes in household energy consumption (Jingchao et al., 2012).
On the other hand, as urbanisation continues, the differences in energy consumption between urban and rural households have been widely discussed. Urban households have higher energy requirements per capita than other households due to differences in availability endowments (Lenzen et al., 2006). China’s residential energy consumption has significant regional and stepwise characteristics: heating is the main component of winter energy consumption in northern cities; urban households have better energy consumption attributes than rural households in several aspects. Overall, total household energy consumption in China is low, dominated by coal consumption, and there is a large gap between urban and rural household energy consumption behaviour.
Since the 1990s, the public has become aware of the fact that large emissions of greenhouse gases are the main cause of warming, and that greenhouse gases mainly originate from human consumption of energy, so that the relevant subjects concerning energy consumption and its carbon emissions have become the focus of academic research. Energy consumption in the household sector, on the other hand, has been a major area of study in recent years where the energy consumption sector is set to grow. Generally speaking, household energy consumption is contextually and morphologically diverse and can be divided into residential energy consumption generated in the internal space of the home and transport energy consumption generated outside the home through the use of private cars.
With regard to the micro perspective on the factors influencing household energy consumption, domestic studies have mainly conducted quantitative analysis from the perspective of household characteristics (e.g., housing type, household size, household type, etc.) and individual attributes (e.g. income level, education level, age stage, occupational category, etc.) (Saunders, 2013). However, the variability in habits and lifestyles of different households is one of the main reasons for intra-household differences in energy consumption. For example, changes in the lifestyles of household members, such as an increase in the number of dual-earner households and more time spent on leisure activities outside the home, can lead to a reduction in the amount of time people spend indoors and, consequently, a reduction in residential energy consumption. However, it has also been suggested that the relationship between residence time and energy consumption should be analysed more comprehensively in relation to the socio-economic characteristics of household members. Many foreign scholars have found that households with fewer members consume more residential energy. In the case of single-person households, for example, these households consume 17–30% more energy than households with two people living together. This finding also demonstrates the importance of economies of scale in reducing energy consumption levels.
As China’s economy develops and urbanisation progresses, the demand for household energy consumption has increased significantly. In the vast rural areas, it is still common for residents to rely on direct burning of firewood, straw and coal for their daily cooking. According to statistics, in 2014, China’s per capita domestic energy use was 346 kg of standard coal, of which 364 kg of standard coal were used by urban residents and 325 kg of standard coal by rural residents. From the perspective of research, there are three perspectives on China’s rural energy consumption: 1) Based on provincial-level rural energy statistics, the spatial pattern distribution and temporal distribution characteristics of China’s rural energy consumption are studied. 2) A study of the structure and willingness to consume energy in rural areas, based on field survey data from rural households. 3) An analysis of the characteristics of rural individual energy consumption.
There are two different judgments on the transition of rural household energy consumption in academia: one view is that rural households in China still mainly use traditional biomass energy sources such as fuelwood, a representative survey report includes the household energy consumption survey by Renmin University of China (Baltruszewicz et al., 2021), and other studies using household surveys have also reached similar conclusions; the other view is that rural household energy consumption is dominated by coal, a representative study includes The other view is that rural household energy consumption is dominated by coal, and representative studies include a study by Tian Yishui of the Ministry of Agriculture and field research by other scholars. Therefore, it is difficult to judge the stage of rural household energy consumption in China through the results of existing studies alone, and to identify whether a fundamental shift from traditional non-commodity energy to commodity energy has been achieved. The lack of judgement on the current structure of rural household energy consumption will greatly influence the formulation of relevant public policies, such as whether to invest more in rural energy infrastructure, whether to promote policies aimed at eradicating rural energy poverty, and whether to increase efforts to transform and upgrade rural energy.
The Energy Ladder theory suggests that rural households with low incomes mostly use fuelwood or dung as cooking fuel, and as incomes increase, they gradually move up the ‘energy ladder’ to a new stage of using electrical lighting and fossil fuels for cooking activities. This shift to modern fuels is generally achieved when per capita incomes reach US$1,000 to US$1,500. This theory clarifies the link between income and the type of energy used and indicates the level of income required for the energy transition. According to the “energy ladder” the shift in the structure of energy consumption will be a gradual replacement of polluting energy by clean energy, inefficient energy by efficient energy, and less convenient energy by more convenient energy. Lu Hui et al. used hierarchical analysis to study the relationship between household income and energy consumption structure in Jiangsu and Anhui provinces, and showed that farmers with higher income levels placed more importance on comfort, convenience and hygiene when choosing energy sources (Lu and Lu, 2006).
Energy consumption in rural households in China is likely to go through a process of gradual substitution of high quality energy for low quality energy in a sequential manner (Wang et al., 2018; Zhong et al., 2020). Table 1 presents the corresponding findings of representative literature based on household energy surveys of rural households in China in recent years. As can be seen, the point in time of the study, the area surveyed and the final conclusions vary greatly between the different literatures.

TABLE 1. Key findings on the structural characteristics of household energy consumption.
This paper applies the “linear regression-decision tree” method to analyse changes in energy consumption trends in urban households in China, based on a linear variable importance analysis. Figure 1 illustrates the logic of the analysis in this paper. Linearity in this paper refers to linearity in a broad sense, i.e., the relationship between data and data.
1) Principle features of regression
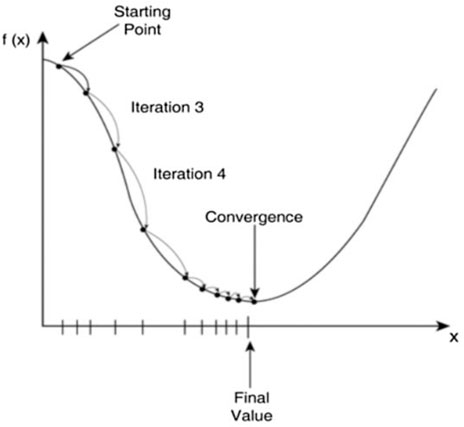
FIGURE 1. Model training process simulation process.
Assuming that the data is x and the result is y, the model in the middle is actually an equation, which is a one-sided interpretation, but helps us to understand what a model really is. Mathematical modelling is about finding the relationship between data and data from the data given in the question, building a mathematical equation model, and getting the result to solve real world problems (Qi et al., 2021) and finding solutions to real-world problems based on data, especially the processing of random data in the context of big data era (Wang, et al., 2022). It is actually the same as the model in machine learning (Zhang et al., 2020). So what is the general model of linear regression? The general model expression for linear regression is.
The mystery of the model has been unveiled to us in the form of this formula above. Don’t be intimidated by the formula, just know what the model looks like. Suppose i = 0, which represents a quadratic equation, a straight line through the origin in the coordinate system, and so on. Loss function: This is used to estimate the extent to which the predicted value of your model, f(x), is inconsistent with the true value of YY. The smaller the loss function, the better the model will be.
At first the loss function is relatively large, but as the straight line keeps changing (the model keeps being trained), the loss function gets smaller and smaller, thus reaching the minima point, which is the final model we want to obtain. This method is collectively known as gradient descent. As the model continues to be trained, the gradient of the loss function becomes flatter and flatter until the point of minima, where the distance from the point to the line and the minimum, so that the line passes through all the points, which is the model (function) we require. By analogy, the same is true for a high-dimensional linear regression model. The model is optimised using gradient descent to find the extreme value points, which is the process of model training.
But there are two main issues in the process of model fitting. One is that in machine learning model training, the better the generalization ability of a model, the better the model performs. What is the generalisation capability of a model? A model’s ability to generalise: how well a machine learning model learns concepts that the model has not encountered when it is in the process of learning. The generalisation ability of a model is a direct result of the over- and under-fitting of the model. Our goal is to minimise the sum of squares of the points to the line, so it is clear from the above illustration that the middle graph is a good fit, the leftmost case is an underfit, and the rightmost case is an overfit. Underfitting: The predicted value of the training set is quite wrong with the true value of the training set, which is called underfitting. Overfitting: The predicted value of the training set, which exactly fits the true value of the training set, is called overfitting. Underfitting is already well understood, that is, the error is relatively large, and overfitting is the training set on the performance is very good, a new batch of data for prediction results will be very unsatisfactory, generalization generalization is said to be a generalization. The solution uses a regularization term, which is a parameter to the gradient descent formula, i.e., Change in loss function from Eq. 3 to Eq. 4
Adding this regularisation term has the advantage of controlling the magnitude of the parameters and not allowing the model to become “uncontrolled”. Limiting the parameter search space solves the problem of underfitting and overfitting. As I said before, I’m explaining the principles and optimisation of linear regression models, but when it comes to actually using these methods, it’s a simple matter of saying that someone else has already prepared these computational libraries, thanks to open source!
2) Algorithmic features of decision trees
A decision tree is a supervised learning algorithm. It applies to categories and continuous input (features) and output (predictor) variables (as shown Figure 2). The tree-based approach divides the feature space into a series of rectangles and then places a simple model (like a constant) for each rectangle. Conceptually, they are simple and effective. First we go through an example to understand decision trees. The process of creating a decision tree is then analysed using a formal analytical approach. Consider a simple data set of customers of a lending company. We are given all customers’ checking account balances, credit history, length of tenure and previous loan status. The relevant task is to predict whether the customer’s risk rating is credible. The problem can be solved using the following decision tree.
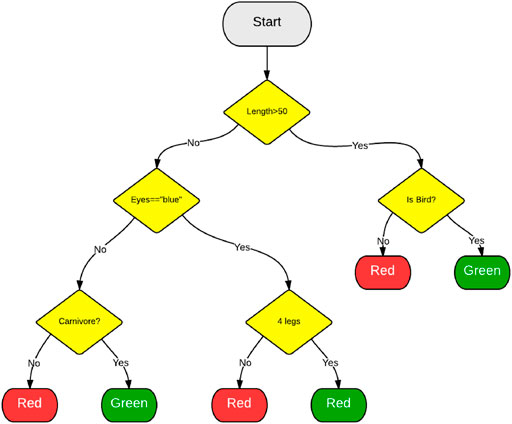
FIGURE 2. General logical characteristics of a decision tree.
We now turn our attention to the details of the CART algorithm for regression trees. Briefly, the creation of a decision tree consists of two steps (Kupka et al., 2010).
1. divide the predictor space, i.e., the set of possible values X_1, X_2, …, X_p, into J distinct and non-overlapping regions R_1, R_2, …, R_J.
2. the same prediction is made for each sample observation entering region R_J, and that prediction is the mean of the training sample predictions in R_J.
In order to create J regions R_1, R_2,…, R_J, the predictor regions are divided into high-dimensional rectangles or boxes. The aim is to find the box region R_1, R_2, …, R_J that minimises the RSS by means of the following equation
where yhat_Rj is the average predicted value of the training observations in the jth box shape.
Since this spatial splitting is computationally infeasible, we often use a greedy approach to partition the region, called recursive binary splitting.
It is greedy because at each step of the tree creation process the best partition is selected at each particular step, rather than predicting the future and picking a partition that will appear in future steps and help create a better tree. Note that all partition regions R_j are rectangles. In order to perform a recursive binary partition, the predictor X_j is first selected and the cut point s
where yhat_R1 is the average predicted value of the observed samples in region R_1(j,s) and yhat_R2 is the average predicted value of the observed samples in region R_2(j,s). This process is repeated to find the best predictors and cut points, and to further separate the data to minimise the RSS within each sub-region. However, we do not split the entire predictor space, we only split one or two of the previously identified regions. This process will continue until a stopping criterion is reached, for example we can set the stopping criterion to contain a maximum of m observations per region. Once we have created regions R_1, R_2, … R_J, given a test sample, we can use the average predicted value of all training samples in that region to predict the value of that test sample.
3) Least squares regression tree production algorithm
Input: training set—data set D.
Output: regression tree f(x).
In the input space where the training data set is located, recursively divide each region into two sub-regions and decide on the output value of each sub-region to construct a binomial decision tree.
Step 1: Choose the optimal cut variable j and cut point s. Solve that
Iterate over variable j, scanning the cut point s for a fixed cut variable j, choosing to use the above formula to bring it to a minimum value.
Step 2: Divide the region by the selected (j,s) and decide on the corresponding output value.
Step 3: continue to call steps (1) and (2) for both subset regions until the stop condition is met.
Step 4: Divide the input space into M regions, R1, R2,…, Rm, to generate a decision tree.
1) Linear forecast results for household electricity consumption
For the process of forecasting household energy consumption, both linear and non-linear forecasting techniques are used in this paper, and the results are compared for two household energy varieties, electricity and natural gas consumption. Figure 3 shows the sub-regional scenarios for linear forecasting of household electricity consumption. Figure 3A represents the national forecast of household electricity consumption levels; Figure 3B represents the forecast of household electricity consumption levels in the eastern region; Figure 3C represents the forecast of household electricity consumption levels in the central region; and Figure 3D represents the forecast of household electricity consumption levels in the western region.
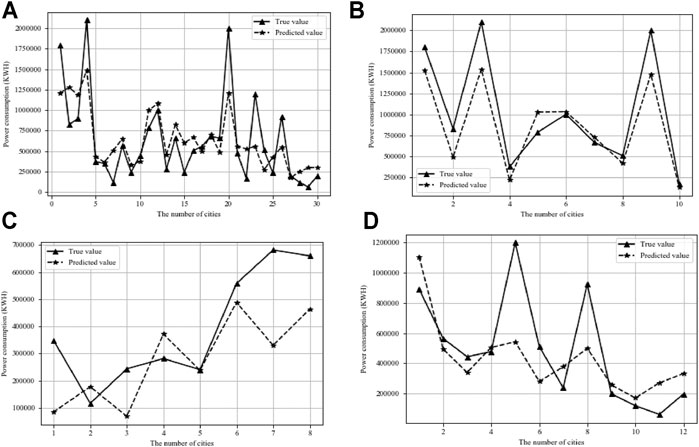
FIGURE 3. Linear forecast results for national urban household electricity consumption.
The specific forecast results show a high degree of accuracy and trend consistency in the national forecast of household electricity consumption. The forecasted values of household electricity consumption at a national level, as expressed in the total sample forecast, are relatively close to the true value levels. By region, the forecast accuracy is better in the Eastern region, followed by the Western region, and less accurate in the Central region. However, the trend in the distribution of forecast values shows that the forecast values for household electricity consumption in the East, Central and West regions show a better trend than the regional differences in electricity consumption levels.
Figure 4 shows the importance of the predictor variables for household electricity consumption at the national level. The national ranking shows that housing area, urbanisation rate and disposable income per capita are the top three factors in importance, indicating that living environment, urbanisation development and income play an important role in the growth of urban household electricity consumption; in terms of the directional characteristics of the impact, they all contribute positively to the growth of urban household electricity consumption.
2) Non-linear prediction results for household electricity consumption
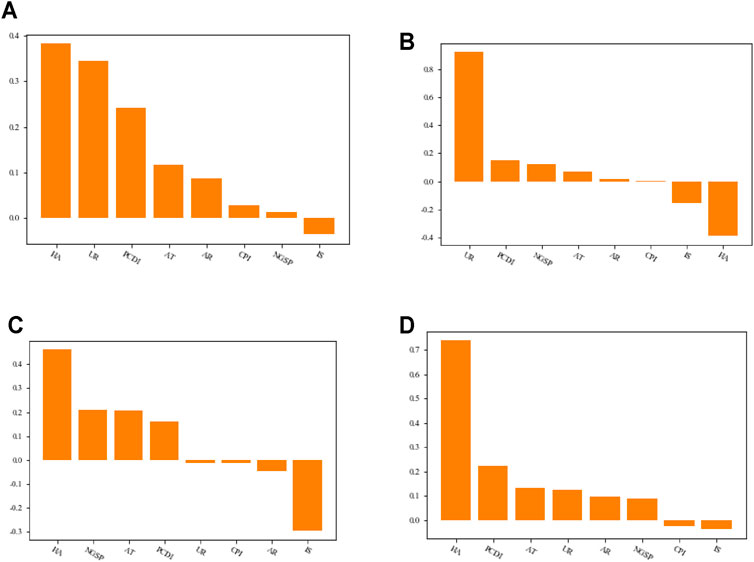
FIGURE 4. Ranking the importance of linear predictor variables of electricity consumption in urban households across the country.
Figure 5 shows the non-linear forecast of household electricity consumption by region. In particular, Figure 5A represents the national forecast of household electricity consumption levels; Figure 5B represents the forecast of household electricity consumption levels in the eastern region; Figure 5C represents the forecast of household electricity consumption levels in the central region; and Figure 5D represents the forecast of household electricity consumption levels in the western region. Compared to the linear forecast trend, the non-linear forecast results are more accurate.
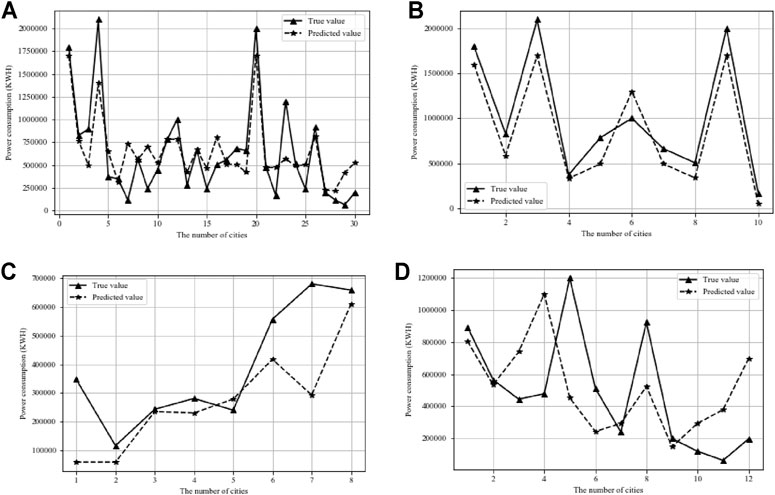
FIGURE 5. Non-linear forecast results for national urban household electricity consumption.
Figure 5A shows the results of the non-linear forecasts of household electricity consumption at a national level. The non-linear forecasts capture the evolution of changes in household electricity consumption in terms of the trend between the forecasted and true values. Across the region, the predicted values of household electricity consumption are highly consistent with the true values and are more accurate than the linear forecasts. The Eastern region model forecasts accurately express the trends and levels of change in the true values, but the forecasts fluctuate more than the true values. At the same time, the predicted values accurately predict the direction of fluctuations in the true values. In the specific case of urban household electricity consumption in the central region, the forecast values accurately predict the trends in household electricity consumption, but are less accurate in terms of the magnitude and direction of fluctuations in the forecast values to the true values. In terms of the forecast for urban household electricity consumption in the western region, similar to the central region, the forecast values pounce well on the trends in total household electricity consumption in the western cities, but in individual cities the gap between the forecast values and the true values is large.
Figure 6 shows the degree of importance of factors influencing urban household electricity consumption in a non-linear forecasting scenario for urban household electricity consumption, from a national as well as a sub-regional perspective. From a national perspective, the level of urbanisation development is the number one factor influencing urban household electricity consumption and has a significant influence. In addition to the level of urbanisation, the top three influencing factors are the size of the housing stock and the price of electricity. The top three most important factors influencing urban household electricity consumption in the Eastern region are consistent with the national level, with the difference being in the order of importance. The first most important factor in the Eastern region is still the level of urbanisation, while the impact of electricity prices on household electricity consumption overtakes that of house size in second place. In the central region, housing area, industrial structure and per capita disposable income are the three most important factors influencing urban household electricity consumption within the region. The area of the house is the first, while the industrial structure and disposable income per capita are the second and third. In the western region, the important factors influencing urban household electricity consumption are more distinctly different from those in the national, eastern and central regions, with house size, electricity price and average temperature being the three most important factors influencing urban household electricity consumption within the region. Further, in terms of economic development in the traditional sense, we find that the level of urbanisation and prices in the more economically developed regions, such as the coast, compared to the inland, are important factors influencing changes in household energy consumption. Factors affecting household electricity consumption in less economically developed regions in the traditional sense, such as the western region, are mainly manifested in factors such as climatic factors and the condition of residence. In the central region, in the context of the new economic development in recent years, the important factors affecting household electricity consumption in urban areas are economic factors such as industrial factors and household income factors.
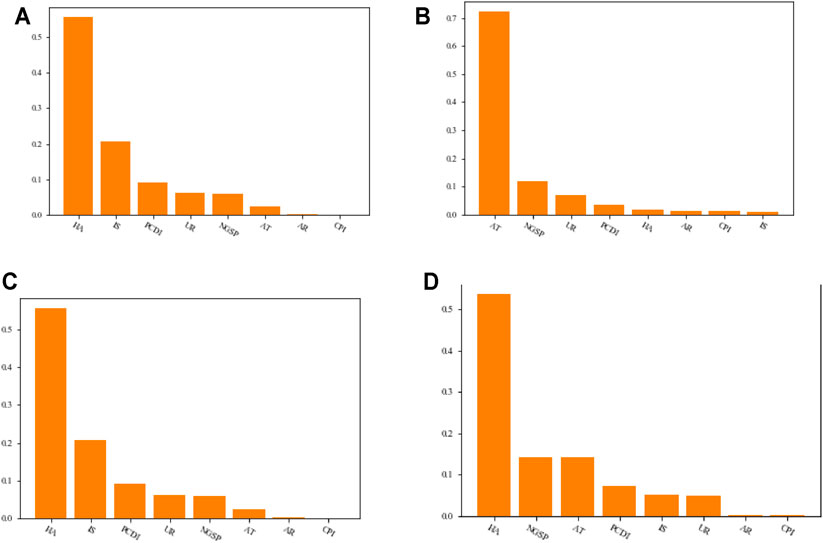
FIGURE 6. Ranking the importance of non-linear predictor variables of electricity consumption in urban households across the country.
1) Linear prediction results for household gas consumption
Figure 7 shows the results of the linear forecast of urban household gas consumption. On a national scale, the overall forecast results are better. At the eastern scale, the trend in the forecast values is the same as the trend in the composition of the true values, with the forecast values largely reflecting the level of change in urban household gas consumption. At the central scale, the overall forecast is lower than the true value of household gas consumption in the central cities, but basically reflects the trend in the composition of household gas consumption, which is a good forecast. At the western end of the scale, the projections are generally closer to the level and composition of household gas consumption.
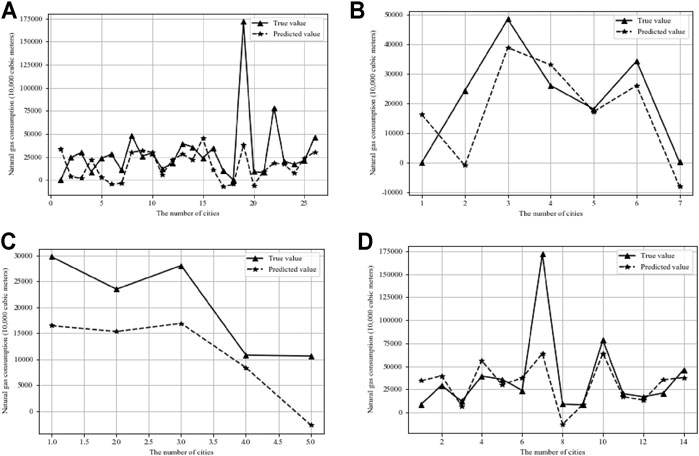
FIGURE 7. Linear projection results for urban household gas consumption.
Figure 8 shows the ranking of the importance of the predictor variables in the context of linear consumption of natural gas by urban households. At a national level, the top three most important factors influencing household gas consumption are per capita disposable income, house size and industrial structure, which are positively influencing urban household gas consumption. At the same time, in terms of the negative relationship, we find that the level of urbanisation and natural conditions are negatively important factors influencing the change in urban gas consumption. At the eastern scale, disposable income per capita, industrial structure and average temperature are the main factors that positively influence the change in urban gas consumption, while the level of urbanisation and the volume of gas sales are important factors that negatively inhibit the change in household gas consumption. At the central level, the main factors influencing changes in household gas consumption are industrial structure, urbanisation and per capita disposable income, all of which contribute positively to the growth of household gas consumption. The CPI index, gas sales and weather conditions are the main factors inhibiting the growth of household gas consumption. On a western scale, the size of housing stock and disposable income per capita are the main drivers of change in urban household gas consumption, while annual rainfall, the price of gas sales and industrial structure are the main factors inhibiting the growth of urban household gas consumption.
2) Non-linear prediction results for household gas consumption

FIGURE 8. Importance of linear predictor variables for urban household gas consumption.
Figure 9 shows the results of the regional perspective on the forecasted changes in urban household natural gas consumption in China in the context of non-linear forecasting techniques. On a national scale, the non-linear forecasting results are closer to the true levels and composition trends of urban household natural gas consumption. On an eastern scale, the point projections for different cities are closer to the true value of urban household gas consumption, but the overall projections are smaller than the true value of gas consumption. At the central scale, the forecasts of urban household gas consumption are more accurate in predicting the trends and composition of the true values, but in the comparison of the forecasts of urban household gas consumption levels, the majority of the forecasts are lower than the true values. At the western end of the range, the forecasts for urban household gas consumption are good, with the forecasts for gas consumption levels in the sample cities generally close to the true levels and reflecting the composition of the true values, demonstrating the accuracy of the non-linear forecasts in the urban household gas consumption process.
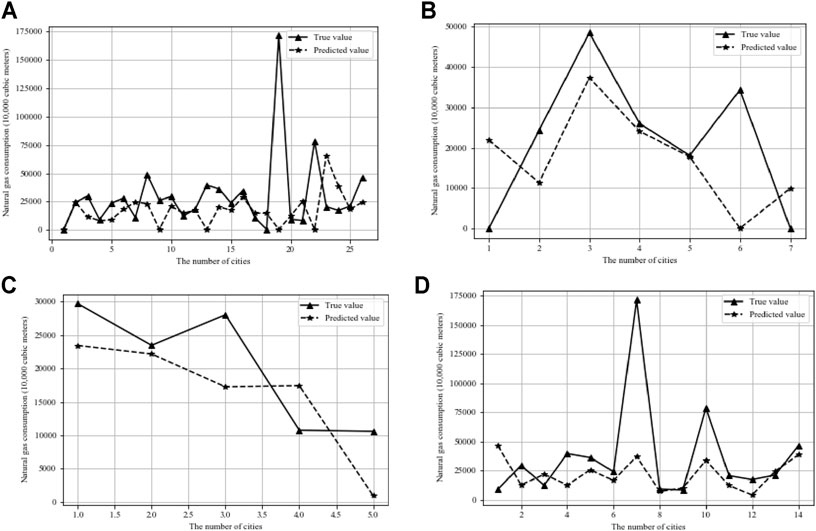
FIGURE 9. Non-linear forecast results for urban household gas consumption.
Figure 10 shows the degree of importance of the influencing factors affecting changes in household gas consumption in the non-linear forecasting process for urban household gas consumption. At a national level, the factors influencing changes in urban household gas consumption remain the sales price of gas, the size of the housing stock and disposable income per capita. At the eastern level, disposable income per capita, industrial structure and the level of urbanisation are the main factors that positively drive changes in urban household gas consumption. At the central scale, climatic conditions (average temperature) are the absolute drivers of growth in urban household gas consumption. At the western scale, the size of housing stock, the price of natural gas sales and the average temperature are important factors influencing the change in urban household gas consumption within the region. From a non-linear forecasting perspective, all influencing factors are positively associated with the level of change in urban household gas consumption.
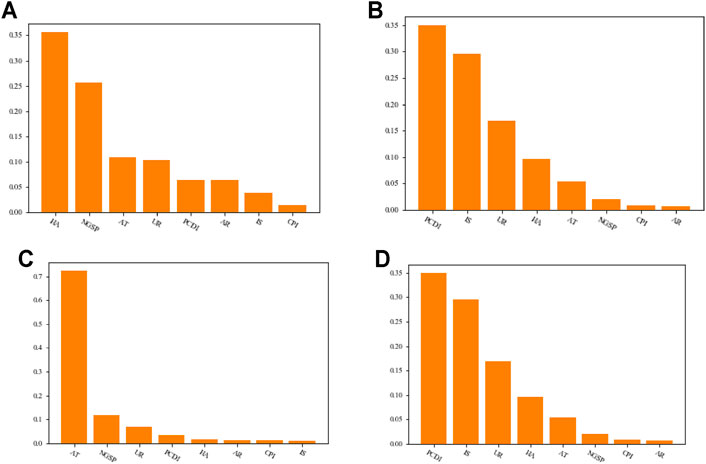
FIGURE 10. Importance of non-linear predictor variables for urban household gas consumption.
The forecasting analysis of urban household electricity and natural gas consumption above shows that the overall non-linear forecasting technique is superior to the linear forecasting technique. From a sub-regional research perspective, the drivers affecting household energy consumption vary across regional scales, showing significant regional differences. This may be related to the differences in the scale and level of development of the more pronounced regional economies in China.
1) Evaluation of urban household electricity consumption forecasts
This paper uses the DT-SVR non-linear technique for forecasting urban household energy consumption. Specific analyses were carried out to forecast and analyse urban household electricity consumption levels from four perspectives: national, eastern, central and western. In order to assess the effectiveness of the DT-SVR forecasting technique chosen in this paper, the forecasting results are evaluated in this paper, comparing the accuracy evaluation criteria of the linear and non-linear forecasting approaches respectively.
Table 2 indicates the accuracy evaluation indicators for the forecasts in this section. Firstly, the squared absolute error values of forecasts for national urban household electricity consumption show that the mean absolute error (MAE) values for the decision tree algorithm and the support vector machine approach are significantly smaller than the MAE values under the linear forecasting approach. At the same time, the root mean-square error (RMSE) values for the decision tree algorithm and the support vector machine approach are significantly smaller than the RMSE values under the linear forecasting approach. These types of evaluation indicators illustrate that at the national level, non-linear forecasting of household electricity consumption is more accurate. Secondly, the accuracy of the urban household electricity consumption forecasting results is seen in the eastern, central and western parts of the region, while the mean absolute error and root mean square error values of the non-linear forecasts are significantly smaller than the MAE and RMSE values of the linear forecasts. Further, this paper shows the results of linear and non-linear forecasting techniques by comparing the directional symmetry of the forecasts. The results show that the directional symmetry of directional symmetry (DS) under the national urban household electricity consumption level forecast is significantly higher than the DS value obtained under the non-linear forecasting technique.
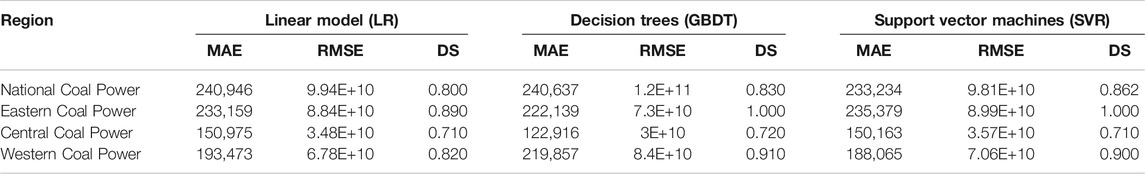
TABLE 2. Comparison of evaluation indexes of linear and non-linear results.
These results further validate the role of non-linear forecasting techniques in influencing the level of urban household electricity consumption.
4) Trends in non-linear forecasts of household electricity consumption
Table 3 shows the forecast trend of household electricity consumption in major cities in eastern China. The forecast results show that in mega cities, such as Beijing, Tianjin and Shanghai, household electricity consumption is forecast to show a year-on-year growth trend from 2019 to 2023. The DT-SVR non-linear forecast finds that household electricity consumption in cities such as Xiamen and Ningbo will show fluctuations in individual years from 2019 to 2023. In comparison, urban household electricity consumption in Hangzhou and Fuzhou will show individual year declines.
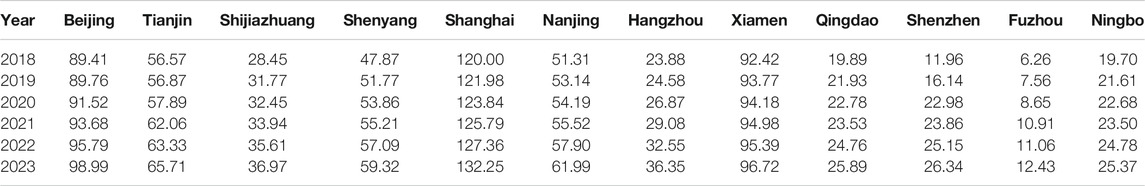
TABLE 3. Forecast trends in urban household electricity consumption in the Eastern Region (billion kWh).
Table 4 shows the forecast trend of household electricity consumption in major cities in Central China. The forecast results indicate that urban household electricity consumption in the central region is expected to exhibit a continuous growth trend during 2019–2023. The forecast results show that in major coal producing provinces, such as Shanxi, urban household electricity consumption shows a relatively large expected growth. Central cities, such as Wuhan, also show very strong growth in urban household electricity consumption. From a regional perspective, cities in the northeastern provinces, such as Changchun and Harbin, show greater potential for growth in urban household electricity consumption.
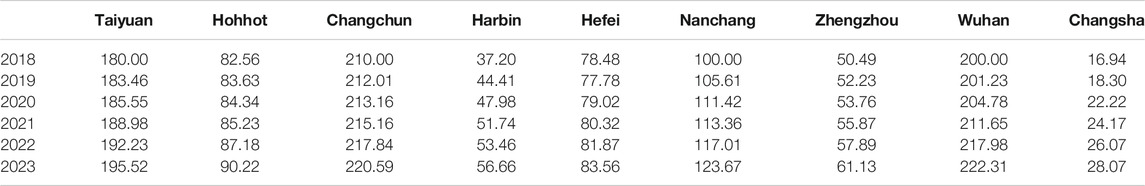
TABLE 4. Forecast trends in urban household electricity consumption in the Central Region (in billion kWh).
Table 5 shows the forecast trends in household electricity consumption levels for the major cities in the western region of China. Western cities’ household electricity consumption will show a large fluctuating trend between 2019 and 2023. Chengdu, as one of the major representatives of cities in the western region, maintains a continuous growth momentum. While urban cities such as Lanzhou, Yinchuan and Xi’an have expected consumption fluctuations in urban household electricity consumption from 2019 to 2023. While cities in remote areas, such as Urumqi will continue to increase the level of urban household electricity consumption, maintaining a clear trend of growing household electricity consumption.
2) Evaluation of urban household gas consumption forecasts
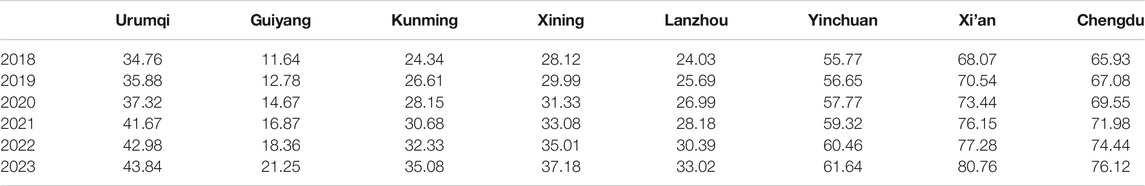
TABLE 5. Forecast trends in urban household electricity consumption in the Western Region (in billion kWh).
This paper uses the DT-SVR non-linear technique for forecasting urban household energy natural gas. In order to assess the validity of the DT-SVR forecasting technique chosen in this paper, the results are evaluated by comparing the accuracy evaluation criteria of linear and non-linear forecasting methods. For the forecasting of urban household gas consumption levels, the paper also compares the model evaluation values of the above three forecasting techniques. The analysis shows that both at the national and sub-regional levels, the decision tree non-linear forecasting technique is more accurate than the non-linear analysis technique, in terms of the level of values taken for the three types of indicators. The mean absolute error (MAE) and root mean square error (RMSE) values for non-linear forecasting are smaller than the corresponding evaluation indicator values for the decision tree forecasting technique (Rasheed, 2021). Comparing the linear forecasting technique with the support vector machine analysis technique similarly expresses the high accuracy of the non-linear forecasting technique in the forecasting process of urban household gas consumption levels. Further, this paper compares the directional symmetry indicators of urban household natural gas consumption level forecasting and finds that none of the DS values of the non-linear forecasting techniques are smaller than those of the linear forecasting techniques, illustrating the good results of this paper’s DS-SVR non-linear forecasting model in urban household natural gas consumption level forecasting (as shown in Table 6).
4) Trends in non-linear projections of household gas consumption
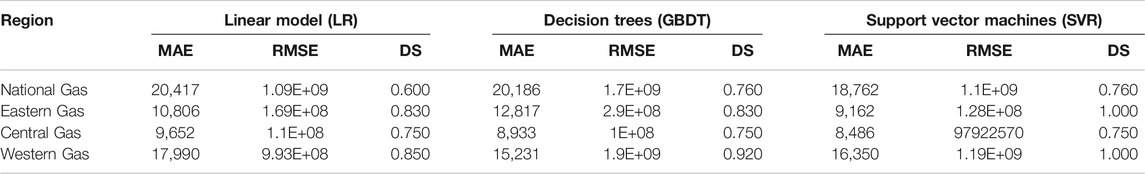
TABLE 6. Comparison of prediction results between linear and non-linear prediction methods.
Table 7 shows the projected trends in the amount of change in household natural gas consumption in the major cities in the eastern region of China. Household natural gas consumption in the major cities all show an increasing trend of change. Natural gas, as the main source of energy consumption in major urban households, shows an almost consistent trend of growth in consumption in all large cities. In particular, cities such as Background, Tianjin and Qingdao. Relatively speaking, the total level of household natural gas consumption in the sub-developed cities on the eastern seaboard was largely flat, but still maintained its future growth trend.
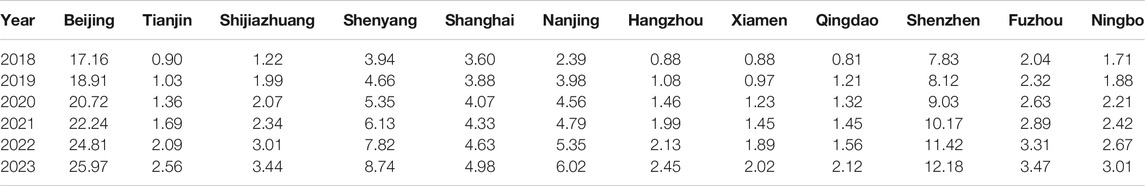
TABLE 7. Projected trends in urban household gas consumption in the Eastern Region.
Table 8 shows the projected trends in the level of household natural gas consumption in the central region of China. Looking at the forecast levels for the major cities, the incremental increases in household natural gas consumption in central cities are modest, but all have a trend of year-on-year growth. In comparison, cities along the Yangtze River, such as Wuhan and Changsha, have higher levels of total annual household gas consumption than most other cities. Taiyuan, as one of the major representatives of central cities, has a more pronounced growth trend in urban household gas consumption.
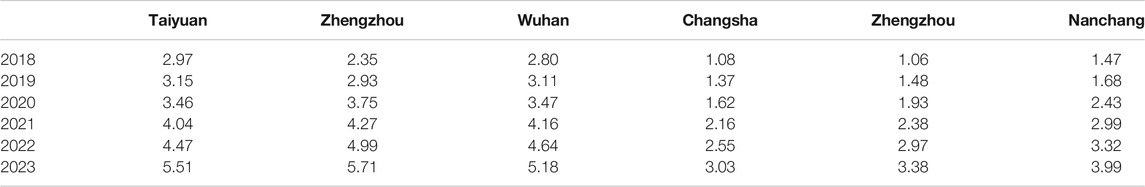
TABLE 8. Projected trends in urban household gas consumption in the Central Region.
Table 9 shows the projected trends in household natural gas consumption levels in the western region of China. As representatives of the cities in the western region, Xi’an and Chengdu cities have continued to increase their household energy consumption changes. In contrast, cities in remote areas such as Lanzhou and Xining cities show a smaller increase in household natural gas consumption. Yinchuan, on the other hand, is expected to show a more significant change in natural gas growth trends.
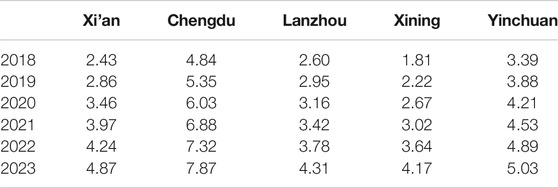
TABLE 9. Projected trends in urban household gas consumption in the Western Region.
In summary, projections of natural gas consumption levels in urban households in China show significant regional variation. There are regional differences not only in the annual aggregate characteristics of the change in natural gas consumption growth, but also in the comparative magnitude of growth. Projections of household gas consumption are generally higher in developed coastal cities than in less developed inland cities; and the growth trend in household gas consumption is generally higher in cities with faster economic growth inland than in cities with less developed economic development. These characteristics will play a positive role in the process of formulating and evaluating household energy consumption policies, and will help to objectively assess the effectiveness and regional synergistic effects of household energy policies.
Electricity consumption is the main type of energy consumed by urban households in China and has a diversity of uses. The level of urbanisation development becomes an important factor influencing urban household electricity consumption, both in non-linear and linear projections (Baltruszewicz et al., 2021). From an analytical perspective of household energy policy efficiency, urbanisation development is an important economic category in China, with two points of concern: firstly, the path of urbanisation development in China, whether it manifests itself in the form of population migration as urbanisation progresses, or in the form of local urbanisation. Secondly, the availability of household energy in the development of urbanisation. In terms of the first point, we argue that the development of urbanisation changes the quality and level of accessibility of household energy consumption. In particular, for the period of transition from rural to urbanisation, urbanisation has on the one hand reduced the structure of energy supply for rural households after urbanisation and on the other hand increased the cost of energy access for urban households (Shen et al., 2020). Electricity, as a clean, modern energy source, has two important apparent outcomes in the urbanisation process. One is the total growth of electricity consumption due to the influence of energy consumption rigidity; the other is the total growth of electricity consumption due to the substitution between energy consumer goods. This is particularly true for the movement of people in the development of urbanisation (rural-urban migration due to urbanisation).
The level of per capita income remains a major constraint on household energy consumption in central and western cities. In recent years, with China’s Belt and Road Economic Belt initiative and a series of policies to vigorously develop content city clusters, public income levels have gradually increased under the operating mechanism of urbanisation development pushing back the economy (Mrówczyńska et al., 2020). In rural areas in particular, the phenomenon of energy poverty has gradually improved in individual areas. But the potential for the role of per capita income levels on household energy consumption is stronger in the central and western range. On the one hand, income factors remain the main constraint on the ability to spend on consumption in the traditionally less developed regions of the Midwest. On the other hand, the gradual increase in income levels has been accompanied by a gradual release of the potential for household energy consumption. In this sense, the potential for urban household energy consumption, particularly electricity consumption, in the central and western regions will continue to grow in the short term as income levels increase.
Natural gas consumption is one of the key categories of energy consumption in urban households (Wang et al., 2021). In this paper, both linear and non-linear forecasting techniques are applied to urban household gas consumption. The results show that the non-linear forecasts more accurately reflect the changes and trends in the composition of urban household natural gas consumption, but the important factors affecting urban household natural gas consumption vary slightly across regions. Overall, the main factor influencing urban household gas consumption is income level (Gassar et al., 2019). However, in China’s urbanisation process, there are important structural factors in household gas consumption, namely the composition of the main consumers of gas in urban households. This is inextricably linked to the way in which China’s urbanisation is progressing. As mentioned earlier, the transfer of rural to urban populations will contribute to the growth of urban household gas consumption in terms of aggregate uplift. The urbanisation of rural areas in situ will contribute to the change in the total volume of household gas consumption from the perspective of the structural composition of the consumer group. The process of urbanisation has, in some cases, reduced the ease and diversity of access to energy in rural areas and increased the consumption of key energy sources. This is also influenced to some extent by supply policies accordingly.
In terms of the impact of rising incomes on urban household gas consumption, the impact of disposable income on changes in urban household gas consumption within the Midwest is more pronounced (Jürisoo et al., 2019). From the indication of the forecast results, the sales price of natural gas is an important factor influencing natural gas consumption. On the one hand, urban residents are less price sensitive to household natural gas consumption due to the rigid nature of natural gas consumption in the context of urban life; on the other hand, the potential of income to stimulate consumption capacity is under-stimulated in the urban household consumption scenario. That is, with the further rise in income levels of urban residents in less developed regions and the further acceleration of urbanisation, the growth in total urban household natural gas consumption will increasingly manifest itself in the continued growth of total urban household natural gas consumption. At the same time, while taking into account economic factors, social factors, climate factors are also key elements affecting natural gas consumption. Natural gas consumption is a modern clean energy source and an important source of supporting urban household energy consumption in the urbanisation process. In the future, as the urbanisation process accelerates and develops, the total change in urban household natural gas consumption will continue to maintain a continuous growth process.
In this paper, we apply linear and non-linear forecasting techniques to forecast and analyse the trends in total urban household electricity and natural gas consumption and the factors affecting them. In the implementation of the forecasting analysis, we compare the forecasting accuracy of household electricity and natural gas consumption in the context of linear and non-linear analyses respectively. Also, the important factors influencing urban household electricity and natural gas consumption are examined and ranked separately in the context of the two forecasting techniques. Again on the basis of this the research implications and value of the forecasting results are analysed through discussion.
The findings show that non-linear forecasting techniques are highly effective in accurately portraying changes in urban household electricity consumption and changes in total natural gas consumption. When looking at the factors influencing urban household electricity consumption and natural gas consumption from four scoping perspectives - nationwide, eastern, central and western the degree to which the main influencing factors play a role varies and exhibits significant regional differences.
In general, the important influencing factor on household energy consumption in the eastern region is mainly manifested in the level of urbanisation development, the influencing factor on household energy consumption in the central region is mainly influenced by factors such as industrial structure, and the change in total urban household energy consumption in the western region is more influenced by natural conditions and income levels. From the traditional sense of the degree of economic development, within the less developed economic development regions, income level is still the main factor limiting the change in urban household energy consumption, income level on household energy consumption has not been stimulated in the process of economic development in these less developed regions, is not yet fully released, will be further manifested in the promotion of household energy consumption on the role. Urbanisation as an important factor in examining household energy consumption, its different development patterns and processes will gradually be reflected in the choice of urban household energy consumption and changes in total consumption and other scenarios. This is also an important consideration in the development of household energy policies.
The original contributions presented in the study are included in the article/Supplementary Material, further inquiries can be directed to the corresponding author.
Conceptualization, LZ and XW; methodology, LZ; software, LZ; validation, LZ and XW; formal analysis, LZ; investigation, LZ; resources, XW; data curation, LZ; writing “original draft preparation, LZ; writing” review and editing, XW; visualization, LZ; funding acquisition, XW. All authors have read and agreed to the published version of the manuscript.
The paper is supported by the National Natural Science Foundation of China (No. 71874133).
The authors declare that the research was conducted in the absence of any commercial or financial relationships that could be construed as a potential conflict of interest.
All claims expressed in this article are solely those of the authors and do not necessarily represent those of their affiliated organizations or those of the publisher, the editors, and the reviewers. Any product that may be evaluated in this article, or claim that may be made by its manufacturer, is not guaranteed or endorsed by the publisher.
The authors would like to thank the referees as well as the editors.
Baltruszewicz, M., Steinberger, J. K., Owen, A., Brand-Correa, L. I., and Paavola, J. (2021). Final Energy Footprints in Zambia: Investigating Links between Household Consumption, Collective Provision, and Well-Being. Energ. Res. Soc. Sci. 73 (6), 101960. doi:10.1016/j.erss.2021.101960
Ding, Y. X., and Peng, S. (2020). Study on the Spatial Distribution and Influencing Factors of Household Energy Consumption in China[J]. Resource Development Market 36 (04), 366–370. doi:10.3969/j.issn.1005-8141.2020.04.006
Dougherty, W. W. (1993). Statement and Process: Designing 'good' Arguments about the Rural Energy Problem in Developing Countries. Environ. Plann. B 20 (4), 379–390. doi:10.1068/b200379
Fan, J.-L., Zhang, Y.-J., and Wang, B. (2017). The Impact of Urbanization on Residential Energy Consumption in China: An Aggregated and Disaggregated Analysis. Renew. Sustainable Energ. Rev. 75 (10), 220–233. doi:10.1016/j.rser.2016.10.066
Gassar, A., Yun, G. Y., and Kim, S. (2019). Data-driven Approach to Prediction of Residential Energy Consumption at Urban Scales in London[J]. Energy 187 (Nov.15), 115973.1–115973.13. doi:10.1016/j.energy.2019.115973
Han, C., Huang, Y., Shen, H., Chen, Y., Ru, M., Chen, Y., et al. (2016). Modeling Temporal Variations in Global Residential Energy Consumption and Pollutant Emissions[J]. Appl. Energ. 184, 820–829. doi:10.1016/j.apenergy.2015.10.185
Jingchao, Z., and Kotani, K. (2012). The Determinants of Household Energy Demand in Rural Beijing: Can Environmentally Friendly Technologies Be Effective? Energy Econ. 34 (2), 381–388.
Jürisoo, M., Serenje, N., Mwila, F., Lambe, F., and Osborne, M. (2019). Old habits die hard: Using the energy cultures framework to understand drivers of household-level energy transitions in urban Zambia. Energ. Res. Soc. Sci. 53, 59–67. doi:10.1016/j.erss.2019.03.001
Kupka, J., Jirava, P., and Kaparová, M. (2010). Quality of Life Modelling Based on Decision Trees[J]. E a M: Ekonomie a Management 13 (3), 130–146.
Lenzen, M., Wier, M., Cohen, C., Hayami, H., Pachauri, S., Schaeffer, R. A., et al. (2006). A Comparative Multivariate Analysis of Household Energy Requirements in Australia, Brazil, Denmark, India and Japan[J]. Energy 31 (2/3), 181–207. doi:10.1016/j.energy.2005.01.009
Li, G., Ning, B., Abdu, M. A., Otsuka, Y., Yokoyama, T., Yamamoto, M., and Liu, L. (2013). Longitudinal Characteristics of Spread F Backscatter Plumes Observed With the EAR and Sanya VHF Radar in Southeast Asia. J. Geophys. Res.: Space Phys. 118 (10), 6544–6557.
Lu, H., and Lu, L. (2006). An Empirical Analysis of the Impact of Farmers' Income Level on the Energy Consumption Structure of Rural Households[J]. Finance Trade Res. 2006 (03), 28–34. doi:10.19337/j.cnki.34-1093/f.2006.03.005
Mrówczyńska, M., Skiba, M., Bazan-Krzywoszańska, A., and Sztubecka, M. (2020). Household Standards and Socio-Economic Aspects as a Factor Determining Energy Consumption in the City[J]. Appl. Energ. 264, 114680. doi:10.1016/j.apenergy.2020.114680
Qi, L., Fengde, W., Jindong, L., and Wensheng, X. (2021). A Hybrid Support Vector Regression with Multi-Domain Features for Low-Velocity Impact Localization on Composite Plate Structure[J]. Mech. Syst. Signal Process. 154, 107547. doi:10.1016/j.ymssp.2020.107547
Rasheed, A. A. (2021). Improving Prediction Efficiency by Revolutionary Machine Learning Models[J]. Mater. Today Proc. 2021 (1). doi:10.1016/j.matpr.2021.04.014
Saunders, H. (2013). Is what We Think of as "rebound" Really Just Income Effects in Disguise? Energy Policy 57 (jun), 308–317. doi:10.1016/j.enpol.2013.01.056
Shen, M., Lu, Y., Wei, K. H., and Cui, Q. (2020). Prediction of Household Electricity Consumption and Effectiveness of Concerted Intervention Strategies Based on Occupant Behaviour and Personality Traits[J]. Renew. Sustainable Energ. Rev. 127, 109839. doi:10.1016/j.rser.2020.109839
Tonooka, Y., Liu, J., Kondou, Y., Ning, Y., and Fukasawa, O. (2006). A Survey on Energy Consumption in Rural Households in the Fringes of Xian City. J. Energy Build. 38 (11), 1335–1342.
Wang, F., Zhou, Z., Dai, Z., Gong, X., Yu, G., Liu, H., and Yu, Z. l. (2007). Development and Demonstration Plant Operation of an Opposed Multi-Burner Coal-Water Slurry Gasification Technology. J. Front. Energy Power Eng. China 1 (3), 251–258.
Wang, S., Liu, X., Jiang, S., and Zhan, Y. (2018). Reducing Energy Bill of Data center via Flexible Partial Execution. J. Ambient Intell. Hum. Comput. doi:10.1007/s12652-018-1157-9
Wang, S., Sun, S., Zhao, E., and Wang, S. (2021). Urban and Rural Differences with Regional Assessment of Household Energy Consumption in China. Energy 232, 121091. doi:10.1016/j.energy.2021.121091
Wang, S., Xu, Z., and Ha, J. (2022). Secure and Decentralized Framework for Energy Management of Hybrid AC/DC Microgrids Using Blockchain for Randomized Data. Sustainable Cities Soc. 76, 103419. doi:10.1016/j.scs.2021.103419
Xu, K., Chen, C., Liu, H., Tian, Y., Li, X., and Yao, H. (2014). Effect of Coal Based Pyrolysis Gases on the Performance of Solid Oxide Direct Carbon Fuel Cells. Internat. J. Hydrogen Energy 39 (31), 17845–17851.
Yuan, B., Ren, S., and Chen, X. (2015). The Effects of Urbanization, Consumption Ratio and Consumption Structure on Residential Indirect CO2 Emissions in China: A Regional Comparative Analysis. Appl. Energ. 140 (feb.15), 94–106. doi:10.1016/j.apenergy.2014.11.047
Zhang, R., Wei, T., Glomsrød, S., and Shi, Q. (2014). Bioenergy Consumption in Rural China: Evidence From a Survey in Three Provinces. J. Energy Policy 75, 136–145.
Zhang, C., and Yang, J. (2019). Economic Benefits Assessments of “Coal-to-Electricity” Project in Rural Residents Heating Based on Life Cycle Cost. J. Cleaner Prod. 213, 217–224.
Zhang, K., Zhu, D., Li, J., Gao, X., and Lu, J. (2020). Learning Stacking Regression for No-Reference Super-resolution Image Quality Assessment[J]. Signal. Process. 2020, 107771. doi:10.1016/j.sigpro.2020.107771
Zheng, X., Wei, C., Qin, P., Guo, J., Yu, Y., Song, F., et al. (2014). Characteristics of Residential Energy Consumption in China: Findings from a Household Survey. Energy Policy 75, 126–135. doi:10.1016/j.enpol.2014.07.016
Keywords: household energy consumption, electricity, natural gas, DT-SVR, energy forecasting
Citation: Lianwei Z and Wen X (2021) Urban Household Energy Consumption Forecasting Based on Energy Price Impact Mechanism. Front. Energy Res. 9:802697. doi: 10.3389/fenrg.2021.802697
Received: 28 October 2021; Accepted: 22 November 2021;
Published: 10 December 2021.
Edited by:
Lean Yu, Beijing University of Chemical Technology, ChinaReviewed by:
Quanying Lu, Institute of Systems Science, Academy of Mathematics and Systems Science (CAS), ChinaCopyright © 2021 Lianwei and Wen. This is an open-access article distributed under the terms of the Creative Commons Attribution License (CC BY). The use, distribution or reproduction in other forums is permitted, provided the original author(s) and the copyright owner(s) are credited and that the original publication in this journal is cited, in accordance with accepted academic practice. No use, distribution or reproduction is permitted which does not comply with these terms.
*Correspondence: Zhang Lianwei, bHd6aGFuZzIwMTdAMTYzLmNvbQ==
Disclaimer: All claims expressed in this article are solely those of the authors and do not necessarily represent those of their affiliated organizations, or those of the publisher, the editors and the reviewers. Any product that may be evaluated in this article or claim that may be made by its manufacturer is not guaranteed or endorsed by the publisher.
Research integrity at Frontiers
Learn more about the work of our research integrity team to safeguard the quality of each article we publish.