 Yuan Zhao
 Weihua Yu
 Dingwei Guo
 Xiaoping He
- 1Jinhe Center for Economic Research, Xi’an Jiaotong University, Xi’an, China
- 2China Center for Energy Economics Research, School of Economics, Xiamen University, Xiamen, China
In light of China’s Carbon Neutrality Target and facing the fluctuating pressure of power supply brought on by new energy intermittent power generation, it is urgent to mobilize a large number of residential flexible loads that can respond instantaneously to mitigate peak–valley difference. Under a framework of demand-side management (DSM) and utility analysis, we empirically investigate customers’ costs from interrupting typical electrical terminals at the household level. Specifically, by using the contingent valuation method (CVM), we explore the factors that affect households’ Willingness to Accept (WTA) of voluntarily participating in the interruption management during the summer electricity peak and estimate the distribution of households’ WTA values. We find that given the value of WTA, households’ participation rate in the interruption management significantly decreases with the increase in interruption duration and varies with the type of terminal appliance that is on direct interruption management. Moreover, the majority of households are willing to participate in the interruption management even if the compensation amount is low. The factors that determine households’ WTA and the size of their influences vary with the type of electrical terminal. The results imply that differentiating the terminal electricity market and accurately locking on the target terminals by considering the household heterogeneity can reduce the household welfare losses arising from DSM.
Introduction
To reach peak CO2 emission by 2030 and achieve carbon neutrality by 2060, China has initiated a transition toward a more sustainable energy system based on renewable energies. The average growth rate of investment in the renewable energy industry within the Chinese market has been 16.83% since 2009. China occupies 39% of the world’s renewable energy employment (Wang et al., 2021). With the increasing proportion of intermittent power generation such as wind and solar energy in China’s power grid, the power supply presents significant random fluctuation, bringing new challenges to the balance of power supply and demand and to the stable operation of the power grid. In order to better integrate renewable energies—particularly wind and solar with high variability due to fluctuating weather conditions—and to ensure the stability of the power system, a more flexible frame of residential demand side within the power system is needed through providing balanced power by frequent control and supporting the management of grid congestions in transmission grids.
Constant electricity supply is a fundamental requirement for well-functioning modern societies. Pursuing a balance between improvement in electricity service quality and its impact on customer prices is a challenge for regulators and electricity producers in most countries since improved quality often requires a higher level of energy expenditure. The satisfaction of peak demand plays a very important role in the costs of electricity generation and supply; hence, how peak demand can be effectively controlled has long been a crucial problem in load management.
Demand-side management (DSM) has been widely regarded as an effective solution to curb peak demand and reliability of the electricity system. To minimize customers’ losses from a measure of DSM, such as direct control and interruptions, a sophisticated scheme needs to identify the target groups and terminals. For non-residential sectors, the costs of DSM can be readily estimated by using market prices. However, for residential customers, the composition of costs is more complex since it involves the welfare losses in terms of less leisure, inconvenience, or discomfort which cannot be observed directly in the market. It is widely accepted that interventions to reduce the residential energy gap need to address these welfare losses by monetary compensation or other behavioral factors (Wilson and Dowlatabadi, 2007).
Our study focuses on the residential sector. Residential demand is primarily shaped by a small number of energy-intensive domestic appliances, which implies a large potential of energy saving by improving households’ voluntary participation in DSM. Recent developments of the smart grid allow DSM techniques to be implemented more effectively and permit the use of new strategies (Ramchurn et al., 2012). The smart grid is the next-generation electricity grid that enables bidirectional flows of energy and uses two-way communication to control capabilities, which will lead to an array of new functionalities and applications. These techniques encourage the reduction of the total electricity demand and contribute to smoothing peak load curves (Langendahl et al., 2019). Widespread commercialization of smart metering and mobile application has enabled direct controlling of electrical terminals of households (Corbett et al., 2018; Morrissey et al., 2018). The smart grid and advanced metering infrastructure (AMI) in the household can record customer consumption in real time and provide two-way interaction, enabling active participation by customers on the demand side. Moreover, by installing chips on each home appliance, various management modes are directed to each terminal, such as the air conditioner, TV, and space heating. The new management approach may not only mobilize considerable demand side resources and provide various consumers with a flexible electricity service based on different combinations of electrical characteristics but also offer controllable resources for the power grid.
Load control at the household level will affect households’ utility and comfort. To minimize households’ welfare losses from the control, there is a need to evaluate the utility value of different customer groups from using different electrical terminals during different periods. The point is to know the extent to which customers are willing to accept the welfare losses by gaining certain monetary compensation and to know which terminals are to be controlled.
In China, where the degree of intermittent production has significantly increased as the share of renewables increases, the demand for electricity, particularly the residential demand, is also increasing rapidly; however, research studies on electricity market management of China mainly focus on supply-side costs and benefits (Wang et al., 2014; Fan et al., 2016). We try to fill the gaps in the field of DSM study by exploring the DSM costs of on demand-side.
Under the utility analysis framework, we estimate the distribution of households’ Willingness to Accept (WTA) values of voluntary interruption during the summer electricity peak and explore the factors that affect WTA. We find that given the same WTA value, the proportion of households which agree to participate in interruption management significantly decreases as the interruption duration increases, and the participation rate varies with the type of the terminal appliance that is directly controlled. Moreover, most households would be willing to accept the interruption even if the compensation is low. The factors determining households’ WTA and the size of their influences both vary with the type of electrical terminal that is on interruption management. These findings highlight the importance of differentiating terminal electricity markets and considering households’ heterogeneity in cost-effective DSM designs.
Our study contributes to the literature in two ways. First, the traditional interruption mechanism cuts off the whole power supply of a household, resulting in significant welfare loss to consumers in addition to the low level of demand response. This study proposes an interruption strategy that targets key household appliances to mobilize a flexible load of demand given the smart grid technology and the compensation mechanism based on the heterogeneity in household interruption costs. The empirical results provide evidence on the heterogeneity of interruption costs, which is the foundation of the interruption mechanism in the peak. Second, due to the constraints of technology and data availability, the existing studies on interruption contracts and DSM in China tend to deemphasize the consumer behavior factors, which makes the designs of DSM and the peak load regulation mechanism lack a micro-basis. This study applies the contingent valuation method (CVM) to design the household surveys and uses the first-hand data obtained from surveys to estimate the interruption costs of different electrical appliances with various control modes.
The rest of this article is structured as follows. Literature Review presents a brief review of previous studies on measuring the value of constant electricity supply, particularly the WTA and Willingness to Pay (WTP) methods. In Methodology, the concepts and techniques relevant to the approach developed in this study are specified. In Sample and Data, we outline the sample and empirical data obtained from the survey on urban households of Xi’an City, China. The empirical results are presented in Empirical Results, where we discuss the costs of households’ WTA to give up using specific electrical appliances under different scenarios of electricity interruptions. Finally, we conclude and provide policy implications.
Literature Review
Interruption costs represent the economic consequences of service curtailments to the customer when the demand for electricity temporarily exceeds the available supply capability (Munasinghe, 1988). To empirically measure the costs of DSM, empirical studies have usually segmented consumers into groups, such as residential, industrial, and agricultural. For industrial and commercial sectors, a generally used approach for measuring the outage costs is to estimate “production functions” for customers on the basis of aggregate electricity consumption and added value data by industrial sector. The outage costs of industrial customers can be approximately estimated following such a function (Zachariadis and Poullikkas, 2012). However, for the residential sector, the welfare loss includes not only elements such as consumable goods but also costs derived from less leisure, inconvenience, or discomfort, which cannot be observed in the market (Munasinghe, 1980). Moreover, for residential consumers, the value of each kilowatt-hour can be different since it can be used for different appliances and therefore brings different utilities to the customer (Dubin and McFadden, 1984). Hence, to measure the interruption costs of residential customers, a method that accounts for different electricity needs across households is required.
Given that the value of using appliances at the household level cannot be directly captured through market signals, stated preference techniques such as questionnaires are often used to extract the information on interruption costs (Munasinghe, 1980; Billinton et al., 1987; Billinton and Pandey, 1999). As one of the popular survey-based stated preference techniques, the CVM explores the marginal utility from a change in consumption of specific non-market goods by directly inquiring after households’ WTP or WTA (Venkatachalam, 2004). WTP is the maximum amount of money a household is willing to pay for a marginal decrement of service reliability, while WTA responds to the minimum amount a household would be willing to accept to a marginal increment in service reliability. Either WTP or WTA studies can provide evidence on which aspects of service quality are important to customers and what value customers would place on various service attributes.
The methods of WTP or WTA, by analyzing how respondents trade off attributes against cost, have been generally used to obtain money measures of welfare changes due to changes in the availability of public goods or amenities. There have been wide debates on the apparent empirical anomaly of WTA and WTP compensations. It has been widely agreed that if a good has a value that is small relative to income, the WTP to obtain it should be close to the WTA to give it up (Kolstad and Guzman, 1999). Meanwhile, there is considerable evidence on a divergence between WTA and WTP, with announced WTA significantly in excess of announced WTP, while the difference could be as high as 3–5 times (Hanemann, 1991; Horowitz and McConnell, 2002).
There are two primary theoretical arguments for the divergence between WTA and WTP. One involves the “endowment effect” theory, which suggests that the value of a loss differs from the value of a gain, even if the loss or gain is less than the income (Thaler, 1980). In other words, when the good or service becomes one’s endowment, one would place a higher value on it, and thus, WTA will be larger than WTP. Hanemann (Hanemann, 1991) provided the other explanation for the divergence between WTA and WTP in terms of public goods. He argues that the divergence depends on not only the income effect but also the substitution effect, and the latter would be far more powerful than the former; moreover, because the market substitutes for a public good are not readily available, it is impossible to compensate for its removal, and the WTA is infinite whereas the WTP is finite. If a low-cost market good as the perfect substitute is present, the WTA would be equal to the WTP.
Venkatachalam (Venkatachalam, 2004) concluded that the WTP estimates are more reliable since they are close to the true values. Carson et al. (Carson et al., 2001) argued that Hicksian consumer surplus measures (i.e., the WTA estimates) are the appropriate measure for assessing the CVM results. Carson et al. (Carson et al., 2003) further suggested that whether WTP or WTA estimates are based can be determined by ownership of the goods—WTA is the appropriate measure if respondents believe they possess the property right.
Households’ utility evaluation on constant electricity supply varies with the time of using, since their electricity demand varies with hour, day, and season (Torriti, 2012; Campillo et al., 2016). Therefore, the value of electricity outages may be characterized by inherent attributes and associated scales such as the frequency, duration, or magnitude (such as direct interruption, partial interruption, or voltage disturbance) of interruptions, whether the interruption is at night/on the weekend, and whether there is an advanced notice (Caves et al., 1990; Billinton and Pandey, 1999; Sullivan et al., 2009; Morrissey et al., 2018). Short interruptions such as 1–5 min would incur very low cost so that most households would rather “sit out” the inconvenience (Munasinghe, 1980). Households value different characteristics of power outage and in particular prefer not to change to another power outage profile (Pepermans, 2011). Customers value incurring fewer and shorter outages; if an outage must occur, outages during the day on weekdays are preferred (Hensher et al., 2014).
Empirical evidence shows that households have heterogeneous preferences regarding electricity outage attributes, depending on attitude, perception, experience, socio-demographic characteristics (age, gender, income, family size, educational attainment, and household population composition such as babies and old people), and housing features such as the type, size, and ownership (Billinton and Pandey, 1999; Layton and Moeltner, 2005; Pepermans, 2011; Morrissey et al., 2018). Lack of information on how households heterogeneously value constant electricity supply can lead to sub-optimal investment decisions, which has a disproportional impact on customer groups (Morrissey et al., 2018).
Methodology
We use a sample obtained from a face-to-face CVM survey on urban households of Xi’an City in China to investigate the customers’ cost of interruption. Our CVM survey instrument was developed over a 10-month period study before the formal interview based on the trial interviews with the focus group and pilot surveys. Key design issues for this study included the valuation scenario, the elicitation method, and payment methods. In this section, we first discuss in detail the specification on the hypothetical program and then establish the model for estimating values of constant electricity supply.
Design of Hypothetical Program
Bid Pattern
In order to reveal the ‘true’ valuation of households on the goods and services being assessed, CVM-based studies typically offer respondents with open-ended or closed-ended questions, either of which involves various payment choices such as the payment card (PC), the single-bounded dichotomous choice (SDC), and the double-bounded dichotomous choice (DDC). The PC pattern means to provide respondents with a series of payment amounts to choose from. The WTP/WTA technique is to directly ask the maximum/minimum amount that respondents would be willing to pay for the program in question. The SDC asks only once to cast a simple “yes” or “no” vote for a predetermined value of payment. A positive response implies that the true WTP is larger than that value, while a negative response means a smaller WTP than that value.
As one of the commonly used CVM techniques, the DDC is developed based on SDC and is increasingly mature (Bishop and Heberlein, 1979; Hanemann et al., 1991). The DDC-based survey asks respondents twice. They are first asked to cast a “yes” or “no” answer for whether they would be willing to accept an initial compensation amount. For the second question, those who have provided a positive response to the first question would be provided with a set of smaller compensation values to choose, while those who have provided a negative response would be provided with a set of larger values to choose. As Carson et al. (Carson et al., 2001) pointed out, the DDC survey is incentive-compatible, since it only asks a simple “yes” or “no” question, and this type of dichotomous choice pattern is very close to respondents’ decision-making behavior in the market. Compared to the PC and open interval bid techniques, the DDC allows the heterogeneous respondents to vote on a fixed amount of compensation, which helps to avoid the estimation bias. Compared with the SDC, the DDC is a typical “take-it-or-leave-it” problem and can more effectively approximate the true WTA, improving the evaluation efficiency (Hanemann et al., 1991). We applied the DDC techniques in the survey.
Target Terminals
Assuming availability of the smart grid technologies that enable point-to-point controlling of electricity terminals at the household level, our empirical study takes household air conditioners (ACs) and electric kettles (EKs) as the typical terminals on interruption management. The reason is that they are representative of different load characteristics and important in shaping the electricity peak. The air-conditioning load has become the main driving force of summer load peaks in the urban areas, accounting for 34% of the peak load in China (Wang et al., 2008). Its load is characterized by long duration, high power, and poor substitution. In particular, the load of ACs often abruptly increases with the temperature increasing, which makes it hard to predict and manage the load in advance.
The kettle is one of the most used appliances in China. According to our survey, more than 60% of Chinese households own a kettle. Although the kettle is a lower electricity consumer than ACs, it is one of the appliances that has the highest wattage and requires the highest current when switched on (McKenna and Thomson, 2016). Murray et al. (Murray et al., 2016) showed that kettle usage patterns are regular at peak times (morning and evening around dinner); due to the spiky nature of its demand, the kettle can significantly influence electricity generation and the power distribution network. Meanwhile, EKs have sound nature of demand response, since their electricity load can be easily adjusted by switching to the substitutes.
Hypothetical Interruption Program
Suppose that households value electricity consumption in peak hours more than that in the off-peak hours. 18:30–23:00pm every day during the period from July to September is the peak of the residential electricity consumption of Xi’an City; therefore, the time slots between 18:30–23:00 during the summer electricity peak were taken as the hypothetical time to conduct interruptions. Households’ utility of using electrical appliances may be associated with the control intensity (Caves et al., 1990; Ozbafli and Jenkins, 2015; Broberg and Persson, 2016). The typical length of control time may be transient (no more than 5 min), medium (30 min or 1 hour), and long (2 h or over). According to the load characteristics of Xi’an City and the requirements of DSM, the direct control scheme was assumed to be an interruption of 30 min (or 60 min), with no more than five interruptions per summer.
Advance Notice and Voluntary Participation
Smart grid technologies can also notify consumers ahead of each arrival of the electricity peak and load control, hence reducing the inconvenience of DSM to households. Caves et al. (Caves et al., 1990) and Mcfadden et al. (Mcfadden et al., 1988) showed that the WTP/WTA estimates with an advance notice would be lower than the estimates in absence of notice. Meanwhile, compared to voluntary participation in a control program, the estimates under a mandatory scenario would be larger (Caves et al., 1990). In order to reduce the negative impact on households, our survey specified the load control pattern to be with advance notice and voluntary participation.
Payment Instruments
To avoid ambiguity, the CVM requires the compensation payment tools of the program in question to be available and familiar to the interviewed households. Typical payment tools include tariff and tax. In CVM studies, an additional fixed amount of fee or a proportion of the electricity bill has been widely used (Munasinghe, 1980; Billinton et al., 1987). The payment term and pattern also matter for households’ WTP/WTA. Compensation by long-term payment brings uncertainty to households in terms of payment commitment, and hence, respondents will discount on future pay-outs (Carson et al., 2003). Carson et al. (Carson et al., 2003) preferred lump-sum payment with fixed amount, as the median value of WTP/WTA to lump-sum payment can be as twice as high as the median of multi-period payment, and long-term payment would lead to re-contracting problems. Our pilot survey shows that over 90% of the respondents were suspicious of the commitment on multi-period payment. In our pilot survey, the compensation was specified to be lump-sum payment with fixed amount which was deducted from the household electricity bill of that summer.
Choice Between WTP and WTA
Our study uses the WTA method. Billinton and Pandey (Billinton and Pandey, 1999) concluded that stable and reliable electricity services have been widely regarded by consumers as one of their social rights. This is confirmed by our field test and pilot surveys which found that the majority of respondents tend to offer a provocative bid against the WTP questions, and 91% of the respondents stated that “the grid is obligated to provide stable services of electricity.”
Based on the pilot surveys, reasonable ranges of AC bids and EK bids were ¥1–100 and ¥1–50, respectively. Our questionnaire provided respondents with eight sets of values for AC interruptions and four sets of values for EK interruptions. Table 1 shows the bid value sets for the study, which is in a typical double-bounded dichotomous choice (DDC) format. The distribution of bids was obtained through pilot studies.
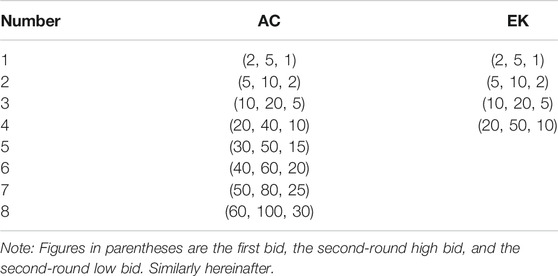
TABLE 1. WTA bid values (¥, Chinese yuan).
For example, in (2,5,1), 2 is the first bid, five is the second-round high bid, and one is the second-round low bid. The respondents were first asked: “Assume a 30 min outage of air conditioning to your household between 18:30–23:00 on certain day in this August, with no other appliances of your household being affected, would you be willing to accept a compensation of ¥2 for the outage?” If the respondents said “yes,” they were asked whether they accepted ¥1 (the second-round low bid): “Would you be willing to accept a compensation of ¥1 for the outage?” In contrast, if the respondents said “no,” they were asked whether they accepted ¥5 (the second-round high bid): “Would you be willing to accept a compensation of ¥5 for the outage?”
If the answer was “yes-no”, the respondent’s WTA of the interviewee was between ¥2 and ¥5. If the answer was “yes-yes,” then the respondent’s WTA was below ¥1. Based on the above, we use the maximum likelihood estimation method (Modelling Value of Constant Supply) to obtain the mean WTA of the interviewees. DDC asked the respondents twice, while the second question was based on the response of the first question. To reduce the initial anchoring effect and systematic bias in the DDC estimation, these sets of bid values were randomly assigned to the questionnaire (Cameron, 1988). That is, for air conditioners, the questionnaires were divided into eight types (according to Table 1), and each had different bid groups (starting points). For example, respondents of type A would answer questions from the group (2,5,1), and those of type B would answer from (5,10,2). Meanwhile, the questionnaires were distributed to each interviewer based on random software during the survey.
Modeling Value of Constant Supply
Two types of models can be used for DDC estimation: the utility difference model (UDM) proposed by Hanemann (Hanemann, 1984) and the expenditure difference model (EDM) proposed by Cameron (Cameron, 1988). Compared to the former, the latter makes more efficient use of the information in dichotomous CVM questions and is easier to estimate (Cameron, 1988). This study employs the EDM. Suppose when other conditions remain unchanged, an individual’s WTA to changes in quality of goods or services is the difference in his expenditure (also called compensation variation), then
where
where
where
Similarly, the probability that individual
Function 3) can be estimated using the maximum likelihood (ML) method; the log maximum likelihood function is as follows:
where
With the estimates obtained from Function (6), the sample median WTA can be estimated using Eq. 8, where
Sample and Data
The formal face-to-face survey on urban households of Xi’an City in China was conducted in August 2020 following the stratified and random sampling method. In each household, a member who was aged 18 and over, able to respond, understood how to use the household’s appliances, and knew the household’s electricity consumption situation was randomly assigned as the respondent. The average visit time for each household was 35 min. By data cleaning, we obtained a sample of 545 observations for the air conditioner control (356 households have electric kettles). The questionnaire was divided into two parts. In the first part, we specified the hypothetical program on the base of focus interviews and pilot surveys. The survey followed the contingent valuation method (CVM) and the survey guideline proposed by Welsh and Poe. (Cameron, 1988; Welsh and Poe, 1998), providing respondents with information about a hypothetical program that would reduce the likelihood of a future adverse environmental event. According to the load characteristics of the Xi’an City grid, the control program was described as an interruption of 30 min (or 60 min) between 18:30–23:00 pm of the summer peak during the period from July to September, with the interruptions per period being no more than five times. The participants would be informed of an interruption in advance. The electricity terminals on direct control include air conditioners (ACs) and electric kettles (EKs). Each respondent only faced the hypothetical program of controlling one of the two terminals. Respondents were asked to provide their WTAs for participation in the program. The compensation for interruption would be a lump-sum deduction from the summer electricity bill. The bid mode of DDC was employed to obtain households’ WTA. The second part of the questionnaire aimed to collect the information of household socio-demographic characteristics and individual energy-saving attitudes.
Households’ WTA in terms of electricity consumption may be affected by economic and demographic factors, housing attributes and location, and individual attitudes (Wilson et al., 2015). Table 2 reports the statistical description of the variables that are proposed to affect households’ WTA.

TABLE 2. Summary statistics.
In terms of electrical appliances, 91.3% of the households had air conditioners, with over 48% having more than two sets. The temperature of air conditioning on average was set to 24.82°C, and the average daily use in summer was only 7.45 h. Only 1% of the households were used to setting the temperature above 28°C, with an average daily use of 1.9 h. 65.32% of the households had electric kettles, with a daily usage of 2.99 times. Estimated number of outages experienced over the past year was 2.67 times.
In terms of demographic characteristics, the average age of respondents was 43.30, and 51.93% had a full-time job. 49% of the respondents are male. The average household size was three members, with one member having attained a university degree. On average, a household had 0.15 babies aged under 3 years old and 0.57 old people aged over 70 years old. The mean of the household income was located around ¥60,000 per year.
81% of the households owned the house, while 27% lived with welfare housing. Welfare housing means that the house is provided by the organization one works for. The organizations that can provide housing are usually government organs or state-owned enterprises, while the purchase prices of welfare housing are generally far below the market prices. On average, the residential buildings in the survey were constructed in the 1990s, and the average size per household was 111.18 square meters. In terms of attitudes and behavior, over 80% of the respondents claimed that the electricity tariffs were acceptable, and most consumers tended to be energy saving.
The survey also investigated households’ daily routines and life styles. Table 3 displays the time distribution of residents staying at home between 18:30–23:00 pm during the period of the summer electricity peak. From 18:30 to 19:00, 31.2% of the households were unoccupied. The proportion of staying at home increased with progression of the day, with a proportion of around 79.1% between 19:30 and 20:00 and over 97.0% after 22:00. On average, during the summer peak hours of electricity, the duration of staying at home was 3.92 h.

TABLE 3. Time distribution of staying at home in the summer electricity peak hours.
Empirical Results
Influencing Factors of WTA
Table 4 reports the ML estimates of Model (3), respectively, in the case of AC and EK interruptions.

TABLE 4. Estimation results of Model (3), under different interruption scenarios.
On the control of the air-conditioning load, the age of the respondent (Age) has significantly negative correlation with WTA. This implies that the older the members of the household, the lower the household’s reported WTA, which is consistent with Sullivan and Vardel’s conclusion (Sullivan et al., 1996). Gender appears to have no significant effect on the control of the air-conditioning load. Billinton and Pandey (Billinton and Pandey, 1999) provided empirical evidence that gender cannot explain the difference in values of electricity services. That is, there is no gender difference when facing long-time interruption, and the resulted inconvenience from a strong electricity control is tolerable for neither women nor men.
Our findings on the AC interruption reveal that income does not show a significant impact on households’ WTA, except for the high-income group (above ¥300, 000, Income_5) in the case of 60-min AC interruption, which is consistent with the theoretical prediction revealed by Flores and Carson (Flores and Carson, 1997). We find little evidence that family size (Familysize) is associated with households’ WTA of load control, which is consistent with the conclusion of Layton and Moeltner (Layton and Moeltner, 2005). We also find no evidence that education (Education) is related to WTA, which is consistent with the findings of Peters (Peters, 1990) and Ritchie and McDougall (Ritchie and McDougall, 1985) that education does not play a role in energy consumption behavior. As Stern (Stern, 1992) noted, people of a high education level may have strong environment awareness and concept, but transforming attitudes into actions is affected by many factors.
Whether households have special populations has been a hot topic in studies on energy consumption. Many empirical research studies have provided evidence that babies are sensitive to outages (Peters, 1990; Sullivan et al., 1996; Sullivan et al., 2009), which implies that households with babies are more likely to value constant electricity supply. Our findings confirm this statement: in both cases of AC interruption, the number of babies (Baby) significantly increases the WTA values; the effect becomes stronger when interruption duration becomes longer. We find having aged people in families (Old) is not related to WTA values in terms of AC load control. This result can be interpreted by the cultural context and the health concept of elderly Chinese people. Many old people interviewed said that wind from air conditioning is unnatural and not healthy. This type of cognition about air conditioning is close to that of the Japanese old (Yamamoto et al., 2008).
For the remaining socio-demographic factors, there is no significant association between building age (Houseage), dwelling size (Dwellingsize), and welfare housing (W_house) and WTA. The building’s characteristics do not show strong predicting power for WTA. The respondent’s feelings about the electricity price level can negatively affect WTA values in the case of 30-min interruption (Feelp_3). In terms of the behavior of energy saving (Selfscore), we do not find strong evidence of the potential correlation between this factor and WTA.
In terms of the AC use pattern, the number of air conditioner sets (ACnum) is not significant, while the length of using time and temperature setting appear to be powerful predictors for WTA values, since their estimates in either interruption durations is negative at the 1% or 5% significance level. The negative parameters imply that the value of WTA increases as the temperature set of air conditioners (ACtem) decreases. The value of WTA increases as the length of using time (ACusetime) increases. Obviously, the households relying more on cooling service would put a higher value on constant electricity supply. The number of outages experienced over the past year has no significant effect on WTA, which is consistent with the research of Baik et al. (Baik et al., 2020).
The estimation results about EK interruptions are shown in the right-hand panel of Table 4. The frequency of EK use (EKfre) is positively correlated with WTA. The respondent’s age can positively affect WTA values in the case of 30-min interruption and 60-min interruption. Hours staying at home (Hometime) during peak time are also positively related to WTA. The number of old people (Old) is positively correlated with WTA. The respondent’s feelings about the electricity price level can negatively affect WTA values in the case of 60-min interruption (Feelp_2 and Feelp_3).
In summary, as far as supply interruptions to air conditioning are concerned, significant predictors for households’ WTA are age, the number of babies, the length of using time, and the temperature setting of air conditioners, no matter whether the duration of interruption is 30 min or 60 min. For EK interruptions, the powerful predictor is use frequency of EKs, hours staying at home during peak time, and respondent’s age, irrespective of whether the duration of interruption is 30 min or 60 min. The difference in terms of influence factors of WTA or impact size between two types of electrical appliances can be attributed to the differences in load characteristics and the substitution. Because of these differences, it is possible to use smart grid technology to conduct differentiation management on different terminal electricity equipment.
WTA Estimates and Distribution
Median WTA and Aggregate WTA
Using the estimated parameters and observed values of the sample, we estimate the sample average of WTA. Specifically, we substitute the sample average values of influencing factors into Function 8) to calculate the median WTA value under alternative scenarios. The result is depicted in Table 5. In the case of air conditioning, an interruption of 30 min (AC_D30) and 60 min (AC_D60), respectively, generates a median WTA of ¥2.91 and ¥6.75. That is, when control intensity doubles, the WTA estimate would, on average, increase by two times.
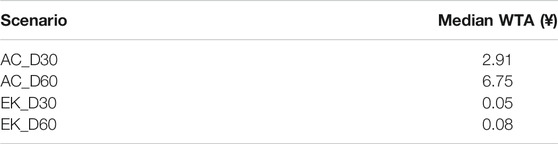
TABLE 5. Median WTA.
In contrast, households put a much lower value on constant electricity supply to EKs. For an interruption of either 30 min (EK_D30) or 60 min (EK_D60), the median WTA value stays at around ¥ 0.06. This is quite meaningful, indicating that electric kettles are much suitable as the terminal of direct load control, since its interruption would not incur large welfare loss to consumers. More importantly, while use of electric kettles usually generates large, frequent, and random disturbances to the power grid, it can be easily substituted (for instance, by gas stoves). Hence, taking EKs as the target terminal may also bring grid companies significant benefits in terms of stable operation.
Accumulative Distribution of WTA
In addition to the total welfare losses caused by supply interruption intervention, the distribution of WTAs and the household characteristics that are related to the distribution are equally important for effective load management. We calculate the WTA value of an individual household by using its characteristic information. On the basis of that, we calculate the cumulative distribution of WTA values, as shown in Figure 1.
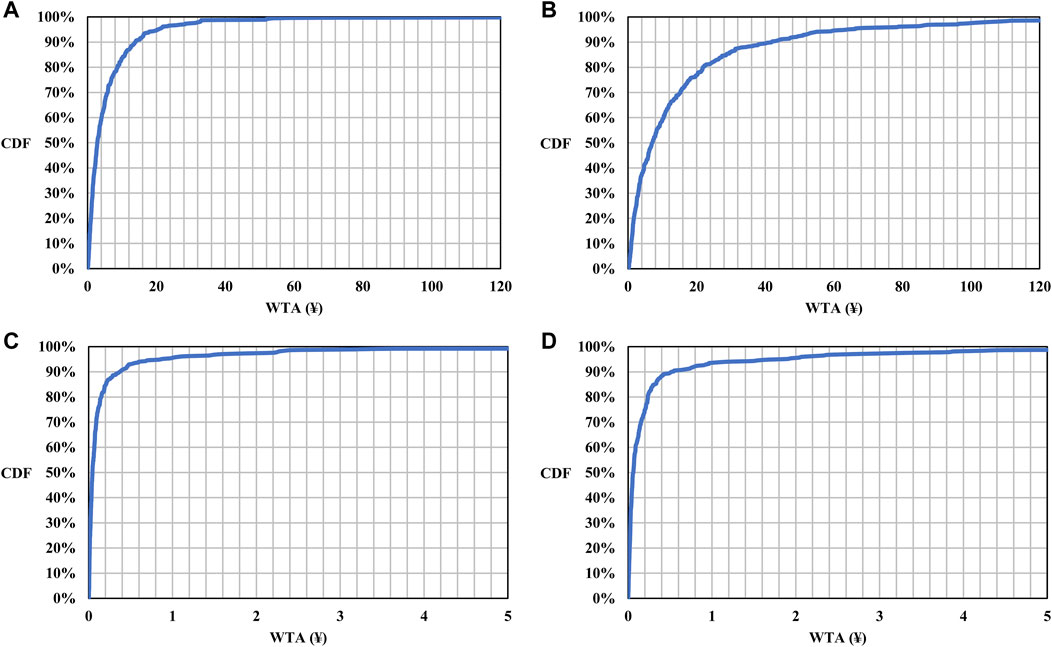
FIGURE 1. Cumulative distribution of WTA for interruptions. (A) AC_D30. (B) AC_D60. (C) EK_D30. (D) EK_D60. Notes: (i) the horizontal axis is the WTA values and the vertical axis is the cumulative probabilities. (ii) For AC interruptions, extreme WTA values that are larger than ¥100 have been deleted from the figures, composed of two observations for D30 and 14 observations for D60. (iii) For EK interruptions, extreme WTA values that are larger than ¥5 have been deleted from the figures, composed of two observations for D30 and observations for D60.
Figure 1A and Figure 1B show the cumulative distributions of WTA for the AC interruptions. Given the same WTA value, as the interruption duration increases from 30 to 60 min, the proportion of households would agree to participate in the interruption management significantly decreases. When the interruption duration is 30 min, 91% of the households would participate if the compensation is ¥15; the participation rate slightly increases to 96% if the compensation increases to ¥25. When interruption duration is 60 min, about 70% of households would participate with a compensation of no more than ¥15; the proportion slightly increases to 82% if the compensation increases to ¥25. Most households would be willing to accept an air-conditioning interruption, even when the compensation is low. When compensation is already high (for instance, ¥15 in the case of 30-min interruption), a further increase only generates a minor increase in households’ participation rate, implying the decreasing marginal effect of monetary compensation. The traditional instruments of DSM are usually unified for all households and therefore costly. Our results show that peak electricity consumption of household air conditioning can be effectively reduced at low cost, by directly managing the ACs of demand response–sensitive households.
Figure 1C and Figure 1D are the cumulative distributions of WTA in the case of EK interruptions. Around 93% of households have a WTA value of less than ¥1, no matter whether the interruption duration is 30 min or 60 min; however, to further improve the participation rate to nearly 100%, the WTA value needs to be raised to more than ¥20.
Participation Without Compensation
The factors affecting residential electricity consumption are complex and diverse. It is usually difficult to achieve the given target of peak load regulation by simple economic incentives in a cost-effective manner. The peak consumption of the residential sector typically has the characteristics of congestion, and therefore, its optimal management requires the collective efforts of the market, government, and society. In this context, we explored the possibility of participating in peak-shaving without compensation in response to a “social call.” The questionnaire asked the respondents the willingness of non-paid participation regarding the 30-min and 60-min interruptions. In the case of air conditioning, 80.6% of the respondents, respectively, show that they would be willing to participate in the 30-min interruption program, while 75.2% would be willing to participate in the 60-min program. In the case of electric kettles, the voluntary participation rate is 89.4 and 88.0%, respectively. The results imply the huge potential of improving households’ participation in DSM in the presence of non-economic incentives.
However, voluntary participation motivated by non-market incentives can also be affected by many other factors, such as benefits of non-paid participation. While an individual’s utility may be increased by the collective participation, the benefits would be shared by the society, and the individual has to take on the cost of participation (such as discomfort and inconvenience due to the supply interruption), which means the typical negative externality problem would emerge (O'Hare et al., 1983). Frey et al. (Frey et al., 1996) noted that in the long term, participation which only relies on “moral calling,” propaganda, and education is hard to maintain. Accordingly, even if a large number of households would be “willing to participate without any compensation,” this kind of participation behavior may be unsustainable. To fully mobilize the demand side to participate in load management, the effective combination of economic and social incentives should be considered.
Discussion and Conclusion
The effective measures of power demand control with smart grid DSM technology should target the specific customers. In order to identify the target groups well, the end use of the DSM has to be carefully identified. This article estimated the distribution of households’ WTA for voluntary interruptions and explored the heterogeneous, by taking ACs and EKs as typical electricity terminals.
We come to four conclusions. First, given the same compensation value, as the interruption duration increases from 30 to 60 min, the voluntary participation rate of the interruption management significantly decreases, and the participation rate significantly varies with types of the appliances on control. Second, most households would be willing to accept the supply interruption even if the compensation amount would be low. When the amount of compensation increases to a certain high level, a further increase in compensation could only generate minor increment in participation willingness. Third, influence factors of the WTA and the influence sizes would vary with the type of appliances that are on interruption management. Finally, household characteristics have significant impacts on the WTA. For interruptions to air conditioning, powerful predictors for WTA are age, the number of babies, the length of using time, and the temperature setting of air conditioners. For EK interruptions, the powerful predictors are use frequency of EKs, hours staying at home during peak time, and respondent’s age.
Households’ electricity consumption is determined not only by economic incentives but also the society context and individual characteristics. Traditional grid regulation methods distinguish only between sectors such as industrial and residential customers, calculating the cost and benefit of grid regulation based on the average load of sectors. As Thogersen et al. (Thogersen and Gronhoj, 2010) noted, household customers can be aware of energy saving under the effect of psychological factors. Applying the management measures with the same cost to different customer groups would generate completely opposite effects. The point is to differentiate terminal markets according to households’ characteristics and the WTA distribution on different terminals and accurately lock on the target of load control, hence finding out the most effective means of regulation. Thus, the welfare losses due to load control can be minimized and the demand-side response can be improved.
The value of WTA reflects the welfare level of the household by using electrical appliances and also the cost of DSM (such as load interruption) of the grid. The main advantage of the survey method is in enabling the availability of the dataset that carries the information of the household’s heterogeneity in terms of WTA. Information on the household’s WTA of electricity outages and the heterogeneity at the household level can serve many purposes. For instance, it may help grid companies to design a cost-effective scheme of DSM reducing the welfare loss of the consumers. It can be used to decide on which sectors or customer groups can be cut off with a minimum cost when power shortages occur (Morrissey et al., 2018)). Capturing the heterogeneity makes it possible to conduct differentiation control according to the sensitiveness of demand response.
To conclude, first, our analysis reveals the heterogeneity in consumers’ preference for electrical appliances in the summer peak, providing the justification for intelligent control of electricity load based on the differentiated interruption value. Specifically, the traditional DSM method simply cuts off the household electricity during load peaks, while the intelligent interruption performs the marginal control on those electricity-intensive appliances of a household. In other words, the intelligent interruption based on consumer heterogeneity enables a weaker load control and improved consumer welfare. Second, the differentiated pricing for household electricity is needed for the intelligent interruptible mechanism to be practicable and valid. The electricity industry of China has been strictly regulated for a long time, including the pricing. The pricing mechanism needs to be more flexible to match the future needs of intelligent control of electricity. Third, the intelligent interruption control in our discussion takes the smart and reliable network as the precondition, implying that the electricity network infrastructure needs to improve to enable the intelligent control on household load terminals. This contributes not only to the investment for smart meters and other information-delivering technologies but also to the transformation of electricity management toward a more deregulated and more information-based pattern.
Data Availability Statement
The raw data supporting the conclusions of this article will be made available by the authors, without undue reservation.
Author Contributions
Contributions of the authors to this article are as follows: YZ, design of the study, conceptualization, original draft preparation, review, and editing; WY, validation; DG, programming and data analysis; XH, survey conduction, data collection, visualization, and supervision.
Funding
This research was funded by the National Natural Science Foundation of China (grant number 71573217) and by the Shaanxi Soft Science Research Program (grant number 2015KRM143).
Conflict of Interest
The authors declare that the research was conducted in the absence of any commercial or financial relationships that could be construed as a potential conflict of interest.
Publisher’s Note
All claims expressed in this article are solely those of the authors and do not necessarily represent those of their affiliated organizations, or those of the publisher, the editors, and the reviewers. Any product that may be evaluated in this article, or claim that may be made by its manufacturer, is not guaranteed or endorsed by the publisher.
Acknowledgments
Authors are expressing thanks for the funding from the National Natural Science Foundation of China and from the Shaanxi Soft Science Research Program.
References
Baik, S., Davis, A. L., Park, J. W., Sirinterlikci, S., and Morgan, M. G. (2020). Estimating what Us Residential Customers Are Willing to Pay for Resilience to Large Electricity Outages of Long Duration. Nat. Energ. 5 (3), 250–258. doi:10.1038/s41560-020-0581-1
Billinton, R., and Pandey, M. (1999). Reliability Worth Assessment in a Developing Country-Residential Survey Results. IEEE Trans. Power Syst. 14 (4), 1226–1231. doi:10.1109/59.801877
Billinton, R., Wacker, G., and Subramaniam, R. K. (1987). Factors Affecting the Development of a Residential Customer Damage Function. IEEE Trans. Power Syst. 2 (1), 204–209. doi:10.1109/tpwrs.1987.4335101
Bishop, R. C., and Heberlein, T. A. (1979). Measuring Values of Extramarket Goods: Are Indirect Measures Biased? Am. J. Agric. Econ. 61 (5), 926–930. doi:10.2307/3180348
Broberg, T., and Persson, L. (2016). Is Our Everyday Comfort for Sale? Preferences for Demand Management on the Electricity Market. Energ. Econ. 54, 24–32. doi:10.1016/j.eneco.2015.11.005
Cameron, T. A. (1988). A New Paradigm for Valuing Non-market Goods Using Referendum Data: Maximum Likelihood Estimation by Censored Logistic Regression. J. Environ. Econ. Manag. 15 (3), 355–379. doi:10.1016/0095-0696(88)90008-3
Campillo, J., Dahlquist, E., Wallin, F., and Vassileva, I. (2016). Is Real-Time Electricity Pricing Suitable for Residential Users without Demand-Side Management? Energy 109, 310–325. doi:10.1016/j.energy.2016.04.105
Carson, R. T., Flores, N. E., and Meade, N. F. (2001). Contingent Valuation: Controversies and Evidence. Environ. Resource Econ. 19 (2), 173–210. doi:10.1023/A:1011128332243
Carson, R. T., Mitchell, R. C., Hanemann, M., Kopp, R. J., Presser, S., and Ruud, P. A. (2003). Contingent Valuation and Lost Passive Use: Damages from the Exxon Valdez Oil Spill. Environ. Resource Econ. 25 (3), 257–286. doi:10.1023/a:1024486702104
Caves, D. W., Herriges, J. A., and Windle, R. J. (1990). Customer Demand for Service Reliability in the Electric Power Industry: a Synthesis of the Outage Cost Literature. Bull. Econ. Res. 42 (2), 79–121. doi:10.1111/j.1467-8586.1990.tb00294.x
Corbett, J., Wardle, K., and Chen, C. (2018). Toward a Sustainable Modern Electricity Grid: the Effects of Smart Metering and Program Investments on Demand-Side Management Performance in the US Electricity Sector 2009-2012. IEEE Trans. Eng. Manage. 65 (2), 252–263. doi:10.1109/TEM.2017.2785315
Dubin, J. A., and McFadden, D. L. (1984). An Econometric Analysis of Residential Electric Appliance Holdings and Consumption. Econometrica 52 (2), 345–362. doi:10.2307/1911493
Fan, L., Li, X., Chen, Y., Chen, Y., and Zhou, R. (2016). Pricing Model of Bidirectional Peak-valley for Motivating CCHP to Participate in DSM. Power Syst. Prot. Control. 44 (17), 45–51. doi:10.7667/PSPC151566
Flores, N. E., and Carson, R. T. (1997). The Relationship between the Income Elasticities of Demand and Willingness to Pay. J. Environ. Econ. Manag. 33 (3), 287–295. doi:10.1006/jeem.1997.0998
Frey, B. S., Oberholzer-Gee, F., and Eichenberger, R. (1996). The Old Lady Visits Your Backyard: A Tale of Morals and Markets. J. Polit. Economy 104 (6), 1297–1313. doi:10.2307/213894010.1086/262060
McFadden, D. L., Woo, C.-K., and Goett, A. A. (1988). Estimating Household Value of Electrical Service Reliability with Market Research Data. Energy J. 9, 105–125. doi:10.5547/ISSN0195-6574-EJ-Vol9-NoSI2-7
Hanemann, M., Loomis, J., and Kanninen, B. (1991). Statistical Efficiency of Double‐Bounded Dichotomous Choice Contingent Valuation. Am. J. Agric. Econ. 73 (4), 1255–1263. doi:10.2307/1242453
Hanemann, W. M. (1991). Willingness to Pay and Willingness to Accept: How Much Can They Differ? Am. Econ. Rev. 81 (3), 635–647.
Hanemann, W. M. (1984). Welfare Evaluations in Contingent Valuation Experiments with Discrete Responses. Am. J. Agric. Econ. 66 (3), 332–341. doi:10.2307/1240800
Hensher, D. A., Shore, N., and Train, K. (2014). Willingness to Pay for Residential Electricity Supply Quality and Reliability. Appl. Energ. 115, 280–292. doi:10.1016/j.apenergy.2013.11.007
Horowitz, J. K., and McConnell, K. E. (2002). A Review of WTA/WTP Studies. J. Environ. Econ. Manag. 44 (3), 426–447. doi:10.1006/jeem.2001.1215
Kolstad, C. D., and Guzman, R. M. (1999). Information and the Divergence between Willingness to Accept and Willingness to Pay. J. Environ. Econ. Manag. 38 (1), 66–80. doi:10.1006/jeem.1999.1070
Langendahl, P.-A., Roby, H., Potter, S., and Cook, M. (2019). Smoothing Peaks and Troughs: Intermediary Practices to Promote Demand Side Response in Smart Grids. Energ. Res. Soc. Sci. 58, 101277. doi:10.1016/j.erss.2019.101277
Layton, D. F., and Moeltner, K. (2005). “The Cost of Power Outages to Heterogeneous Households,” in Applications of Simulation Methods in Environmental and Resource Economics. Editors R. Scarpa, and A. Alberini (Dordrecht: Springer Netherlands), 35–54.
McKenna, E., and Thomson, M. (2016). High-resolution Stochastic Integrated thermal-electrical Domestic Demand Model. Appl. Energ. 165, 445–461. doi:10.1016/j.apenergy.2015.12.089
Morrissey, K., Plater, A., and Dean, M. (2018). The Cost of Electric Power Outages in the Residential Sector: A Willingness to Pay Approach. Appl. Energ. 212, 141–150. doi:10.1016/j.apenergy.2017.12.007
Munasinghe, M. (1980). Costs Incurred by Residential Electricity Consumers Due to Power Failures. J. Consum Res. 6 (4), 361–369. doi:10.1086/208779
Munasinghe, M., and Sanghvi, A. (1988). Reliability of Electricity Supply, Outage Costs and Value of Service: An Overview. Ej 9, 1–18. Special Issue on Electricity Reliability. doi:10.5547/ISSN0195-6574-EJ-Vol9-NoSI2-1
Murray, D. M., Liao, J., Stankovic, L., and Stankovic, V. (2016). Understanding Usage Patterns of Electric Kettle and Energy Saving Potential. Appl. Energ. 171, 231–242. doi:10.1016/j.apenergy.2016.03.038
O'Hare, M., Bacow, L., and Sanderson, D. (1983). Facility Siting and Public Opposition. New York: Van Nostrand-Reinhold.
Ozbafli, A., and Jenkins, G. P. (2015). The Willingness to Pay by Households for Improved Reliability of Electricity Service in North Cyprus. Energy Policy 87, 359–369. doi:10.1016/j.enpol.2015.09.014
Pepermans, G. (2011). The Value of Continuous Power Supply for Flemish Households. Energy Policy 39 (12), 7853–7864. doi:10.1016/j.enpol.2011.09.032
Peters, J. S. (1990). “Integrating Psychological and Economic Perspectives of Thermostat Setting Behavior,” in Proceedings of the American Council for an Energy-Efficient Economy (American Council for an Energy Efficient Economy), 111–119.
Ramchurn, S. D., Vytelingum, P., Rogers, A., and Jennings, N. R. (2012). Putting the 'smarts' into the Smart Grid. Commun. ACM 55 (4), 86–97. doi:10.1145/2133806.2133825
Ritchie, J. R. B., and McDougall, G. H. G. (1985). Designing and Marketing Consumer Energy Conservation Policies and Programs: Implications from a Decade of Research. J. Public Pol. Marketing 4, 14–32. doi:10.1177/2F07439156850040010210.1177/074391568500400102
Stern, P. C. (1992). What Psychology Knows about Energy Conservation. Am. Psychol. 47 (10), 1224–1232. doi:10.1037/0003-066X.47.10.1224
Sullivan, M. J., Matthew, M., Josh, S., and Freeman, S. C. (2009). Estimated Value of Service Reliability for Electric Utility Customers in the United States. Berkeley: Energy Analysis Department Ernest Orlando, Lawrence Berkeley National Laboratory.
Sullivan, M. J., Noland Suddeth, B., Vardell, T., and Vojdani, A. (1996). Interruption Costs, Customer Satisfaction and Expectations for Service Reliability. IEEE Trans. Power Syst. 11 (2), 989–995. doi:10.1109/59.496185
Thaler, R. (1980). Toward a Positive Theory of Consumer Choice. J. Econ. Behav. Organ. 1 (1), 39–60. doi:10.1016/0167-2681(80)90051-7
Thøgersen, J., and Grønhøj, A. (2010). Electricity Saving in Households-A Social Cognitive Approach. Energy Policy 38 (12), 7732–7743. doi:10.1016/j.enpol.2010.08.025
Torriti, J. (2012). Price-based Demand Side Management: Assessing the Impacts of Time-Of-Use Tariffs on Residential Electricity Demand and Peak Shifting in Northern Italy. Energy 44 (1), 576–583. doi:10.1016/j.energy.2012.05.043
Venkatachalam, L. (2004). The Contingent Valuation Method: a Review. Environ. Impact Assess. Rev. 24 (1), 89–124. doi:10.1016/s0195-9255(03)00138-0
Wang, L., Ma, A., Zhou, X., Tan, Y., Yan, X., and Wang, Y. (2008). “Environment and Energy Challenge of Air Conditioner in China,” in 2008 2nd International Conference on Bioinformatics and Biomedical Engineering, 4413–4416.
Wang, X., Xiao, Y., and Wang, X. (2014). Study and Analysis on Supply-Demand Interaction of Power Systems under New Circumstances. Proc. CSEE 38 (21), 5018–5028. doi:10.13334/j.0258-8013.pcsee.2014.29.003
Welsh, M. P., and Poe, G. L. (1998). Elicitation Effects in Contingent Valuation: Comparisons to a Multiple Bounded Discrete Choice Approach. J. Environ. Econ. Manag. 36 (2), 170–185. doi:10.1006/jeem.1998.1043
Wilson, C., and Dowlatabadi, H. (2007). Models of Decision Making and Residential Energy Use. Annu. Rev. Environ. Resour. 32, 169–203. doi:10.1146/annurev.energy.32.053006.141137
Wilson, C., Hargreaves, T., and Hauxwell-Baldwin, R. (2015). Smart Homes and Their Users: a Systematic Analysis and Key Challenges. Pers Ubiquit Comput. 19, 463–476. doi:10.1007/s00779-014-0813-0
Yamamoto, Y., Suzuki, A., Fuwa, Y., and Sato, T. (2008). Decision-making in Electrical Appliance Use in the Home. Energy Policy 36 (5), 1679–1686. doi:10.1016/j.enpol.2008.01.022
Zachariadis, T., and Poullikkas, A. (2012). The Costs of Power Outages: a Case Study from Cyprus. Energy Policy 51, 630–641. doi:10.1016/j.enpol.2012.09.015
Keywords: electricity interruption, household’s WTA, expenditure difference model, electricity market, contingent valuation
Citation: Zhao Y, Yu W, Guo D and He X (2022) Household Customers’ Cost of Interruption: Survey Study on Summer Electricity Peak of Xi’an City. Front. Energy Res. 9:802018. doi: 10.3389/fenrg.2021.802018
Received: 26 October 2021; Accepted: 14 December 2021;
Published: 14 January 2022.
Edited by:
Yongping Sun, Hubei University Of Economics, ChinaReviewed by:
Lingna Liu, China University of Geosciences, ChinaKeying Wang, Hubei University Of Economics, China
Copyright © 2022 Zhao, Yu, Guo and He. This is an open-access article distributed under the terms of the Creative Commons Attribution License (CC BY). The use, distribution or reproduction in other forums is permitted, provided the original author(s) and the copyright owner(s) are credited and that the original publication in this journal is cited, in accordance with accepted academic practice. No use, distribution or reproduction is permitted which does not comply with these terms.
*Correspondence: Xiaoping He, eHBoZUB4bXUuZWR1LmNu