- 1State Key Laboratory of Geomechanics and Geotechnical Engineering, Institute of Rock and Soil Mechanics (CAS), Wuhan, China
- 2School of Engineering Science, University of Chinese Academy of Sciences, Beijing, China
- 3State Key Laboratory of Coal Mine Disaster Dynamics and Control, College of Resources and Security, Chongqing University, Chongqing, China
The inter-salt shale in the Qianjiang formation of Jianghan Basin in China is characterized by multiple salt-shale bedding planes, various rock strength, and high heterogeneity of rock mechanics. In this paper fracturing experiments under different conditions were carried out to study the effects of the injection velocity, type of fracturing fluid and interface strength on the propagation law of hydraulic fracture in the salt sedimentary rhythm there. In the meantime, Acoustic emission system and radial strain sensor were applied to monitor experimental process. The result indicates that 1) compared with the shale, there are four fracture propagation modes mainly being observed: passivating type (Mode I), “I”-type (Mode II), penetration type (Mode III) and mixed type ((Mode IV)), among which the mixed type is the relatively complex crack propagation mode. 2) With the increase of injection rate and viscosity of fracturing fluid, the hydraulic fracture will penetrate cementation surface more easily. 3) The increase of flow rate and viscosity will increase the breakdown pressure. The breakdown pressure of high strength cementation surface is 16.70% higher than that of low strength.
1 Introduction
When the saline lake water changes over the course of the fresh-saline cycles, the evaporated deposits form sedimentary stratum of multiple lithology mixed with bedded salt layer called sedimentary rhythm. Taking Qianjiang Formation as an example, there are 193 class III sedimentary rhythm layers with a cumulative thickness of more than 2000 m in Hubei, China. Multiple lithologic strata such as argillite, dolomite shale and glauberite strata are sandwiched between the upper and lower salt layers, with a maximum thickness of 20 m and a general 5–12 m. As a result of the upper and lower salt rocks blocked to form the super fertility of shale oil, this set of strata inside is both a source and a reservoir layer, which is likely to be an energy breakthrough for China. Because the mineral compositions in adjacent layers are diverse, interfaces between these adjacent layers are lithology differentiation planes or zones, which results in the distinct mechanical property of these interfaces. Considering the wide distribution of these interfaces, it will exert considerable influence on the fracturing effect. Obviously, the geomechanical properties of the interfaces vary greatly because of the lithostratigraphic disposition, diagenetic history; tectonic history and so on. Consequently, expounding the propagation mechanism of fractures on multi-lithological formations, especially bedded salt formations, does really matter.
Scholars the whole world have carried out a lot of research on extension of hydraulic fractures in multi-lithology layered reservoirs. Teufel and Clark (Teufel and Clark, 1984) carried out hydraulic fracture tests earlier coupling with elastic finite element studies. The results indicate that the weak shear strength of the layers and compressional increase in the minimum horizontal stress in the bounding layer are the essential factors. Roundtree (Roundtree and Miskimins, 2011) performed similar experiments with documented uses of passive microseismic to better clarify the fracture evolution at the layer boundary between good bonding layers. Ouchi H (Ouchi et al., 2017) and Foster J T think that the contrast of interlaminar mechanical properties and dip angle play an essential role in affecting the fracture trajectory. Xing P (Xing et al., 2018) analyzed the effects of interlayer horizontal stress contrast, vertical stress, existence of horizontal weak interface and the material fracture toughness through lattice model. Heng Shuai (Heng et al., 2019) concluded that by physical experiments and numerical simulation: strong beddings tend to penetrate hydraulic fracture; However, the weak beddings prefer to cause hydraulic fracture deflection along the beddings. Peng Tan(Tan et al., 2019) discussed the influence of the fracture initiation position fracturing fluid viscosity and injection rate by triaxial fracturing experiments on layered samples combining with the natural sandstone and coal to simulate the fracture propagation behavior. Wang Suling (Suling et al., 2012) tracked the fracture extension on the low permeability reservoir sandstone-mudstone boundary in real-time by using the white light speckle experiment. Gao Jie and Hou Bing (Gao et al., 2018) designed a model of three-layer hydraulic fracturing designed and an improved large-scale triaxial fracturing device was used to observe the fracture initiation and propagation. Li et al. (Li et al., 2021) considered a 3D model involving heterogeneity to simulate the competitive propagation of multiple fractures in heterogeneous layered strata. The results show that low permeability will enhance the breakdown pressure and cause the hydraulic fractures tend to propagate more easily into the interlayers. Forbes Inskip et al. (Inskip et al., 2020) proposed new numerical results on the ending conditions for fluid-driven (mode I) vertical cracks in layered rock sequences when the tip of the crack approaches the interface between two layers with opposite mechanical properties. The results show that crack arrest usually occurs at the interface with the more compliant layer when the layer at the crack tip is hard. Conversely, crack arrest may occur in the main layer below the interface when the layer above the interface is harder. WANG et al. (Wang et al., 2021) conducted triaxial fracturing experiments on full-diameter shale samples to study the vertical propagation of hydraulic fractures in different reservoirs. Hydraulic cracks propagate crosswise in tight sandstone layers, in straight line in sandstone layers with natural cracks, and trapezoidal cracks are formed in stratified shale layers. Hou et al. (Hou et al., 2021b; 2021a; 2021c)created a REV (representative elementary volume)-scale lattice Boltzmann (LB) model involving Klinkenberg’s effect and gas absorption and analyzed the fracture complexity and gas pressure on shale gas flow quantitatively. The results demonstrated that the gas flow behaviors in the fractured shale are related strongly to fracture morphology and gas pressure. Wang (Yizhao et al., 2021) developed a new machine with a high-efficiency sealing method for laboratory hydraulic fracturing, based on which a series of fracturing tests was conducted on shale samples under different confining pressures. The results indicate that apparent brittle failure characteristics and anisotropic phenomena both in strength and failure patterns. Gao (Gao and Ghassemi, 2020) solved the essential issue of hydraulic fracturing in the presence of elastic modulus and stress difference in bedding rock in petroleum resources development by a 3D hydro-mechanical model. The result show that the hydraulic fracture prefers to propagates mainly in the lower Young’s modulus layers. He et al. (He et al., 2021) investigated the water-flowing fractured zone (HWFFZ) in layered overburden strata by theoretical analyses and engineering verification. They concluded that fractures occur in overburden formation thanks to the tensile stress excels the tensile strength. On the contrary, fractures will penetrate the overburden strata when the compressive stress exceeds the compressive strength.
Some scholars have researched on the inter-salt shale reservoir of Jianghan basin in Qinjiang, China. Wang et al., (Wang et al., 2020), carried out he confined pyrolysis experiments on kerogen from the Qianjiang Formation to investigate hydrocarbon evolution in the basin. They think that salt basin source rocks have high hydrocarbon generation potential and low hydrocarbon generation activation energy. Oil can be generated at lower maturity stages, with a maximum production of about 0.75% EasyRo%. Ma et al. (Ma et al., 2019) studied the molecular geochemical data interpretation focusing on the inter-salt shale oil system evaluation in order to clarify the pathways of diagenetic fluid movement and hydrocarbon moving. Fan (Fan et al., 2019) performed a series of experiments such as triaxial compression tests, CT scanning and X-ray diffraction for inter-salt shale. The results indicate that the inter-salt shale is full of high anisotropy and heterogeneity. Because of the high brittle mineral content, it can be a great candidate for fracturing.
From the discussions above, we can see those scholars at home and abroad have conducted relatively in-depth research on the fracturing of multi-lithology layered reservoir, However, there are few studies on the characteristics of inter-salt shale reservoirs, and present related studies are only in perspective of rock mechanics and geochemistry analysis. There is a lack of research on crack initiation, fracture mode and its related factors. This paper based on salt-shale-salt assemblage samples in Jianghan basin by a variety of detection methods, studied the effects of the injection velocity, type of fracturing fluid and interface strength on the propagation law of hydraulic fracture. It will provide some guidance for engineers in mult-lithology layered reservoir especially involving salt layer.
2 Geological Description
Jianghan Basin is a Paleogene continental oil-bearing Salt Lake Basin in eastern China. It is a Cretaceous Paleogene faulted basin developed by Yanshan movement. It has experienced two fault depression cycles, mainly developing two sets of source and reservoir series of Xingouzui Formation and Qianjiang Formation. Qianjiang Formation in Qianjiang sag is formed by frequent interaction of sand mudstone layer and salt rhythm layer. The salt rhythm layer is composed of salt rock layer and inter-salt shale layer, with a total of 193 salt rhythm layers, as shown in Figure 1. Vertically, the inter-salt shale deposited in the early sedimentary stage of the second member of the potential, the middle sedimentary stage of the third member of the potential and the late sedimentary stage of the fourth lower member of the potential is not only a high-efficiency and high-quality source rock, but also a reservoir rock. Due to the separation of upper and lower salt rocks and poor vertical migration conditions, a closed inter-salt shale oil system is formed.
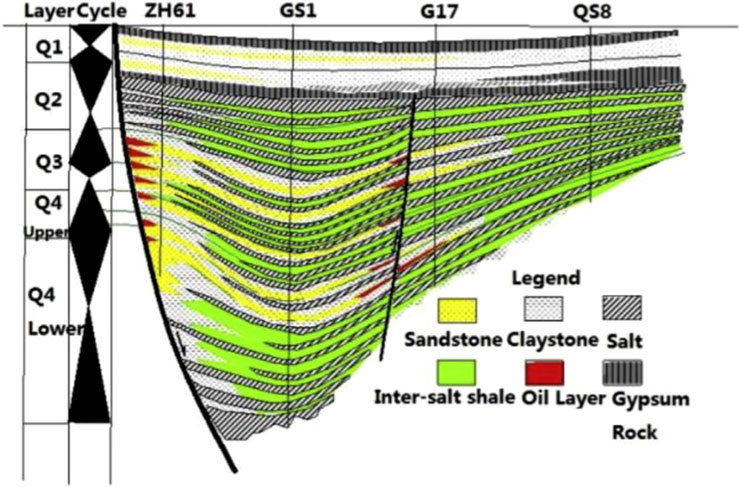
FIGURE 1. Stratigraphic sequence of Qianjiang Formation(Fan et al., 2019).
3 Sample Preparation
3.1 Rock selection and processing.
Beddings in Qianjiang formation reservoir were well developed and the core samples collected underground tend to be broken, which causes the extreme difficulty of obtaining and smallness in quantity. In consideration of this situation, rock with mechanical properties relatively consistent with downhole core can be selected for experiments. Pakistan salt rock and outcrop shale of Longmaxi formation in Sichuan Basin are selected from a variety of rock materials to replace the underground rock. The average mechanical properties of rock samples are shown in Table 1.
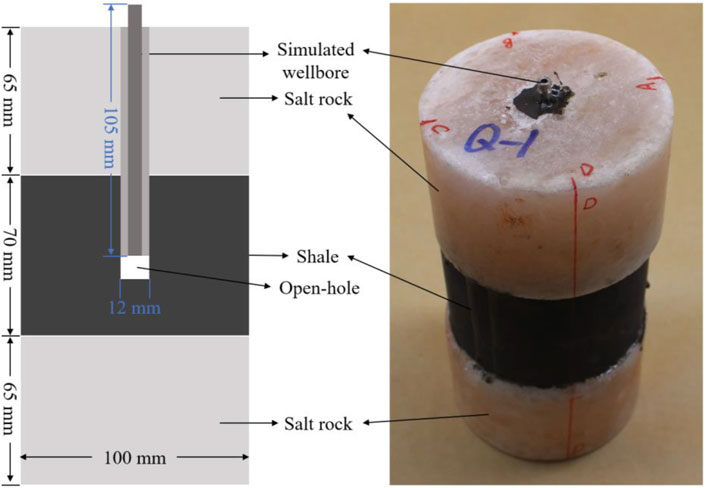
The crisscrossing of salt and mud layers is the notable feature on the oil reservoir of Qianjiang depression. In order to truly reflect it, composite samples with a height of 200 mm and a diameter of 100 mm were made for the test. The upper and lower layers are designed as salt rock and the middle is shale with a height of 67 mm and a diameter of 100 mm.The making process of the sample is as follows: First, three complete rock blocks are bonded with adhesives (0.5 g/m2) with shale in the middle and rock salt on both sides. Then in order to prevent moisture, wrap the sample with fresh-keeping film and stand for 12 h until the adhesive solidifies. Finally, drill the samples according to the given size. It is worth noting that the layer direction of the shale is parallel to the end face. Drilling a hole with a height of 70 mm and a diameter of 12 mm, downward from the center of the upper end face (saline) is to simulate the wellbore. The simulated wellbore is made of high-strength stainless steel with a diameter of 6 mm and a length of 105 mm. A groove is reserved at the outer end of the steel pipe to connect the liquid injection pipeline of the injection system. The annulus area between the wellbore and the rock sample is sealed with epoxy resin to enclose the fluid. The hollow-hole (10 mm hollow section) is set as fracturing section. The prepared composite sample is shown in Figure 2.
3.2 Properties of cementation surface.
Rock salt and shale are bonded by two kinds of adhesive to simulate the interfaces between storage layer and bedded salt layer in the deep. Epoxy resin and glass adhesive are the analogue of the weak bonding interface and the strong respectively. Before fracturing test, the shear strength of cementation interface is obtained by direct shear experiments. For this purpose, the rectangular cube samples of shale and rock salt with size of 100 × 100 × 50 mm are prepared and bonded with the adhesive to assemble a cube with side length of 100 mm.
The direct shear test was carried out on the RMT-150C testing machine of Wuhan Institute of rock and soils, Chinese Academy of Sciences. The maximum vertical and horizontal hydraulic pressure of the testing system are 1,000 kN and 500 kN separately, besides both piston stroke is design to be 50 mm; During the test, the normal force set as the predetermined value at the rate of 1 kN/s maintains constant, shear load in the horizontal in displacement control mode works gradually at the loading rate of 0.002 mm/s. Finally, with the curve reaching the residual strength, terminate the test. The data of tangential stress and displacement are automatically recorded by the test software. The processed data of samples are shown in Table 2.
As results shown, the cohesion of epoxy resin adhesive is 1.25 MPa, the internal friction angle is 43.65°, while the cohesion of glass adhesive is 0.60 MPa, the internal friction angle is 35.68°. Therefore, it is suitable for us to utilize the adhesives to simulate the interfaces as the result of the property difference.
4 Experimental Operations
4.1 Experimental system and plan
As shown in Figure 3, the test system is mainly composed of rock servo loading system, fracturing fluid injection system and acoustic emission detection system.
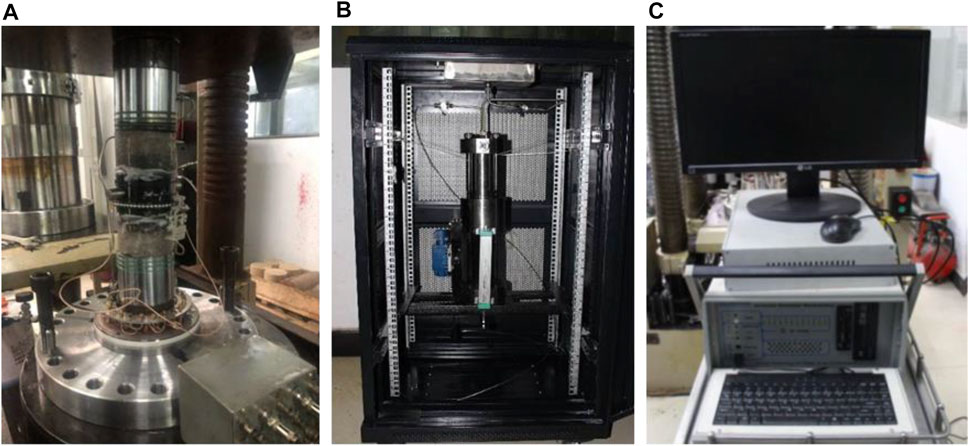
FIGURE 3. Hydraulic fracturing test system: (A) rock servo loading system; (B) fracturing fluid injection system; (C) acoustic emission detection system.
The rock servo loading system is mainly used to simulate the practical stress environment of the formation. Its maximum output axial force is 2000 kN and the maximum confining pressure is 140 MPa. The fracturing fluid injection system (AE) aims to injecting fracturing fluid into the samples through the simulated wellbore in the mode of constant pressure or constant flow. Furthermore, it can realize the real-time acquisition of pump pressure and discharge. The maximum output pressure is 80 MPa and output displacement ranges from 0.1 ml/s to 10 ml/s. The AE is composed of eight piezoelectric sensors equipped with preamplifiers (bandwidth: 50–500 khz) to monitor the fracture signal during hydraulic fracturing tests. The viscosity of fracturing fluid can be changed by adjusting its formula system. The slick water with viscosity of 3 mP s is a composite of drag-reduction agent (0.02%), chean-up additive (0.03%) and water (99.95%). The Guar gum with viscosity of 120 mP s is a composite of thickening agent (0.25%), thickening agent (0.3%) and water (99.45%).
The experiment was designed different at injection rates, fracturing fluid viscosity and cementation surface strength to study the geometry of hydraulic fractures in the process of initiation and fractures propagation between interfaces. The experiment plan is shown in Table 3.
4.2 Experimental Procedures
Firstly, the prepared composite samples were observed and photographed to record the surface morphology. Then, AE probes equipped with the preamplifiers are attached on the surface of the sample as shown in Figure 3A. The radial sensor is also clamped to the surface of the sample. After connecting the fracturing fluid injection system to the wellbore, the sample was placed in the triaxial pressure chamber. Based on the preparation above, the test can be carried on according to the following steps: 1) the axial stress gradually increases at the rate of 0.1 MPa/s to reach the predetermined value of 3 MPa; 2) inject the fluid with the mixed with red tracer into the wellbore at the configured rate; 3) start monitoring and recording related data. When the hydraulic fracture extends to the surface of the sample and liquid leakages, the test is completed.
5 Experimental Results and Analysis
5.1 Analysis of Hydraulic Fracture Morphology
After the test, the indication of tracer was observed on the exterior surface of the sample. With opening the sample along the major hydraulic fracture and recording the its propagation mode and final fracture morphology. In Figure 4, as we can see, the left is the intact before the test, the middle the shape of the sample after the test, and the right side the schematic diagram of crack propagation.
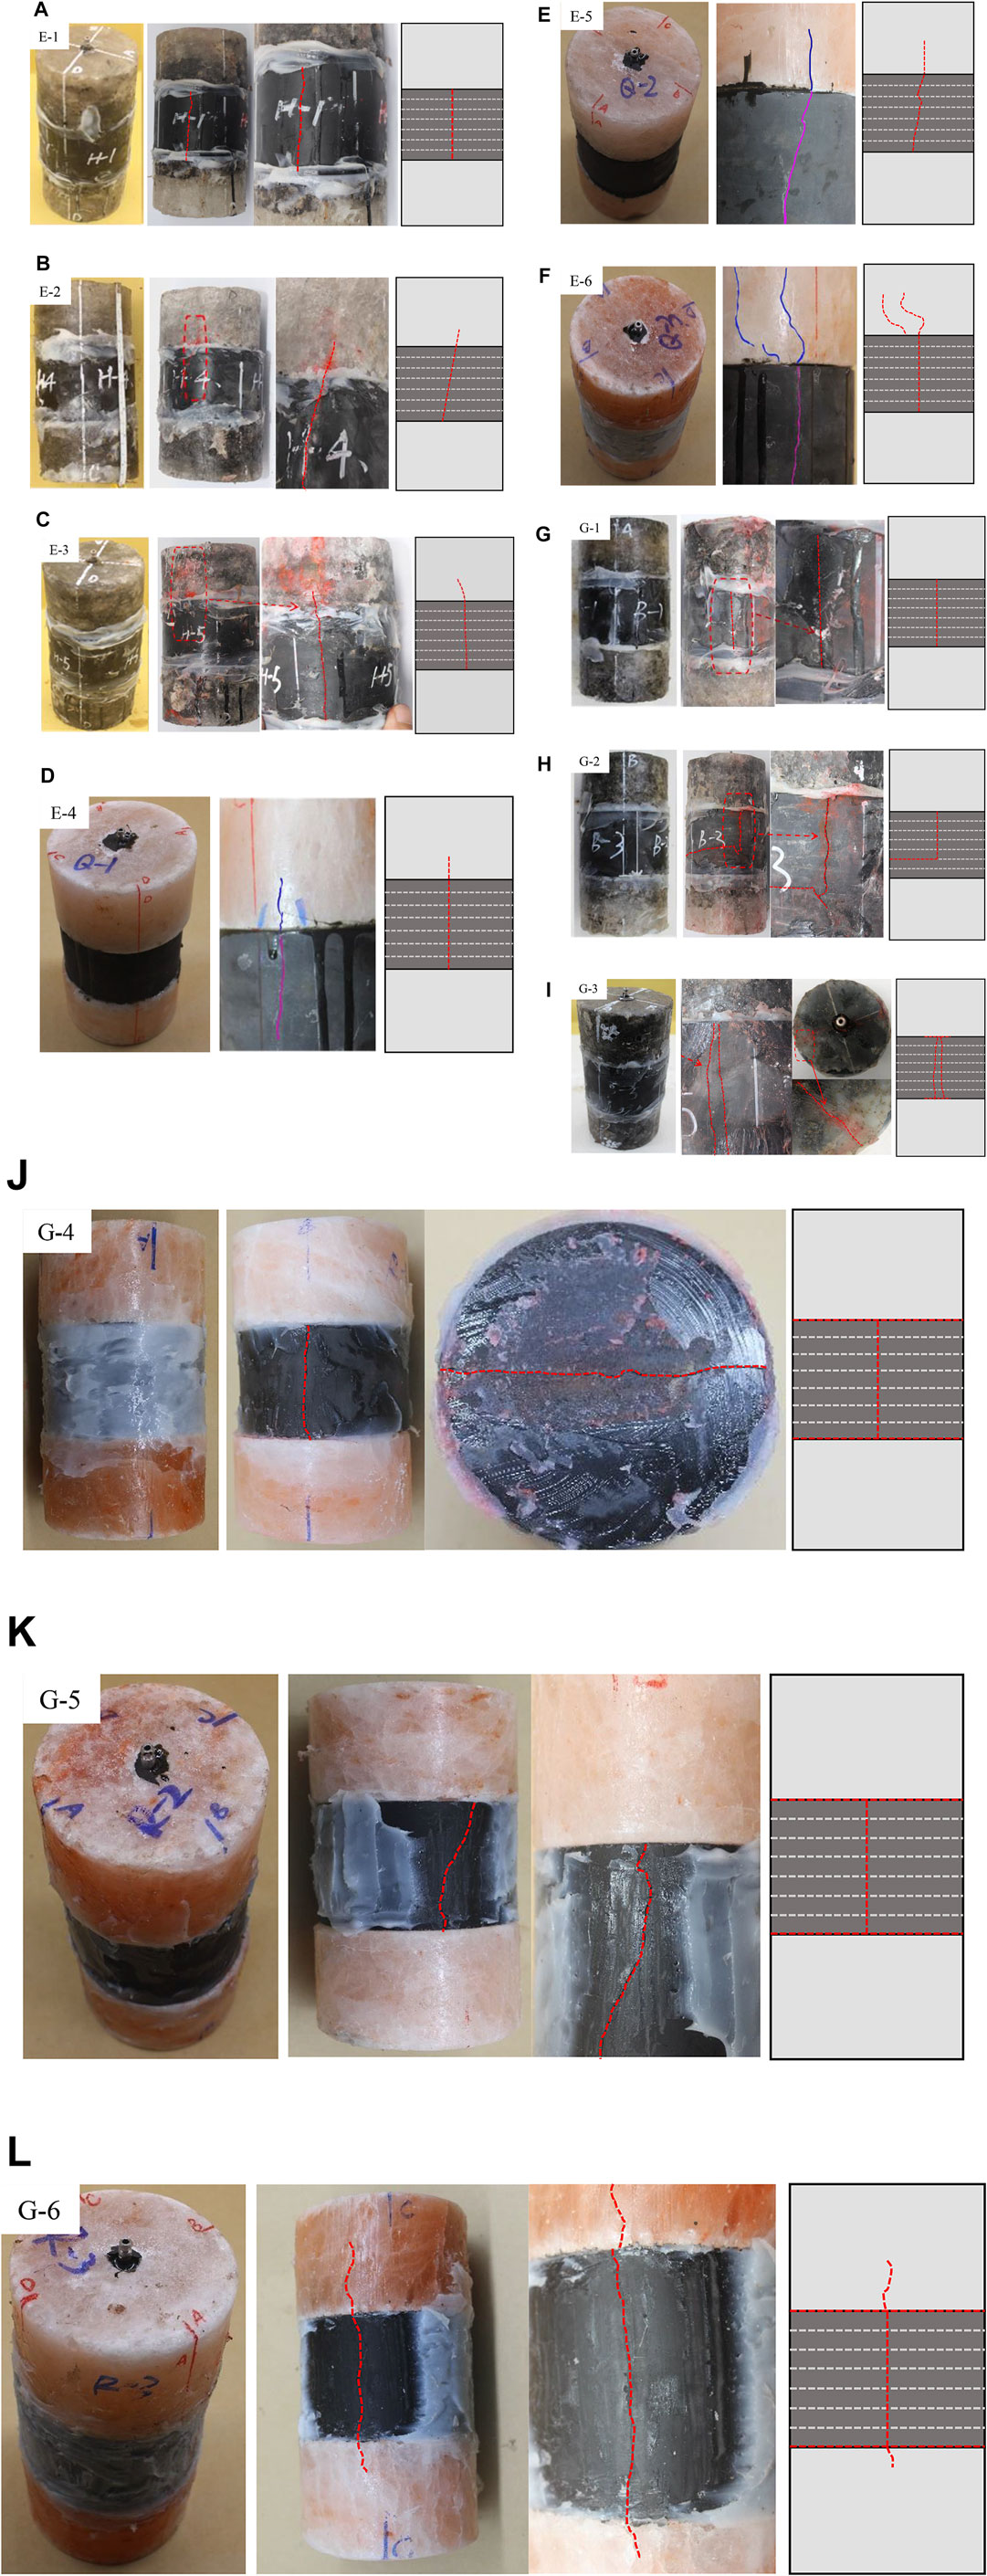
FIGURE 4. Fracture morphologies of samples: (A) E-1; (B) E-2; (C) E-3; (D) E-4; (E) E-5; (F) E-6; (G) G-1; (H) G-2; (I) G-3; (J) G-4; (K) G-5; and (L) G-6.
5.1.1 Analysis of Fracture Propagation Mode
According to the experimental results, the crack propagation patterns can be summarized as the following modes:
Mode I (Passivated type): As shown in Figure 5A, after the hydraulic crack occurs in the bare hole, it gradually runs through the shale and tends to end at the upper and lower cementation surfaces. The major crack prefers to distribute symmetrically and longitudinally and then extends to the outside surface. The crack propagation behavior of samples E-1, G-1, and G-2 (Figures 4A,G,H), can also be classified as Mode I. What is more, the major crack of sample G-2 feeds through into the bedding planes, forming a more complex crack network.
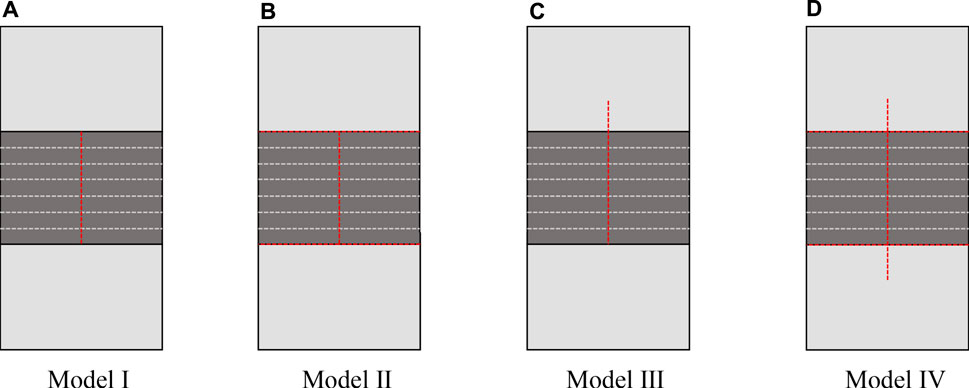
FIGURE 5. Model of hydraulic fracture initiation and propagation: (A) model Ⅰ; (B) Model Ⅱ; (C) Model Ⅲ and (D) Model Ⅳ.
Mode II (“I” type): The hydraulic fracture begins in the hollow hole section, it will grow to the upper and lower cementation surfaces, deflects along the surfaces and finally continues to spread. The crack, on the whole, ultimately presents an “I”-shaped structure (Figure 5B). The propagation behavior of samples G-3, G-4 and G-5 (Figures 4I–K) subordinates to Mode 2, among them two longitudinal main cracks close to each other are formed G-3.
Mode III (Penetrating type): The major fracture emerging from the bare hole extends to the cementation surfaces and then penetrates them. Finally, the crack extends a certain distance in the salt layer as shown in Figure 5C. Samples E-2, E-3, E-4, E-5, and E-6 (Figure 4B–F are all fracture propagation behavior of Mode 3. After penetrating the cementation surface, especially, sample E-6 forms two fractures in one piece of salt rock layer and continues to expand. The propagation distances of fractures in rock salt are 2,3,4 and 5 mm respectively.
Mode IV (Mixed type): It is the combination of Mode II and Mode III, which forms a more complex fracture propagation network, as shown in 4) in Figure 5. The sample G-6 (Figure 4L) contains a main hydraulic fracture in the shale section and it extends to the upper and lower salt layers. The extension distance in the upper salt layer is greater than that in the lower. At the same time, the presence of red trace is also observed at the upper and lower cementation surfaces, indicating that the cementation surface is also opened.
5.1.2 Influence of Injection Rate and Viscosity of Fracturing Fluid
For hydraulic fracturing, the injection rate and viscosity of the fluid affect the initiation and propagation of hydraulic fractures. In this paper, 3 injection rates are performed to studied the effect. The results demonstrate that when the injection rate of fracturing fluid is set at 1.2 ml/min, the failure form of samples is relatively simple, most of them are symmetrical straight cracks. As shown in Figure 6A, the occurrence rates of fracture propagation modes I, II and III are 50, 25 and 25% respectively at the rate of 1.2 ml/min. With the increase of injection rate, hydraulic fractures tend to be easier to penetrate the cementation surface and expand to salt rock. When growing to 3.6 ml/min, the occurrence rates of modes I, II and III are 25, 25 and 50% respectively; The occurrence rates of fracture propagation modes II, III and Ⅳ are 25, 50 and 25% respectively at the rate of 6.0 ml/min. At the same time, the propagation distance of fracture in salt rock increases, with the growth of injection rate. When the cementation interface is epoxy resin and the viscosity of fracturing fluid is 120 mPa∙s, the hydraulic fractures penetrate the cementation surface and continue to expand in the salt rock stratum. The expansion distance is 14.2 mm when the injection rate is 1.2 ml/min and 27.3 mm when the injection rate is 3.6 ml/min. When the injection rate is 6.0 ml/min, the hydraulic fractures re crack two fractures after penetrating the cementation surface, The longest extension distance is 46.5 mm. Obviously, the higher the fluid velocity, the faster the pressure in the hollow section will increase over a certain period of time, and the dramatic increase of pressure will make it more advantageous to expand in the original direction.
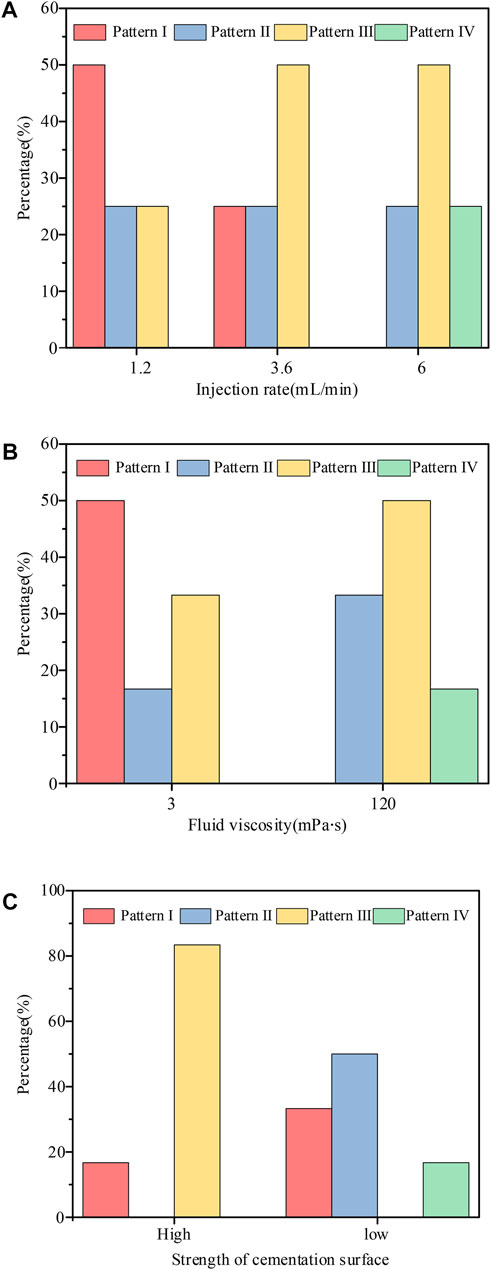
FIGURE 6. Occurrence rate of crack propagation mode under different conditions: (A) injection rate; (B) fluid viscosity; (C) cementation surface.
In this paper, the fracturing fluid with the viscosity of 3 mPa s and 120 mPa s are used for the test. With the increase of fracturing fluid viscosity, hydraulic fractures are easier to penetrate the cementation surface and expand in salt rock. As illustrated in Figure 6B, when the fracturing fluid viscosity is 3 mPa s, the occurrence rates of expansion mode I, II and III are 50, 16.7 and 33.3% respectively. When the fracturing fluid viscosity is 120 mPa s, the occurrence rates of expansion mode II, III and IV are 33.3, 50 and 16.7% respectively.
5.1.3 Influence of Cementation Surface
In order to study the influence of interface strength on hydraulic fracture propagation, two kinds of cementation interfaces are set up in the experiment, and the results indicate the interface properties exerts a vital influence on the propagation of cracks. As shown in Figure 6C, when cementation surface is full of epoxy resin adhesive, the incidence of expansion mode I and III are 16.7 and 83.3% respectively. When glass adhesive, the incidence of expansion mode I, II and IV are 33.3, 50 and 16.7% separately. Due to the higher strength of epoxy resin, it bonds more easily salt rock and shale together. Therefore, when cracks develop to surface, it is more likely to penetrate the cementation interface and expand. When sections are bond with glass adhesive (the strength of the cementation surface is relatively low), the hydraulic crack is prone to make the interface open and expand along the section of rocks. The energy required to open a strong interface is much greater than that of a weak interface, which means that it is difficult to open a strong interface when the accumulated energy per unit time is relatively insufficient.
5.1.4 Influence of Rock Property
In this paper, there are two kinds of rocks of different lithology (salt rock and shale) for fracturing test. The through crack was formed in shale, and then expand in salt rock stratum vertically. The expansion distance is limited and cannot extend to the end face of the sample. As we all know, the fracture toughness of reservoirs tends to affect the vertical fractures expansion. In this experiment, the stress intensity factor of salt rock is about 9 times that of shale. Therefore, hydraulic fractures are easier to develop in shale. After reaching salt rock, the energy dissipates continuously in the extending process, only resulting in a short expansion distance. Many scholars have conducted fracturing tests in 300 mm cubic samples, and it can be observed that most samples extend vertically through. As we can see in Figure 1, the fracture toughness of rock salts is much greater than that of shales, which means that it takes a lot of energy to crack propagate in rock salts. Most of the growth energy is insufficient to maintain a strong distance for the fractures to continue to expand in the salt when they enter and extend to the shale section relatively easily.
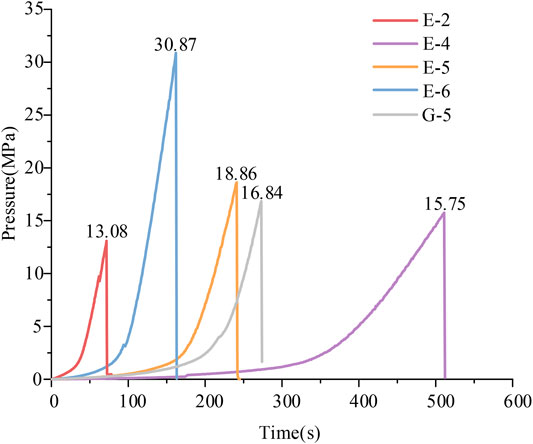
5.2 Analysis of Pressure Curve
Pressure curve is a vital part of fracturing operation, which reveals the whole process of fracturing. As shown in Figure 7, pressure curves under different conditions are obtained during the test, and the trend of pressure curve is roughly same. At the initial stage of the test, the fracturing fluid is injected into the hollow hole section, and the pressure start to increase slowly. With the continuous injection, the pressure increases approximately linearly until it reaches the fracture pressure. After that, the pressure will drop, even to 0. This is because the size of the sample is not huge enough, the fracture channel can be developed at the moment of fracture. Thus, the fracturing fluid flows out through the fracture channel and cannot continue to converge, the pressure cannot rise ultimately.
5.2.1 Analysis of Breakdown Pressure
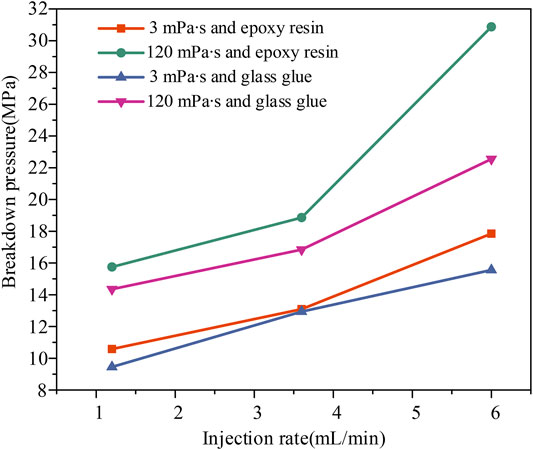
Breakdown pressure represents the crack initiation difficulty, and different factors tend to effect it. As shown in Figure 8, as the injection rate of fracturing fluid increases, the fracturing fluid quickly accumulates in the hollow hole section, resulting in a growth in breakdown pressure. When the injection rate increased from 1.2 ml/min to 3.6 ml/min, the average rupture pressure increased by 23.14%, and when it is from 3.6 ml/min to 6.0 ml/min, the average rupture pressure increased by 40.66%.
When the viscosity of fracturing fluid is 3 mPa s, the breakdown pressure is significantly lower than that when the viscosity is 120 mPa s. Considering the increasing from 3 mPa s to 120 mPa s, the breakdown pressure increases by 50.02% on average. This is because low viscosity fracturing fluid is easier to connect natural fractures or weak bedding surface, activate micro fractures in the sample and effectively reduce the breakdown pressure. For example, the bedding surface of sample G-2 is opened during fracturing. When the cementation surface is the high-strength cementation surface, the breakdown pressure is higher than that of low-strength, with an average increase of 16.70%. This may be because the high-strength cementation surface binds the salt rock and shale more like a whole, so it is more difficult to crack and the breakdown pressure is higher.
5.2.2 Analysis of Acoustic Emission Energy and Radial Strain
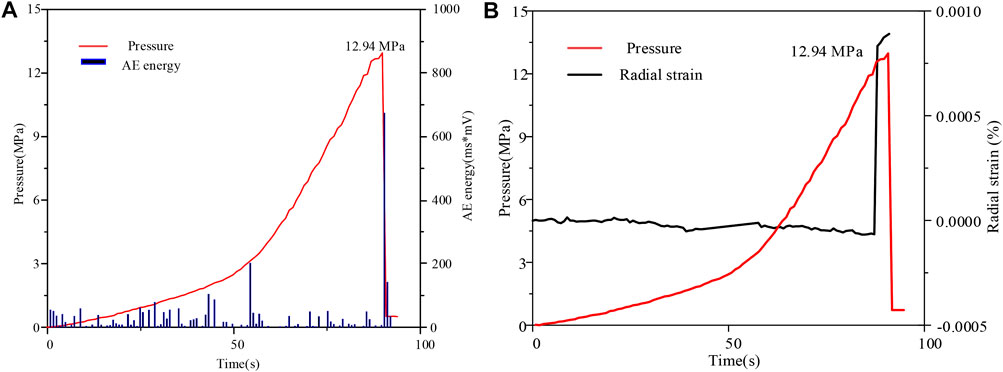
In the test, acoustic emission energy and radial strain can reflect the crack initiation, communication and dislocation of the samples from the inside and outside respectively. AE energy from the original acoustic emission log is extracted and analyzed in combination with the pump pressure curve, as shown in Figure 9A. In the initial stage of fluid injection, few acoustic emission signals can be captured. With the rapid pressure rising, the signal increases rapidly. When the pressure reaches the breakdown pressure, the acoustic emission energy value also reaches the highest. That reflects the whole fracturing process from fracture initiation, development to penetration.
The radial strain is obtained by installing a radial sensor on the specimen. As illustrated in Figure 9B, at the initial stage of fracturing fluid injection, the radial strain is almost unchanged and maintained at about 0. Currently, the fracturing fluid only act on the inter of the sample to produce micro fractures, but has little effect on the outer part. Therefore, the increase of pressure has little effect on the change of radial strain. Only at the stage close to the breakdown pressure, the radial strain increases suddenly, and the radial strain reaches the maximum when the breakdown pressure is reached. At this time, macro fractures are formed by hydraulic fracturing, resulting in sudden change of radial strain of the sample.
6 Discussion
In the actual stratum, salt rock and shale are cemented together in different ways. Therefore, it is necessary to probe into the initiation and propagation mode of hydraulic fractures under various cementation conditions. In this paper, two different cementation conditions are studied, and the propagation modes of hydraulic fracture are explored. According to the research results, in the case of low-strength cementation, high viscosity fracturing fluid injected at high speed will lead to a complex fracture propagation mode. At the same time, subject to the size of the sample, the research results will deviate from the field application to some degree. Therefore, in the next work, it is necessary to increase the size of the sample in order to better understand the crack propagation. Furthermore, for more accurate simulating the field situation in the future work, we will focus on various cementation conditions and the initiation mode of hydraulic fractures in different lithology.
7 Conclusion
In this paper, in order to study the hydraulic fracture initiation and propagation mode of inter-salt shale, a series of laboratory tests were carried out. The effects of different essentials factors such as injection rate, fluid viscosity and cementation strength on morphology after tests and fracturing pressure characteristics are studied. The following are some important findings:
1) From the laboratory test results, there are four fracture propagation modes mainly being observed after the initial crack starts from the hollow section. They are passivated type (Mode I), “I”-type (Mode II), penetration type (Mode III) and mixed type (Mode IV), among which the mixed type is the relatively complex crack propagation mode.
2) With the increase of injection rate and viscosity of fracturing fluid, the hydraulic fracture penetrating cementation surface more easily. Similarly, the higher strength of the cementation surface tends to cause the penetration. In other words, shearing slip along the cementation surface often means the existence of weak combination of surfaces.
3) When the injection rate increases from 1.2 ml/min to 3.6 ml/min, the average breakdown pressure increases by 23.14%, and when it increases from 3.6 ml/min to 6.0 ml/min, the average breakdown pressure increases by 40.66%. When the viscosity of fracturing fluid increases from 3 mPa s to 120 mPa s, the average breakdown pressure increases by 50.02%. The breakdown pressure of high strength cementation surface is 16.70% higher than that of low strength.
Data Availability Statement
The original contributions presented in the study are included in the article/Supplementary Material, further inquiries can be directed to the corresponding author.
Author Contributions
XC contributed to conception and design of the study. LW organized the database. HY and ZB performed the statistical analysis. XZ and ZB wrote the first draft of the manuscript. XC and LW wrote sections of the manuscript. All authors contributed to manuscript revision, read, and approved the submitted version.
Conflict of Interest
The authors declare that the research was conducted in the absence of any commercial or financial relationships that could be construed as a potential conflict of interest.
Publisher’s Note
All claims expressed in this article are solely those of the authors and do not necessarily represent those of their affiliated organizations, or those of the publisher, the editors, and the reviewers. Any product that may be evaluated in this article, or claim that may be made by its manufacturer, is not guaranteed or endorsed by the publisher.
References
Fan, X., Su, J. Z., Chang, X., Huang, Z. W., Zhou, T., Guo, Y. T., et al. (2019). Brittleness Evaluation of the Inter-salt Shale Oil Reservoir in Jianghan Basin in China. Mar. Pet. Geology. 102, 109–115. doi:10.1016/j.marpetgeo.2018.12.013
Forbes Inskip, N. D., Browning, J., Meredith, P. G., and Gudmundsson, A. (2020). Conditions for Fracture Arrest in Layered Rock Sequences. Results Geophys. Sci. 1-4, 100001. doi:10.1016/j.ringps.2020.100001
Gao, Q., and Ghassemi, A. (2020). Three Dimensional Finite Element Simulations of Hydraulic Fracture Height Growth in Layered Formations Using a Coupled Hydro-Mechanical Model. Int. J. Rock Mech. Mining Sci. 125, 104137. doi:10.1016/j.ijrmms.2019.104137
Gao, J., Hou, B., Chen, M., Fu, W., and Zhang, R. (2018). Effects of Rock Strength and Interfacial Property on Fracture Initiation and Propagation. Yanshilixue Yu Gongcheng Xuebao/chinese J. Rock Mech. Eng. 37, 4108–4114. doi:10.13722/j.cnki.jrme.2017.0960
He, C., Lu, W., Zha, W., and Wang, F. (2021). A Geomechanical Method for Predicting the Height of a Water-Flowing Fractured Zone in a Layered Overburden of Longwall Coal Mining. Int. J. Rock Mech. Mining Sci. 143, 104798. doi:10.1016/j.ijrmms.2021.104798
Heng, S., Liu, X., Li, X., Zhang, X., and Yang, C. (2019). Experimental and Numerical Study on the Non-planar Propagation of Hydraulic Fractures in Shale. J. Pet. Sci. Eng. 179, 410–426. doi:10.1016/j.petrol.2019.04.054
Hou, P., Liang, X., Gao, F., Dong, J., He, J., and Xue, Y. (2021a). Quantitative Visualization and Characteristics of Gas Flow in 3D Pore-Fracture System of Tight Rock Based on Lattice Boltzmann Simulation. J. Nat. Gas Sci. Eng. 89, 103867. doi:10.1016/j.jngse.2021.103867
Hou, P., Liang, X., Zhang, Y., He, J., Gao, F., and Liu, J. (2021b). 3D Multi-Scale Reconstruction of Fractured Shale and Influence of Fracture Morphology on Shale Gas Flow. Nat. Resour. Res. 30, 2463–2481. doi:10.1007/s11053-021-09861-1
Hou, P., Su, S., Liang, X., Gao, F., Cai, C., Yang, Y., et al. (2021c). Effect of Liquid Nitrogen Freeze-Thaw Cycle on Fracture Toughness and Energy Release Rate of Saturated sandstone. Eng. Fract. Mech., 108066. doi:10.1016/j.engfracmech.2021.108066
Li, M., Zhou, F., Yuan, L., Chen, L., Hu, X., Huang, G., et al. (2021). Numerical Modeling of Multiple Fractures Competition Propagation in the Heterogeneous Layered Formation. Energ. Rep. 7, 3737–3749. doi:10.1016/j.egyr.2021.06.061
Ma, X., Li, M., Pang, X., Wei, X., Qian, M., Tao, G., et al. (2019). Paradox in Bulk and Molecular Geochemical Data and Implications for Hydrocarbon Migration in the Inter-salt Lacustrine Shale Oil Reservoir, Qianjiang Formation, Jianghan Basin, central China. Int. J. Coal Geology. 209, 72–88. doi:10.1016/j.coal.2019.05.005
Ouchi, H., Foster, J. T., and Sharma, M. M. (2017). Effect of Reservoir Heterogeneity on the Vertical Migration of Hydraulic Fractures. J. Pet. Sci. Eng. 151, 384–408. doi:10.1016/j.petrol.2016.12.034
Roundtree, R., and Miskimins, J. L. (2011). “Experimental Validation of Microseismic Emissions from a Controlled Hydraulic Fracture in a Synthetic Layered Medium,” in SPE hydraulic fracturing technology conference (OnePetro). doi:10.2118/140653-ms
Suling, W., Yiming, Z., Minzheng, J., and Yang, L. I. (2012). The Mechanism of Crack Extension in Non-uniform Rock. Mech. Eng. 34, 38. doi:10.6052/1000-0879-12-194
Tan, P., Jin, Y., Yuan, L., Xiong, Z.-Y., Hou, B., Chen, M., et al. (2019). Understanding Hydraulic Fracture Propagation Behavior in Tight sandstone-coal Interbedded Formations: an Experimental Investigation. Pet. Sci. 16, 148–160. doi:10.1007/s12182-018-0297-z
Teufel, L. W., and Clark, J. A. (1984). Hydraulic Fracture Propagation in Layered Rock: Experimental Studies of Fracture Containment. Soc. Pet. Eng. J. 24, 19–32. doi:10.2118/9878-pa
Wang, J., Xie, H., and Li, C. (2021). Anisotropic Failure Behaviour and Breakdown Pressure Interpretation of Hydraulic Fracturing Experiments on Shale. Int. J. Rock Mech. Mining Sci. 142, 104748. doi:10.1016/j.ijrmms.2021.104748
Wang, Z., Tang, Y., Wang, Y., Zheng, Y., Chen, F., Wu, S., et al. (2020). Kinetics of Shale Oil Generation from Kerogen in saline basin and its Exploration Significance: An Example from the Eocene Qianjiang Formation, Jianghan Basin, China. J. Anal. Appl. Pyrolysis 150, 104885. doi:10.1016/j.jaap.2020.104885
Xing, P., Yoshioka, K., Adachi, J., El-Fayoumi, A., Damjanac, B., and Bunger, A. P. (2018). Lattice Simulation of Laboratory Hydraulic Fracture Containment in Layered Reservoirs. Comput. Geotechnics 100, 62–75. doi:10.1016/j.compgeo.2018.03.010
Keywords: inter-salt shale, hydraulic fracture, cementation surface, breakdown pressure, acoustic emission
Citation: Zhang X, Bi Z, Chang X, Wang L and Yang H (2021) Experimental Investigation on Hydraulic Fracture Morphology of Inter-Salt Shale Formation. Front. Energy Res. 9:800521. doi: 10.3389/fenrg.2021.800521
Received: 23 October 2021; Accepted: 30 November 2021;
Published: 16 December 2021.
Edited by:
Guowen Xu, Colorado School of Mines, United StatesReviewed by:
Peng Hou, Purdue University, United StatesXian Shi, China University of Petroleum, China
Copyright © 2021 Zhang, Bi, Chang, Wang and Yang. This is an open-access article distributed under the terms of the Creative Commons Attribution License (CC BY). The use, distribution or reproduction in other forums is permitted, provided the original author(s) and the copyright owner(s) are credited and that the original publication in this journal is cited, in accordance with accepted academic practice. No use, distribution or reproduction is permitted which does not comply with these terms.
*Correspondence: Zhenhui Bi, YnpoMTk5NTExOTk4QDE2My5jb20=
 Xiaoyu Zhang1,2
 Zhenhui Bi
 Lei Wang
