 Chunhua Fang1
 Yuning Tao
95% of researchers rate our articles as excellent or good
Learn more about the work of our research integrity team to safeguard the quality of each article we publish.
Find out more
ORIGINAL RESEARCH article
Front. Energy Res. , 01 December 2021
Sec. Smart Grids
Volume 9 - 2021 | https://doi.org/10.3389/fenrg.2021.798048
This article is part of the Research Topic Advanced Anomaly Detection Technologies and Applications in Energy Systems View all 64 articles
The surface discharge development processes of polluted porcelain insulators for power transmission lines are tightly related with the development of leakage current (LC), the characteristics of LC, the insulating condition, and discharge intensity of the insulator surface have an important significance for revealing the contamination discharge state of insulators. In order to analyze the LC characteristics of porcelain insulators in the process of pollution flashover, artificial pollution flashover tests on porcelain insulators were conducted in the artificial fog cabinet, and the characteristics of LC waveforms in time-domain and frequency-domain were simultaneously measured and analyzed during the tests. The results indicated that the amplitude of LC, fundamental harmonic, the third harmonic, and fifth harmonic had a strong correlation, the maximum of LC(Im), the rate of total harmonics (THD), and the phase difference of fundamental harmonic (θ) were used for the representation of the characteristics of the LC waveform. The LC has the characteristics of high amplitude, low proportion harmonic, and small phase difference between the fundamental harmonic and voltage before the flashover occurrence. The test results provide effective reference for porcelain insulators in pollution flashover forecasting.
Outdoor insulators have been exposed in severe environment since the birth of the power system (Yang et al., 2019; Liu et al., 2020; Shen and Raksincharoensak, 2021a; Shen and Raksincharoensak, 2021b). The airborne particles are deposited on the insulator surface and the pollution builds up gradually, which causes insulator flashover during wet weather conditions (Yang et al., 2019; Shen et al., 2021; Yang et al., 2021). So conditions monitoring of the insulator are important to know about insulator status of the insulator. The analysis of surface LC is necessary to know about the insulator condition (Miyake et al., 2010; Shen et al., 2020; Yang et al., 2020; Zhu et al., 2020; Noman et al., 2021).
A large number of research studies have dealt with LC, including the maximum value of the LC pulse under the operating voltage, the amplitude of the LC before the occurrence of flashover and the LC root-mean-square values (Li et al., 2010; Jiang et al., 2010). Besides, the number of the highest peak power-spectrum is also used as methods for pollution monitoring (Chandrasekar et al., 2009; Pylarinos et al., 2011; Pylarinos et al., 2012). Literature (Chaou et al., 2015) reported that the main frequency of the porcelain insulator LC waveform is 50, 150, and 250 Hz and the LC waveform is divided into six categories. Papers (Suda T, 2001; Bashir and Ahmad, 2010; Douar et al., 2010; Dhahbi-Megriche and Beroual, 2016) introduced the analysis of the variation characteristics of the LC in the frequency domain power spectrum during the entire process of the contamination flashover. But all these studies listed have not yet reached consensus on which spectrum parameters can represent contamination insulator surface state.
In this paper, while measuring polluted porcelain insulator LC data and shooting discharge pictures, the frequency spectrum characteristics of LC waveform is extracted during loading voltage process, analyzing the variation of LC characteristics carefully under various salt density, as well as the correlation between each feature quantity.
According to IEC60507 standard (IEC 60507, 1991), the solid layer method experiments are carried out in an artificial fog chamber. The schematic diagram of the test device is shown in Figure 1. The artificial fog chamber’s dimensions are 5 × 5 × 5 m. The power supply includes a shifting coil voltage regulator (150 kV/4A) and test transformer (1000 kV/2250 kVA). The high voltage supply is connected to the artificial fog chamber through a 220 kV wall bushing. The fog is generated by the automatic steam generator. Steam output remains at a fixed rate. The data acquisition system monitors and records LC and voltage waveforms using a LABVIEW program on the personal computer. The leakage current sensor is connected to the low-voltage circuit, the leakage current signal is obtained and the voltage signal is obtained through the capacitive voltage divider, which are then connected to the leakage current and voltage measurement system through the double-layer shielded coaxial cable, the sampling rate is 125kS/s, and then connected to the computer, the software of the leakage current measurement system finally completes the measurement of the leakage current and the pollution flashover voltage in the artificial pollution flashover test of the insulator.
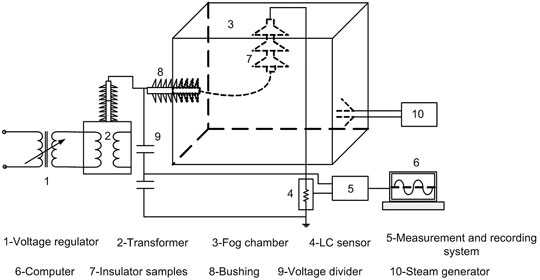
FIGURE 1. Schematic diagram of the test device.
The XP-70 porcelain insulator is used to measure the LC in the test. A sample insulator string includes seven pieces of porcelain insulator that are used for the experiments. The details of the dimensions of the porcelain insulator are in Table 1.

TABLE 1. Dimensions of test porcelain insulator.
The solid layer method as described in IEC60507 is used in the test (IEC, 1991). NaCl is used as soluble salt. Kaolin powder is used as non-soluble salt. First, NaCl is mixed with Kaolin powder in a certain proportion in distilled water. Then the mixture is coated on the clean porcelain insulator surface. Finally, the pre-contaminated samples are hung in the laboratory until they naturally dry for more than 24 h before the experiment. Based on the IEC60507 standard, four levels of equivalent salt deposit density (ESDD) are applied to the experiment, respectively, 0, 0.1, 0.2, and 0.4 mg/cm2. And the non-soluble deposit density (NSDD) is set to 1.0 mg/cm2. The commonly used methods of artificial pollution test include constant pressure lifting method. During the test, when the wetness of the umbrella skirt surface reaches a fully saturated state, the pressure is immediately increased to flashover. The speed of the increase is not specified before 40% of the expected flashover voltage. Then the voltage is increased to flashover at a rate of 10–20% of the expected flashover voltage per second.
As shown in Figure 2, at the first stage of discharge, the weak filamentary discharge can be seen on the surface of the porcelain insulator. With the increase of voltage, the “squeak” sound can be heard.
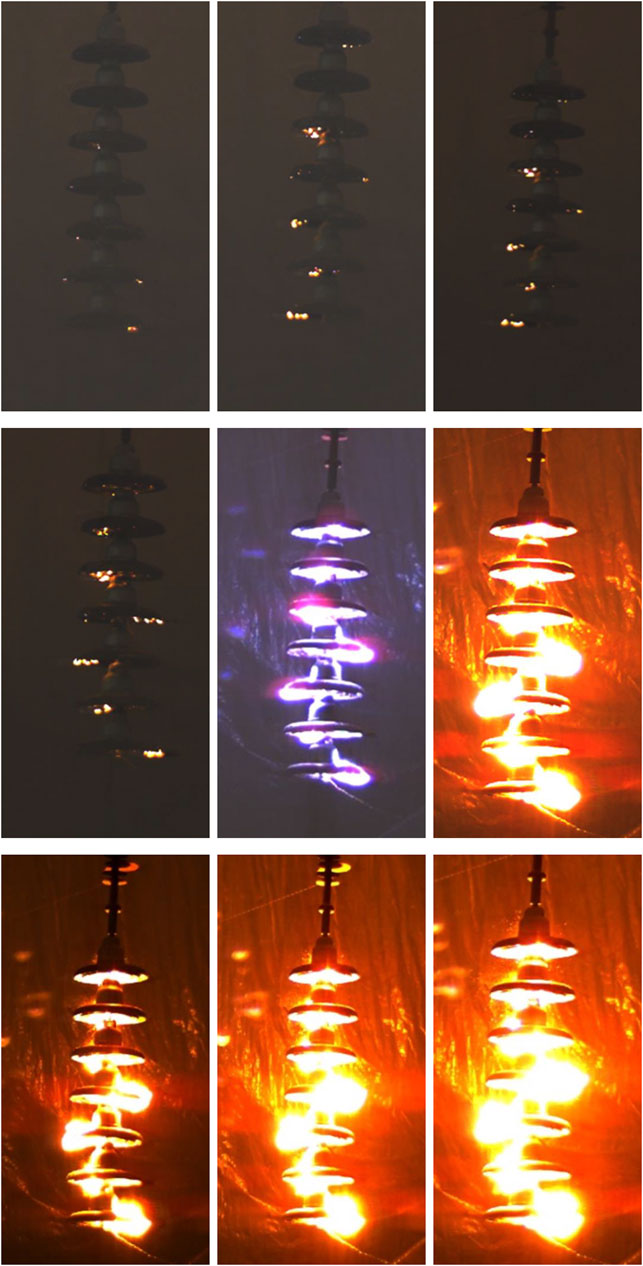
FIGURE 2. The process of contamination discharge of insulators.
Contaminant forms a layer on the surface of the insulator in combination with water, which causes the formation of conducting films, and that causes to flow the LC through the insulator surface under wet conditions. Evaporation of water layers in these areas forms dry bands. The appearance of dry bands on the insulator surface causes arcs. Such arcs may elongate until they bridge the two metal electrodes of the insulator, and total flashover occurs.
With the increase of voltage, partial arcs will enter into a stage of stability. Blue-violet partial arcs will appear on the surface of the porcelain insulator. For the whole insulator string, the development of partial arcs of each piece of porcelain insulator is relatively independent.
Bright blue-violet arcs are changed into light yellow, while the bright arcs are rotated around the axis of the porcelain insulator. A large number of small arcs get together to form the main arc and develop along the surface of the insulator. As voltage continues to increase, the partial arcs have a tendency to through the surface of an insulator, when they cross 70% creepage distance of the insulator, porcelain insulator string flashover.
Figure 3A shows a typical waveform of LC obtained at the test. Figures 3B–D show the frequency spectrum of Figure 3A. The frequency components of LC were studied within 0–100 Hz, 1–4, and 4–44 kHz. With the increase of frequency, the amplitude of LC decreases gradually. The maximum value of LC at 1 kHz is only 0.04 mA, which is more than that at 1.5 kHz. The amplitude of LC is less than 0.005 mA. It is only 0.1% of the fundamental harmonic. In Figure 3A, it is obvious that there is the third, fifth, and seventh harmonics, especially the third and fifth harmonics, expect the amplitude of the fundamental harmonic at 50 Hz.
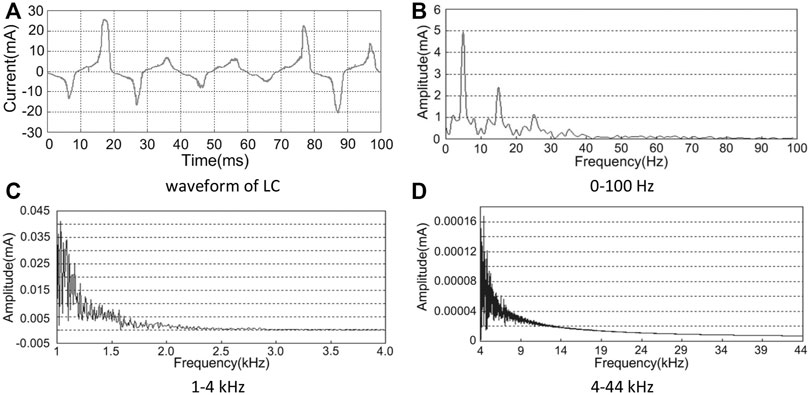
FIGURE 3. The LC waveform and its Fourier transform.
A typical LC waveform and corresponding spectrum graph are shown in Figure 4. When the porcelain insulator surface is dry or extremely low contamination degree, there is LC waveform in Figure 4A. The waveform is a sine wave, but the phase difference is larger between the voltage and the fundamental harmonic, some even meet to 90°. When the insulator surface appears weak discharge current slowly, the LC waveform begins to distortion into symmetrical triangle waveform (Figure 4B), the odd harmonic increases sharply; when the discharge becomes more obvious and intense, the triangle wave will significantly increase, the peak of the LC waveform becomes more prominent, an asymmetric waveform is formed (Figure 4C); the strong arcs almost across insulator string before flashover occurs. The characteristics of LC are mainly decided by the nature of the arcs, a long arc represents resistance. As shown in Figure 4D, resistive current will appear again, but the amplitude of LC will increase tens to hundreds of mA.
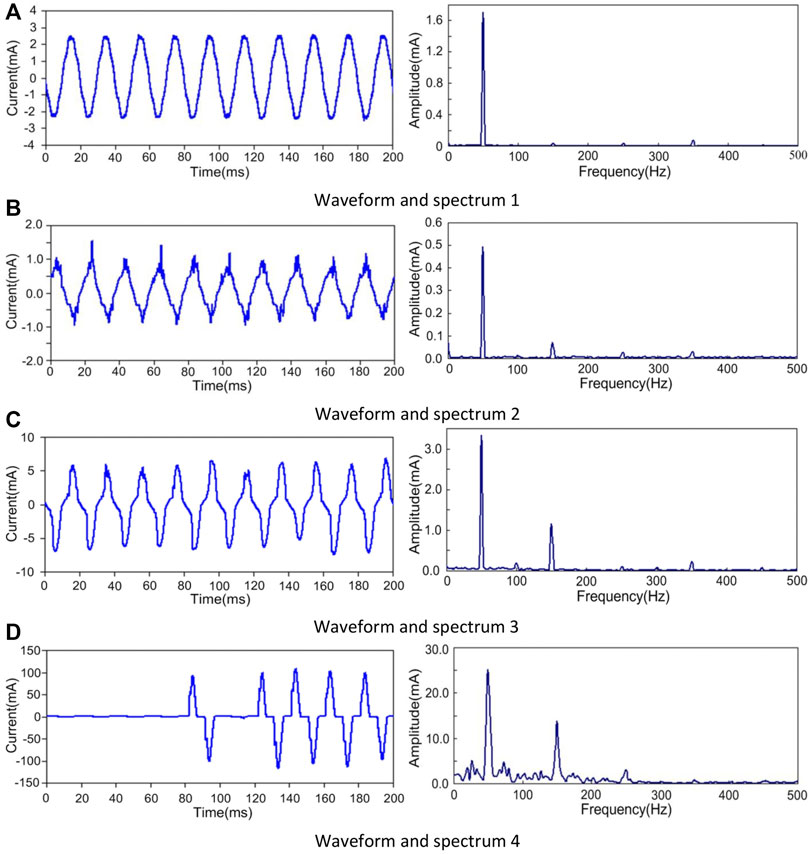
FIGURE 4. LC waveforms and frequency spectrum of different discharging strength.
The change curves of applied voltage and LC of porcelain insulator under different salt density are shown in Figure 5. With the increase of voltage, LC increases linearly, when the voltage rises to a certain value, the amplitude of LC begins to fluctuate, the value of salt density is higher, the discharge becomes more powerful and intense. The amplitude of LC increases sharply before the flashover is coming.

FIGURE 5. Curves of LC with the increasing voltage.
THD is the total harmonic distortion of LC (Khodsuz and Mizaie, 2015). The change curve of THD during loading voltage process is shown in Figure 6. The curve of THD of a clean insulator is shown in Figure 6A, the initial applied voltage is small, the LC of a clean insulator is also small, the interfering signals cause higher distortion. With the increase of voltage, the LC increases, the value of THD decreases gradually; a small number of arcs appear on the surface of the porcelain insulator. THD increases suddenly before the flashover is coming. As shown in Figures 6B,C, when the salt density is 0.1, and 0.2 mg/cm2, THD changes greatly after the pressure for more than 20 s. With the salt density increased to 0.4 mg/cm2, THD changes more intensely.
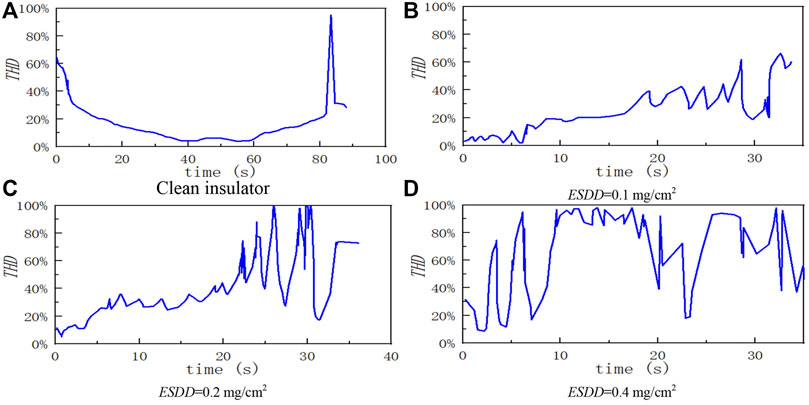
FIGURE 6. Curves of THD of insulators under different pollution conditions.
The θ is the phase difference between the applied voltage and LC. Change curves of phase difference under different salt densities are shown in Figure 7. The LC phase of clean porcelain insulators decreased gradually with the voltage increased, which decreased from 75 to 20°. The phase difference was mutated into a negative value before flashover occurs, which shows that there is a big arc, and following with insulator flashover.
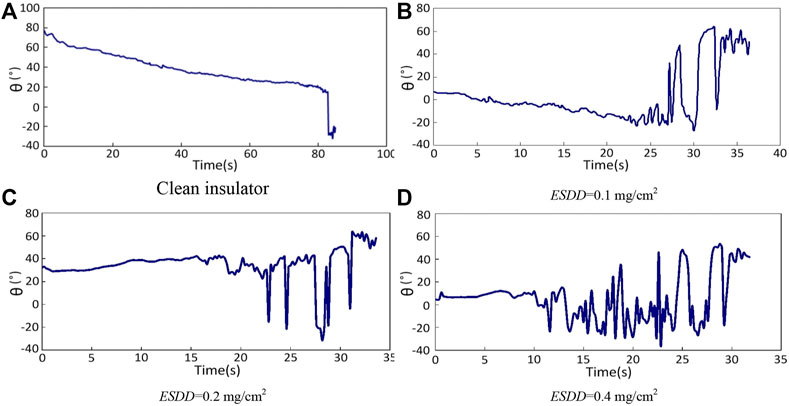
FIGURE 7. Curves of θ of LC under different ESDD.
LC contains resistive current and capacitive current, the proportion of resistive current is different from capacitive current, so the phase difference fluctuates between the positive and negative. With the increase of voltage, the porcelain insulator surface does not appear to discharge, the phase difference gradually decreases to negative, then the insulator begins to violently discharge and the phase difference begins to flounce between positive and negative.
LC fundamental harmonic, the third harmonic, the fifth harmonic, and the rate of total harmonic and the phase difference of the fundamental harmonic has carried on the correlation analysis.
From Table 2 to Table 3, the correlation coefficient between the amplitude of LC and fundamental harmonic, the third harmonic, and the fifth harmonic is more than 0.800. The amplitude of the LC can be used to represent the fundamental wave, third, and fifth harmonic; current amplitude has a low correlation with θ, the maximum value is only −0.620 under four pollution levels, and all are negative. It is indicated that the value of LC is bigger. That θ is smaller; the correlation of THD and current amplitude is less than 0.44. Distortion degree of LC waveform and the value of LC lack of a strong linear relationship; there is no significant correlation between THD and θ.
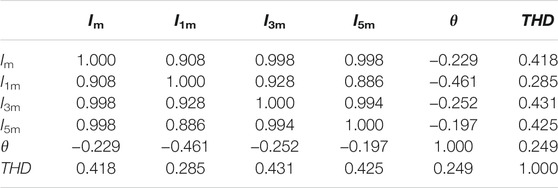
TABLE 2. The coefficient of LC eigenvalues on clean insulator.
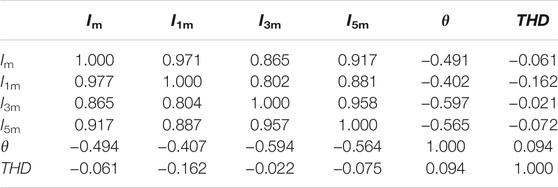
TABLE 3. The coefficient of LC eigenvalues (ESDD= 0.1 mg/cm2).
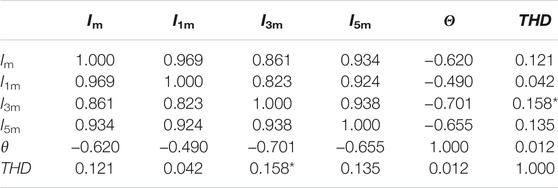
TABLE 4. The coefficient of LC eigenvalues (ESDD = 0.2 mg/cm2).
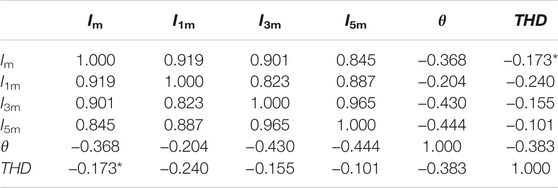
TABLE 5. The coefficient of LC eigenvalues (ESDD = 0.4 mg/cm2).
The maximum value of LC is affected by the degree of pollution. The THD represents the degree of distortion of the LC waveform; the phase difference can distinguish effectively capacitive current and resistive current. Three characteristics describe the situation of LC of porcelain insulator surface from different aspects. The waveform of LC can be characterized by three features that are current amplitude, THD, and phase difference.
As shown in Figure 8, when the flashover occurs on the surface of the porcelain insulator, the voltage drops to zero rapidly. Before the flashover, the LC did not increase sharply, arcs almost throughout the whole string of the insulator, which lasted for a long time. The waveform of LC and applied voltage is shown in Figure 9, NSDD is 1.0 mg/cm2, ESDD is 0.1, 0.2, 0.4 mg/cm2, the amplitude of LC reached more than 700 mA before flashover. The total harmonic and phase differences are small, and the LC mainly is resistive current.

FIGURE 8. The voltage and current waveform of flashover.
FIGURE 9. The voltage and current waveform of pre-flashover.
1) The correlation coefficient between the amplitude of LC and fundamental harmonic, the third harmonic, and the fifth harmonic is more than 0.800; the amplitude of the LC can be used to represent the fundamental waveform, the third harmonic, and the fifth harmonic; the correlation of THD and maximum value of LC is less than 0.44; the distortion degree of the LC waveform and the value of LC lack of a strong linear relationship; there is no significant correlation between THD and θ.
2) The maximum value of LC is affected by the degree of pollution. The THD represents the degree of distortion of LC waveform; the phase difference can distinguish effectively capacitive current and resistive current. Three characteristics describe the situation of LC of porcelain insulator surface from different aspects. The waveform of LC can be characterized by three features that are current amplitude, THD, and phase difference.
3) Test results can be used as an effective reference for porcelain insulators in pollution flashover forecasting.
The raw data supporting the conclusions of this article will be made available by the authors, without undue reservation.
C.F., J.W., and H.Y. conceived the idea and designed the experiments. C.F. and H.Y. led the experiments. Y.T., Y.C., and M.Z. contributed to data analysis and interpretation. C.F. and Y.T. wrote the paper. All authors read and approved the final manuscript.
This paper is supported by the National Natural Science Foundation of China (Grant No. 51807110).
The authors declare that the research was conducted in the absence of any commercial or financial relationships that could be construed as a potential conflict of interest.
All claims expressed in this article are solely those of the authors and do not necessarily represent those of their affiliated organizations, or those of the publisher, the editors, and the reviewers. Any product that may be evaluated in this article, or claim that may be made by its manufacturer, is not guaranteed or endorsed by the publisher.
Bashir, N., and Ahmad, H. (2010). Odd Harmonics and Third to Fifth Harmonic Ratios of Leakage Currents as Diagnostic Tools to Study the Ageing of Glass Insulators. IEEE Trans. Dielect. Electr. Insul. 17 (3), 819–832. doi:10.1109/TDEI.2010.5492255
Chandrasekar, S., Kalaivanan, C., Cavallini, A., and Montanari, G. (2009). Investigations on Leakage Current and Phase Angle Characteristics of Porcelain and Polymeric Insulator under Contaminated Conditions. IEEE Trans. Dielect. Electr. Insul. 16 (2), 574–583. doi:10.1109/TDEI.2009.4815193
Chaou, A. K., Mekhaldi, A., and Teguar, M. (2015). Recurrence Quantification Analysis as a Novel LC Feature Extraction Technique for the Classification of Pollution Severity on HV Insulator Model. IEEE Trans. Dielect. Electr. Insul. 22 (6), 3376–3384. doi:10.1109/TDEI.2015.004921
Dhahbi‐Megriche, N., and Beroual, A. (2015). Time-frequency Analyses of Leakage Current Waveforms of High Voltage Insulators in Uniform and Non‐uniform Polluted Conditions. IET Sci. Meas. Tech. 9 (8), 945–954. doi:10.1049/iet-smt.2015.0116
Douar, M., Mekhaldi, A., and Bouzidi, M. (2010). Flashover Process and Frequency Analysis of the Leakage Current on Insulator Model under Non-uniform Pollution Conditions. IEEE Trans. Dielect. Electr. Insul. 17 (4), 1284–1297. doi:10.1109/TDEI.2010.5539701
IEC (1991). Artificial Pollution Tests on High-Voltage Insulators to Be Used on A.C. Systems, IEC 60507. Available at: https://webstore.iec.ch/publication/16401.
Jiang, X., Shi, Y., Sun, C., and Zhang, Z. (2010). Evaluating the Safety Condition of Porcelain Insulators by the Time and Frequency Characteristics of LC Based on Artificial Pollution Tests. IEEE Trans. Dielect. Electr. Insul. 17 (2), 481–489. doi:10.1109/TDEI.2010.5448104
Khodsuz, M., and Mirzaie, M. (2015). Harmonics Ratios of Resistive Leakage Current as Metal Oxide Surge Arresters Diagnostic Tools. Measurement 70, 148–155. doi:10.1016/j.measurement.2015.03.048
Li, J., Caixin Sun, C., Wenxia Sima, fnm., Qing Yang, fnm., and Jianlin Hu, fnm. (2010). Contamination Level Prediction of Insulators Based on the Characteristics of Leakage Current. IEEE Trans. Power Deliv. 25 (1), 417–424. doi:10.1109/TPWRD.2009.2035426
Liu, Y., Yang, N., Dong, B., Wu, L., Yan, J., Shen, X., et al. (2020). Multi-Lateral Participants Decision-Making: A Distribution System Planning Approach with Incomplete Information Game. IEEE Access 8, 88933–88950. doi:10.1109/ACCESS.2020.2991181
Miyake, T., Seo, Y., Sakoda, T., and Otsubo, M. (2010). Relationship between Leakage Current and Pollution Deposits on the Surface of Polymeric Insulator. IEEJ Trans. FM 130 (11), 1037–1041. doi:10.1541/ieejfms.130.1037
Noman, M., Li, G., Wang, K., and Han, B. (2021). Electrical Control Strategy for an Ocean Energy Conversion System. Prot. Control. Mod. Power Syst. 6 (1), 12. doi:10.1186/s41601-021-00186-y
Pylarinos, D., Siderakis, K., and Pyrgioti, E. (2011). Measuring and Analyzing Leakage Current for Outdoor Insulators and Specimens. Rev. Adv. Mater. Sci. 29 (1), 31–53. doi:10.2217/NNM.11.108
Pylarinos, D., Theofilatos, K., Siderakis, K., Thalassinakis, E., Vitellas, I., Alexandridis, A. T., et al. (2012). Investigation and Classification of Field Leakage Current Waveforms. IEEE Trans. Dielect. Electr. Insul. 19, 2111–2118. doi:10.1109/TDEI.2012.6396971
Shen, X., Ouyang, T., Khajorntraidet, C., Li, Y., Li, S., and Zhuang, J. (2021). Mixture Density Networks-Based Knock Simulator. Ieee/asme Trans. Mechatron., 1. doi:10.1109/TMECH.2021.3059775
Shen, X., and Raksincharoensak, P. (2021b). Pedestrian-aware Statistical Risk Assessment. IEEE Trans. Intell. Transport. Syst., 1–9. doi:10.1109/TITS.2021.3074522
Shen, X., and Raksincharoensak, P. (2021a). Statistical Models of Near-Accident Event and Pedestrian Behavior at Non-signalized Intersections. J. Appl. Stat., 1–21. doi:10.1080/02664763.2021.1962263
Shen, X., Zhang, Y., Sata, K., and Shen, T. (2020). Gaussian Mixture Model Clustering-Based Knock Threshold Learning in Automotive Engines. Ieee/asme Trans. Mechatron. 25, 2981–2991. doi:10.1109/TMECH.2020.3000732
Suda, T. (2001). Frequency Characteristics of Leakage Current Waveforms of an Artificially Polluted Suspension Insulator. IEEE Trans. Dielect. Electr. Insul. 8 (4), 705–709. doi:10.1109/94.946726
Yang, N., Huang, Y., Hou, D., Liu, S., Ye, D., Dong, B., et al. (2019). Adaptive Nonparametric Kernel Density Estimation Approach for Joint Probability Density Function Modeling of Multiple Wind Farms. Energies 12, 1356. doi:10.3390/en12071356
Yang, N., Liu, S., Deng, Y., and Xing, C. (2020). An Improved Robust SCUC Approach Considering Multiple Uncertainty and Correlation. IEEJ Trans. Elec Electron. Eng. 16 (1), 21–34. doi:10.1002/tee.23265
Yang, N., Yang, C., Wu, L., Shen, X., Jia, J., Li, Z., et al. (2021). Intelligent Data-Driven Decision-Making Method for Dynamic Multi-Sequence: An E-Seq2Seq Based SCUC Expert System. IEEE Trans. Ind. Inf. 40, 1. doi:10.1109/TII.2021.3107406
Keywords: leakage current, insulator, pollution flashover, flashover voltage, transmission line
Citation: Fang C, Tao Y, Wang J, You H, Cui Y and Zhou M (2021) Research on Leakage Current Waveform Spectrum Characteristics of Artificial Pollution Porcelain Insulator. Front. Energy Res. 9:798048. doi: 10.3389/fenrg.2021.798048
Received: 19 October 2021; Accepted: 02 November 2021;
Published: 01 December 2021.
Edited by:
Yahui Zhang, Yanshan University, ChinaReviewed by:
Peng Yong, China Electric Power Research Institute, ChinaCopyright © 2021 Fang, Tao, Wang, You, Cui and Zhou. This is an open-access article distributed under the terms of the Creative Commons Attribution License (CC BY). The use, distribution or reproduction in other forums is permitted, provided the original author(s) and the copyright owner(s) are credited and that the original publication in this journal is cited, in accordance with accepted academic practice. No use, distribution or reproduction is permitted which does not comply with these terms.
*Correspondence: Yuning Tao, dGFveXVuaW5nMTJAMTYzLmNvbQ==
Disclaimer: All claims expressed in this article are solely those of the authors and do not necessarily represent those of their affiliated organizations, or those of the publisher, the editors and the reviewers. Any product that may be evaluated in this article or claim that may be made by its manufacturer is not guaranteed or endorsed by the publisher.
Research integrity at Frontiers
Learn more about the work of our research integrity team to safeguard the quality of each article we publish.