 Zuohong Li1
 Zihao Xie
94% of researchers rate our articles as excellent or good
Learn more about the work of our research integrity team to safeguard the quality of each article we publish.
Find out more
ORIGINAL RESEARCH article
Front. Energy Res., 31 January 2022
Sec. Smart Grids
Volume 9 - 2021 | https://doi.org/10.3389/fenrg.2021.793686
This article is part of the Research TopicAdvanced Digital Technologies in Digitalized Smart GridView all 13 articles
Phase-shifting transformer (PST) is one of the flexible AC transmission technologies to solve the problem of uneven power transmission. Considering that PST can also be used as a regulation means for the economic operation of the system, it is necessary to study the power flow optimization of power systems with PST. In order to find a more efficient power flow optimization method, an improved genetic algorithm including a data-driven module is proposed. This method uses the deep belief network (DBN) to train the sample set of the power flow and obtains a high-precision proxy model. Then, the calculation of the DBN model replaces the traditional adaptation function calculation link which is very time-consuming due to a great quantity of AC power flow solution work. In addition, the sectional power flow reversal elimination mechanism in the genetic algorithm is introduced and appropriately co-designed with DBN to avoid an unreasonable power flow distribution of the grid section with PST. Finally, by comparing with the traditional model-driven genetic algorithm and traditional mathematical programming method, the feasibility and the validity of the method proposed in this paper are verified on the IEEE 39-node system.
With the formation of interconnection of regional power systems, the power transmission is often done through multiple parallel channels. Due to the differences in transmission distance and line parameters of these channels, the uneven distribution of the power flow in each channel will result in the restriction of the cross-section transmission capacity (Sun, 2011). Considering that the existing transmission network is very complex and mature, improving the transmission capacity of the power grid through the transformation and construction of the transmission network will be restricted by environmental conditions, economic costs, and other factors, so it is necessary to fully tap the transmission potential of the existing transmission network with the minimal investment to improve its power supply stability and reliability (Nadeem et al., 2020). Phase-shifting transformer, as a kind of power flow control equipment, has the characteristics of flexible control and large-range adjustment angle. In addition, it can respond quickly under the help of high-power electronic devices and is expected to be a daily regulation means for the economic operation of the system (Verboomen et al., 2005; Kawaura et al., 2016; Morrell and Eggebraaten., 2019). However, although the phase-shifting transformer (PST) has many advantages, it also increases the complexity of the power grid structure. It is more important that when it is necessary to perform multiple power flow calculations for the large power grid with the phase-shifting transformer to determine the best phase-shifter gear, the calculation cost is often very large. Thus, some methods to improve the power flow optimization efficiency of power systems with the phase-shifting transformer are proposed. In literature (Zhang et al., 2021), the iteration step of the affine direction is improved, and the key mapping parameters is reconfigured, which improves the efficiency of the multicenter correction interior point method. In literature (Cui et al., 2013), matrix block technology is used to reduce the calculation scale of the nonlinear primal dual interior point method, which improves the efficiency of optimization of power systems with phase-shifting transformer. However, when the scale of the power system is very large, these measures to improve the optimization efficiency are still difficult to adapt to the scale of the optimization problem. Considering the rapidity of data-driven methods, a data-driven approach will be adapted to solve this problem in this paper.
Traditional power flow optimization methods are model-driven. Model-driven optimization methods can be divided into mathematical programming methods, intelligent optimization algorithms, and hybrid methods (Liu, 2021). Common mathematical programming methods include the linear programming method (Mohamed and Venkatesh, 2019), the interior point method (Pan et al., 2018), and so on. Intelligent optimization algorithms include genetic algorithm (Ahmed et al., 2021), particle swarm optimization algorithm (Zhang et al., 2014), and so on. Hybrid methods refer to the combination or collaboration of two (or more) methods to solve an optimization problem and include PSO-sequential quadratic programming (Victoire and Jeyakumar, 2004), seeker optimization algorithm-SQP (Sivasubramani and Swarup, 2010), and so on. However, the model-driven optimization method has obvious bottlenecks in computational efficiency, so the data-driven power flow optimization method has recently aroused the research interest of many scholars due to its high computation efficiency. The data-driven optimization methods can be divided into two categories according to the different functions of the data drive. The first type is data-driven modeling, including deterministic modeling and uncertain modeling—for example, Van Horn et al. (2016) applies data-driven injection shift factor matrix to the optimal power flow model so that the real-time security-constrained economic dispatch of the power grid can be robust to various disturbances. Lorca and Sun (2014) and Roldan et al. (2018) respectively proposed the construction methods of data-driven polyhedron and ellipsoidal uncertainty sets. The second type is data-driven optimization decisions. Lei et al. (2021) proposed a data-driven optimal power flow method based on stacked extreme learning machine framework, which can directly obtain the optimal scheduling decision scheme of the system without the iterative process. (Liu et al., 2021) presents a novel data-driven approach based on artificial neural networks to enable fast economic dispatch in electricity–gas coupled systems by utilizing simulation data from the piecewise-linearization-based model-driven method. In a word, the purpose of the data-driven optimization method of the first type is to improve the performance of the built model rather than improve the optimization efficiency. The second one is to directly replace the flow optimization process with the neural network, which greatly reduces the time cost of the optimization. However, the mapping between the power system operation state and the optimization decision scheme is complex, especially when the system scale is large. Directly through the black box prediction, it is difficult to apply to the actual optimization decisions in a convincing way. Therefore, an alternative data-driven power flow optimization framework is proposed to balance the relationship between interpretability and optimization efficiency in this paper. We use data drive to replace the calculation of the power flow in the optimization process rather than the whole optimization process, which makes the solution results still retain the physical significance of the optimization. Our approach is still much faster than the model-driven optimization method, although it takes longer than the data-driven optimization method of the second type.
At present, the power flow (PF) calculation methods of power systems can be divided into the model-driven power flow calculation and the data-driven power flow calculation. The former mainly includes the forward–backward method (Butler-Purry, 2013), the Newton–Raphson method (Zhu and Tomsovic, 2007), and the DC power flow method (Stott et al., 2009). With the spread of massive phasor measurement units (PMUs) and supervisory control and data acquisition (SCADA) systems, the latter gradually attracted the interest of scholars. The data-driven power flow method can be divided into three categories. The method of the first type is to calculate the Jacobian matrix of high precision based on measured data (Chen et al., 2016). The method of the second type is to obtain a more accurate linearized power flow calculation model based on the measured data (Liu et al., 2019). The method of the third type uses neural network to replace AC power flow calculation to realize the faster power flow calculation (Liu and Kong, 2021). Obviously, only the third kind of method is used to improve the efficiency of power flow calculation. Therefore, this paper adopts the third method and combines the data-driven power flow calculation into the intelligent optimization algorithm to form the data-driven power flow optimization method.
In Shi et al. (2019), deep belief network (DBN) is seen to be an excellent candidate for the data-driven model, and it is a multilayer probability generation model that extracts features well. In addition, because of its good feature extraction and discrimination ability, DBN is widely used in power prediction and equipment fault diagnosis and shows better results than traditional machine learning methods in power prediction and fault diagnosis accuracy (Xu et al., 2018; Tao et al., 2020; Dong et al., 2021). Therefore, DBN is adopted as the data-driven approach of this paper.
To sum up, this paper proposes a power flow optimization method based on data-driven technology and an improved genetic algorithm for power systems with PST. The method uses DBN to train the sample set, in which the input variables are phase-shift angle, the active power of the generator, and load active and reactive power and the output variables are system loss and the power flow of the lines where the power flow reverse may occur. The calculation link of the fitness function in the genetic algorithm is replaced by the high-precision DBN model, which avoids the time-consuming problem of power flow calculation by the way of iteration and keeps a high accuracy. Moreover, in the process of genetic algorithm optimization, the introduction of the sectional power flow reversal elimination mechanism makes the solutions evolve in an effective optimization direction. So, the method proposed in this paper reduces the difficulty of power flow calculation for power systems with PST and improves the speed of power flow optimization. The main contributions of this paper are as follows:
(1) A new paradigm of data-driven power flow optimization is proposed, which improves the optimization efficiency while ensuring the optimization accuracy and has certain generalization ability.
(2) By adding state variables of optimization models into the output set of the sample of neural networks, the proposed optimization method can completely consider inequality constraints containing the state variables—for example, by adding the active power of the lines prone to power reversal into the output set of the sample, the proposed method can consider the inequality constraints about power reversal and can avoid unreasonable power flow distribution of the grid section with PST.
The structure of this article is as follows: first, Section 2 introduces the equivalent model of PST and the change in model-based PF calculation of power systems with PST. After that, Section 3 presents the power flow optimization model of systems with PST. Next, Section 4 describes the data-driven approach used to replace the traditional PF calculation and highlights the improvements to the genetic algorithm. Subsequently, Section 5 verifies the effectiveness of the proposed method on the IEEE 39-node modification system with PST by comparing it with the traditional model-driven genetic algorithm and traditional mathematical programming method. Finally, the main findings of this study are summarized with some prospects for future studies in the conclusion section.
Phase shifting transformer adjustment can generally be divided into longitudinal adjustment, lateral adjustment and oblique adjustment (Zhang, 2017). Longitudinal regulation is to adjust the amplitude of the voltage, lateral regulation is to adjust the phase of the voltage, and oblique regulation changes both the voltage amplitude and its phase.
In this paper, the discrete two-core symmetrical PST is selected as the research object, which belongs to the lateral adjustment. Its structure is shown in Figure 1.

FIGURE 1. Two-core symmetrical phase-shifting transformer structure diagram.
As can be seen from Figure 1, the structure of the controlled PST includes a series booster transformer (BT), an excitation transformer (ET) and a controller (Mehdi, 2010; Bian et al., 2012). First of all, the parallel transformer is used to obtain the terminal voltage of the branch where the PST is located. Then, according to the system’s demand, the voltage of a certain amplitude and phase angle is obtained by using the mechanical or power electronic control device. Finally, the voltage is injected into the line by the series transformer to realize the effect of regulating the voltage phase angle.
The equivalent circuit of the branch with PST is shown in Figure 2.
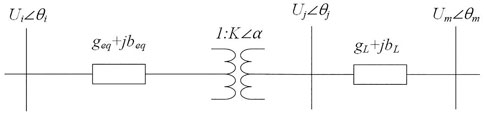
FIGURE 2. The equivalent circuit of the branch with phase-shifting transformer.
In Figure 2, Yeq = geq + jbeq represents the equivalent admittance of the PST, YL = gL + jbL represents the equivalent admittance of the line, α is the phase-shift angle, and Ui, θi, Uj, and θj represent the voltage amplitude and phase of node i and j, respectively.
In the power flow calculation of a system with PST, the node admittance matrix of the network is generally symmetrical, and a series of processing and simplifications in the PF calculation is also based on the symmetry of the node admittance matrix. However, because the ratio of PSTs is a complex number, not a scalar, the admittance of the PST branch between node i and node j, as shown in Figure 2, in an equivalent circuit form,
In details, the variable ratio of the PST is firstly removed, and the equivalent admittance becomes Yeq. Then, the injection power of node i and node j needs to be corrected. The schematic diagram of the equivalent injected power of PST is shown in Figure 3.

FIGURE 3. The schematic diagram of equivalent injected power of phase-shifting transformer.
The change of injection power of the nodes at both ends of the derived equivalent PST is as follows (Noroozian and Andersson., 1993; Papazoglou et al., 1999; Eremia et al., 2016):
where ΔPi, ΔPj, ΔQi, and ΔQj denote the injected active and reactive power of node i and node j, respectively. Moreover, θij = θi – θj, θji = θj – θi.
It is known by Equation 1 that the equivalent injection power on both sides of the PST is only related to the parameters of the PST and the voltage amplitude and phase at both ends of it. In each iteration of power flow calculation, as long as the equivalent injection power is calculated through the above-mentioned formula and added to the original injection power of the node, the power flow solution with PST can be solved as usual.
The PST changes the phase of the voltage at the installation point of it by stringing the voltage with adjustable amplitude into the transmission line so as to adjust the power flow of the transmission line. In order to better play the power flow regulation ability of PST, the power flow optimization model of power systems with PST is considered as follows (Zhang et al., 2021):
In the expression, f (x,u) is the target function, h (x,u) is an equation constraint, g (x,u) is an inequality constraint,
The objective function of this paper is the active power loss of the system. The expression is as follows:
where
The active and reactive power constraint equations are as follows:
where PGi and QGi are the active and reactive power output of the i-bus generator, respectively. PDi and QDi are the load active and reactive power of the bus i. Gij and Bij are the conductance and the susceptance of the line i–j, respectively. θij is the voltage phase difference at both ends of the line i–j.
3.3.1.1 Shift-Phase Angle
In this paper, the phase angle of PST is chosen as the control variable and limited to the range from
3.3.1.2 The Generator Active Output (MW)
The active power output of the generator, PGi, is chosen as another kind of decision-making variable. Among them,
The inequality constraints for the voltage amplitude of the load node are as follow:
where
The inequality constraints of the reactive power output of generators are as follows:
where
The inequality constraints on the transmission limit are as follow:
where
DBN is an efficient unsupervised learning algorithm stacked by a series of restricted Boltzmann machines (RBMs) and then adds a layer of back-propagation (BP) neural networks at the bottom level. The DBN topology and training process are shown in Figure 4. The DBN training process is divided into unsupervised training and fine-tuning. First of all, individually unsupervised training is given to each layer of the RBM network so as to retain feature information as much as possible when mapping the feature vectors to different feature spaces. Then, the parameters obtained from the unsupervised training phase were uses as the initial value, and the DBN was fine-tuned through BP. This process can avoid local optimization in the training process.
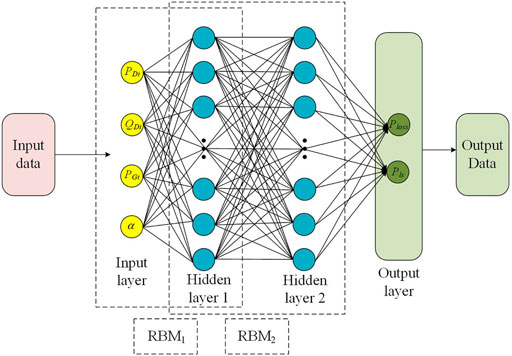
FIGURE 4. Deep belief network structure diagram.
About the structure of the DBN, this paper selects the phase-shift angle, generator active power, and active power and reactive power of the load node as input. The first two kinds of variables are the control variables. In addition, in order to characterize the operating states of the power system, the active power and reactive power of all load nodes are added to the input set of the sample. Notably, when the number of system load nodes is huge and the processing capacity of the learning model is limited, only some key load nodes or cross-section power flow and other characteristics can be selected to characterize the operation mode of the power system. The selection of a specific feature in the operation information of a power system is another interesting topic and will be further studied in the future. The DBN outputs are the active total line loss of the system expressed by Ploss, and the power flow value of the branch where the power flow reverse phenomenon may occur which is expressed by Pls.
In the face of unbalanced power in the system for PF calculation in both model-based and data-driven ways, one or more generators are generally assigned to bear the unbalanced power—for example, Mezghani et al. (2020) uses multiple generators, as an automatic generation control scheme, to bear the unbalanced power caused by uncertain factors when considering many scenarios. Liu et al. (2021) adopts a slack generator to bear the unbalanced power caused by data-driven errors. In this paper, considering that the slack generator needs to bear the unbalanced power of the system, the active power of the slack generator cannot participate in the process of power flow optimization, so the error brought by the data drive in this paper will also be borne by the slack generator as part of the unbalanced power, and the sample input set of this paper does not include the active power of the slack generator.
First, the concept of the power flow reverse is introduced. The phenomenon of power flow reverse refers to the phenomenon that the power flow direction is opposite to the positive direction assumed in advance—for example, if the power flow reverse occurs on the line i–j,
The generator area and the load area in the network structure are normally determined, and the power delivery pattern between areas through one or more cross-sections is planned and maintained according to operation rules. Thus, in this paper, the phenomenon of the power flow reverse of cross-sections or a line of a section under study is seen as abnormal, contrary to the requirement of power system operation safety—for example, when the power flow in one of the parallel lines in a cross-section is reversed, the resulting loop current/power will make the distribution of the power flow more uneven within the section and will probably lead to the phenomenon of power flow overload in the other lines. Therefore, in this paper, the active powers of the lines, where the power flow reverse may occur, are added into the output of the sample set to monitor whether power flow reverse occurs or not. In this way, the proposed optimization method can consider
The calculation link of the fitness function in the improved GA is replaced by the well-trained DBN model, which realizes the rapid calculation of the power flow optimization. The main steps of the improved genetic algorithm based on data drive are shown in Figure 5, and the implementation process is as follows:
(1) Construct a quantity of network training samples: The training samples are constructed by randomly selecting different load levels, different active power levels of generators, and different PST gears within a reasonable range. The system loss value is obtained by the calculation of formula (3) as one of the DBN output. Another DBN output is the power flow of the lines in the studied section where the power flow reverse may occur.
(2) The constructed samples are divided into training sets and test sets, which are used for DBN training and the performance testing of the post-training networks, respectively. The DBN parameters are set according to the actual system specifications.
(3) Set the GA parameters, including population size, maximum iteration number, iterative accuracy, cross-probability and variation probability, etc., and initialize the population. The genes of each chromosome consist of the active and reactive load value, the controllable generator power (MW), and the phase angle of the PST.
(4) The DBN is used to predict each individual to get the corresponding fitness value and the active powers of the lines where the power flow reverse may occur, and the power flow reversal judgment is performed on each individual. The individuals with power flow reversal are eliminated, and the others are retained or eliminated through fitness ranking.
(5) Crossover and mutation of the population to obtain the better offspring.
(6) Determine whether the end condition of GA has been met. If the maximum number of iterations or the iterative accuracy is reached, stop the iteration and output the system loss and the optimal power flow scheme, otherwise return to step (4).
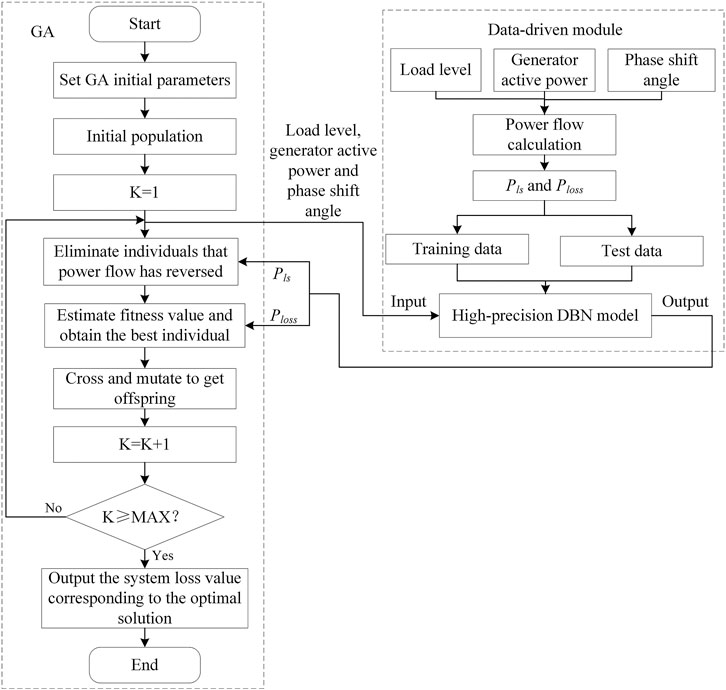
FIGURE 5. The flow chart of improved genetic algorithm based on data drive.
Notably, the main work of calculating the adaptation function is actually to calculate a power flow in the power flow optimization problem of a power system. It is very time-consuming to repeatedly calculate the power flow in the iterative process, while replacing the power flow calculation with the DBN model can greatly reduce the time cost. Therefore, as long as the learning model is guaranteed within a certain acceptable precision range, the optimization process of the algorithm can be greatly accelerated with almost no loss of optimization accuracy.
In this paper, the IEEE 39-node system is used as the simulation example, and the diagram is shown in Figure 6.
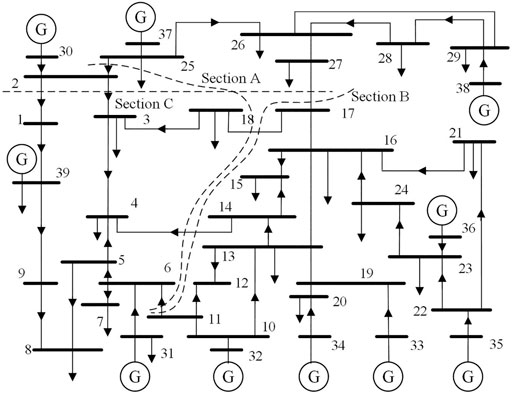
FIGURE 6. IEEE 39-node system structure diagram.
Figure 6 shows three sections of the system (Jia et al., 2010). In this paper, section B is selected for research. In order to determine the installation location of the PST, it is necessary to analyze the power flow distribution of section B, as shown in Table 1.

TABLE 1. Power flow distribution of section B.
Among them, F and T represent the starting and ending points of the branch, and P represents the active power of the line.
It should be noted that, in order to ensure that the IEEE 39-node system meets the inequality constraint (8), some parameters of the standard IEEE 39-node system are modified in this paper, and the contents of the modifications are shown in Table 2. The data in Table 1 is based on the modified IEEE 39-node system.

TABLE 2. The modified parameters of the IEEE 39-node system.
For simplicity, only one PST is considered. According to the power flow data shown in Table 1, this paper installs the PST between nodes 17 and 27. Because this branch has the smallest power flow, the PST installed on this branch can absorb the power flow of other lines in the section and improve the overall transport capacity of the section.
In order to determine the PST parameters, it is necessary to clarify the active power limit value of the 17–27 branch. This paper assumes that the active power limit value of the branch with PST is 350 MW. In addition, this paper takes [−10°, 10°] as the phase-shift angle adjustment range, and the adjacent phase-shift gears differ by 1°. According to the parameter design method of the PST in literature (Yu et al., 2013), the equivalent reactance of the PST at each tap position can be obtained. Considering that the difference of the PST equivalent reactance at different gears is very small, the equivalent reactance corresponding to the phase-shift angle of 0° is chosen as the equivalent reactance of each gear. The selected equivalent reactance of the PST is 0.04 p.u.
In this paper, BPA and MATLAB simulation software are used to automatically generate a steady-state power flow sample set, and the GA is implemented on the MATLAB platform. The test computer is configured as Intel Core i7-4790, CPU s3.2 GHz, 8 GB RAM.
According to the analysis of Section 4.1, the input of the DBN includes PDi, QDi, PGi, and α. In this paper, only one PST is installed, and the dimension of the phase-shift angle variable is one. Then, the generators 30, 32, and 33 are selected to participate in the power flow optimization process, so there are three active power variables of the generators. Considering that the sample system has only 19 load nodes, this paper selects all of the load nodes to reflect the system operation features and test the capability of the DBN, which means that there are 38 load variables of active and reactive power. Totally, the sample input amount is 42. In terms of the range of the input variables, the phase-shift angle is in the range of [−10°, 10°], while the active powers of the generators of BUS30, BUS32, and BUS33 are respectively in the range of [520 MW, 1,040 MW], [362 MW, 725 MW], and [326 MW, 652 MW]. Among them, the upper limit of the active power of each generator is derived from the example of MATPOWER (Zimmerman et al., 2011), and the lower limit is half of the upper limit according to experience. If we set the lower limit value of the active power of each generator as 0 according to the practice of MATPOWER, a large number of samples in the simulation will not converge. In addition, the active and reactive powers of each load node at the load level of 100% are shown in Table 3. Specifically, the load levels in the sample set of this paper include 95, 100, 102, and 105%, and the number of samples per load level is 1,000. So, the input dimension of the sample set is 42 × 4,000.
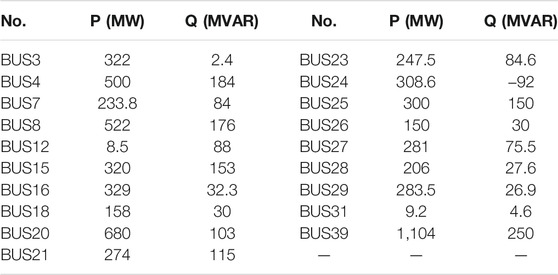
TABLE 3. The active and reactive power of each load node at the load level of 100%.
Considering that the power flow of line 17–27 is small and easy to reverse, this paper puts the active power of line 17–27 as one of the outputs of the DBN. Thus, the output of the DBN is of two dimensions: the active power of line 17–27 and the system loss. The sample set used in this paper can be found in the supplementary material.
In order to compare the prediction accuracy of DBN, in terms of system network loss, three extra common machine learning methods are used for the test: back-propagation neural network (BP), extreme learning machine (ELM), and support vector machine (SVM). In the 4,000 sample sets in Section 5.2, 3,000 samples were randomly selected as the training set and 1,000 samples as the test set. Thus, these four models are trained and tested with the same samples. The model parameters are as follows:
1) DBN: We use two hidden layers, which contain 300 and 400 hidden nodes, respectively. The momentum, learning rate, and number of RBM pre-training are chosen as 0.7, 0.03, and 100, respectively.
2) ELM: The number of hidden layer nodes is 60.
3) SVM: 4 polynomial nuclear functions are selected. The penalty function and the nucleus function coefficient is 1.5 and 10, respectively.
The predicted results of different models on the test set are shown in Figure 7. It can be seen that the DBN used in this paper has a good prediction effect on the system loss of the test set. The forecast values of DBN and the expectations (the true values) from the simulation cases are basically consistent, which can meet the application requirements of the system loss assessment. The other three common machine learning methods also show good prediction results.
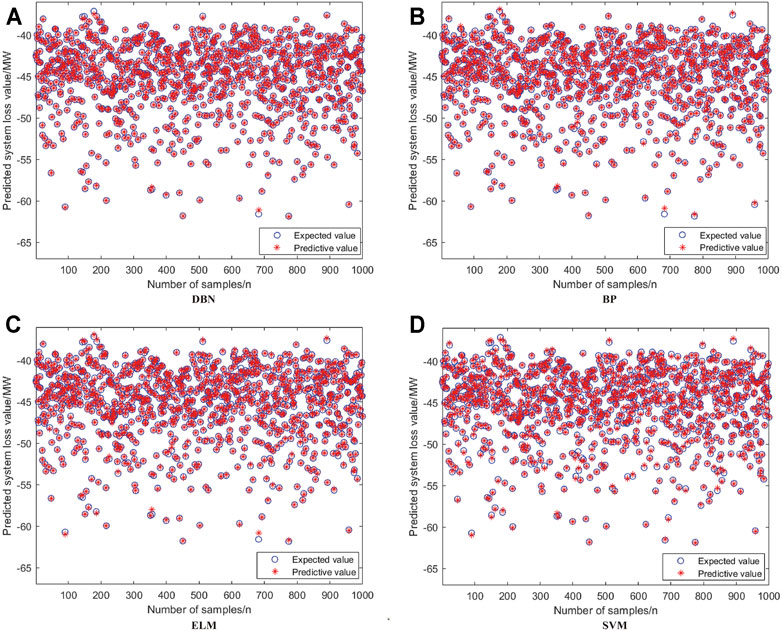
FIGURE 7. Predicted results of different models on the test set. (A) is DBN, (B) is BP, (C) is ELM, (D) is SVM.
In addition, to further compare the performance of the models, root mean square error (RMSE), mean absolute error (MAE), and determination coefficients (R2) are used (Kang et al., 2015; Mohan et al., 2018). The results of the relevant indicators are shown in Table 4. Among them, RMSE and MAE are used to evaluate the predictive ability of the model on the test samples. The smaller the value of RMSE and MAE, the better the predicting performance of the model for system loss. In addition, R2 is used to evaluate the fitting degree of the model with the test set. The closer the value is to 1, the higher the fitting degree is.
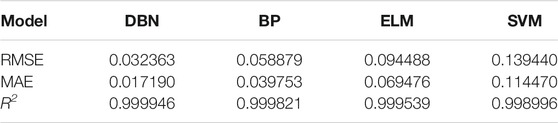
TABLE 4. Predicted results of different models on the test set.
As can be seen from Table 4, compared with BP, ELM, and SVM methods, all the indicators of DBN are leading, so DBN is recommended as the data-driven module of the GA in this paper.
The basic parameters of the GA used in this paper are as follows: the number of maximum iterations is 70, the number of variables is 4, the number of individuals is 40, the generation gap is 0.95, the crossover probability is 0.7, and the mutation probability is 0.01.
In order to test the accuracy of the data-driven GA and the generalization ability of the learning models mentioned above under different load levels of the system, we take the load levels of 93, 95, 97, 99, 101, 103, 105, and 107% for simulation. The simulation results are shown in Table 5, where the results of the model-driven genetic algorithm are regarded as true values.
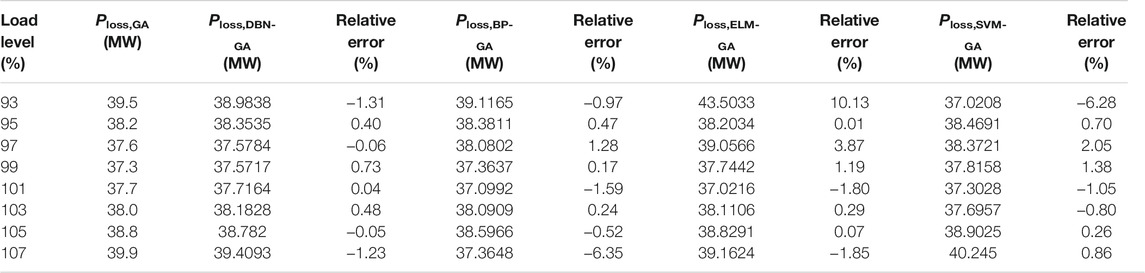
TABLE 5. Errors of the data-driven genetic algorithm (GA) and model-driven GA.
Among them, Ploss,GA represents the optimal system loss value obtained by model-driven GA. Ploss,DBN-GA, Ploss,BP-GA, Ploss,ELM-GA, and Ploss,SVM-GA respectively represent the optimal system losses obtained by different data-driven GA. The relative error is calculated as follows: (Ploss,XX-GA - Ploss,GA) / Ploss,GA, where the expression Ploss,XX-GA represents the data-driven GA.
As can be seen from Table 5, the error of DBN-based GA is smaller than those of other data-driven methods at 97, 101, and 105% load levels. Relatively, the DBN-based GA has less error than other data-driven methods. As a whole, the DBN-based GA shows a stronger generalization of different load levels of the system compared with the other data-driven GA in Table 5.
In order to verify the accuracy of data-driven optimization results, the optimization results based on DBN were substituted into BPA (Tao et al., 2013). The active power loss value based on DBN and BPA (Ploss,DBN-BPA) was compared with that based on the model-driven method (Ploss,GA), and the results are as shown in Table 6. This process is named “state recovery” (Liu et al., 2021) since it is aimed at recovering the system state based on the optimization results of the data-driven method. This approach can also help examine whether the results of the data-driven method can be applicable for practical power flow optimization.
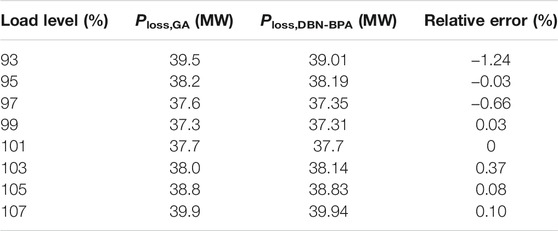
TABLE 6. Errors of the optimization results based on deep belief network (DBN) and BPA.
From the data in Table 6, the precision of the optimization results based on DBN and BPA is high enough, which means that the results of the data-driven method can be applicable for practical power flow optimization.
In order to further verify the optimization performance of the proposed method, we compared the calculation time and optimization results of different data-driven GA, the model-driven GA, and the traditional mathematical programming method at 100% load level. Considering the discrete characteristics of the PST, the power flow optimization problem of the traditional solution method is transformed into a mixed-integer second-order cone programming (MISOCP) model (Lin et al., 2019). Then, the mature optimization solver GUROBI is used to solve the problem (Lin et al., 2019). The time cost and solution results of various models are shown in Table 7. Moreover, the iteration will be terminated if the difference between the optimal objective functions of three adjacent iterations is less than 0.01 when we use the model-driven GA.
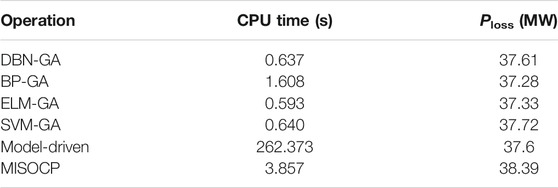
TABLE 7. Comparison of data-driven genetic algorithm (GA), model-driven GA, and MISOCP.
As can be seen from the results in Table 7, data-driven GA is significantly superior to model-driven GA and MISOCP in time consumption. By comparing the optimization results between different models, it can be seen that the data-driven GA and the model-driven GA can obtain better solutions than the traditional MISOCP algorithm, having better performance in avoiding local optimal in this case. In addition, the accuracy of DBN is the highest at 100% load level when regarding the result of model-driven GA as the truth value. In a word, although the time consumption of DBN is not the shortest, DBN is still a more appropriate choice considering the comprehensive performance of accuracy, generalization ability, and time consumption.
Through the study, it can be seen that the data-driven GA can greatly accelerate the optimization process under the premise of ensuring the optimization accuracy.
In order to verify the correctness and validity of Section 4.2, we make a simulation comparison on whether to adopt the power flow reversal elimination mechanism. The simulation example is the IEEE 39-node system with PST at the load level of 100%. The simulation results are shown in Table 8.

TABLE 8. The power flow distribution of section B with or without eliminating individuals of power flow reverse.
From the comparison of the data in Table 8, it can be seen that, compared with the practice of eliminating the individuals with power flow reversal, the uniformity of power flow distribution in each line of section B is significantly reduced without eliminating the individuals with power flow reversal. It is necessary to point out that, in the scenario studied in this paper, the power flow reverse phenomenon is more likely to occur when the phase-shift angle is in the positive interval.
1) The optimal power flow model of the power system with the phase-shifting transformer is established, and an efficient data-driven algorithm is proposed to solve it, which not only balances the optimization speed and accuracy but also has certain generalization ability for various power grid operation modes.
2) The sectional power flow reversal elimination mechanism in the genetic algorithm is introduced and appropriately co-designed with DBN to avoid the unreasonable power flow distribution of the grid section with PST.
3) Simulation examples show that the improved genetic algorithm containing data drive process proposed in this paper is effective.
The current research is aimed to optimize the power flow of power systems with PST in a certain load level range. The change of the system topology has not been considered. Therefore, how to apply the proposed method to the power flow optimization of a power system with more variable operation modes is the main topic in future works.
The original contributions presented in the study are included in the article/supplementary material, Further inquiries can be directed to the corresponding author.
All authors listed have made a substantial, direct, and intellectual contribution to the work and approved it for publication.
This research was funded by the Southern Power Grid Corporation’s Science and Technology Project (Project No. 037700KK52190015 (GDKJXM20198313)) and the Key-Area Research and Development Program of Guangdong Province (2019B111109001).
ZL, FL, RL and MY are employees of Guangdong Power Grid Corporation and a fee for service was provided to ZC, ZX and ZD for their contribution.
The remaining authors declare that the research was conducted in the absence of any commercial or financial relationships that could be construed as a potential conflict of interest.
The authors declare that this study received funding from Guangdong Power Grid Corporation. The funder had the following involvement in the study: the writing of this article and the decision to submit it for publication.
All claims expressed in this article are solely those of the authors and do not necessarily represent those of their affiliated organizations or those of the publisher, the editors, and the reviewers. Any product that may be evaluated in this article or claim that may be made by its manufacturer is not guaranteed or endorsed by the publisher.
Ahmed, M. K., Osman, M. H., Shehata, A. A., and Korovkin, N. V. (2021). “A Solution of Optimal Power Flow Problem in Power System Based on Multi Objective Particle Swarm Algorithm,” in 2021 IEEE Conference of Russian Young Researchers in Electrical and Electronic Engineering (ElConRus), St. Petersburg, Moscow, Russia, January 26-29, 2021 (IEEE), 1349–1353. doi:10.1109/ElConRus51938.2021.9396117
Bian, X., Tse, C. T., Guangyue Li, G., and Yang Fu, Y. (2012). “Study on TCPS Static and Dynamic Modeling in Power System,” in IEEE PES Conference on Innovative Smart Grid Technologies, Tianjin, China, May 21-24, 2012 (IEEE). doi:10.1109/ISGT-Asia.2012.6303267
Butler-Purry, K. (2013). Distribution System Modeling and Analysis [Book Reviews]. IEEE Power Energ. Mag. 11 (3), 106–108. doi:10.1109/MPE.2013.2245593
Chen, Y. C., Wang, J., Dominguez-Garcia, A. D., and Sauer, P. W. (2016). Measurement-based Estimation of the Power Flow Jacobian Matrix. IEEE Trans. Smart Grid 7 (5), 2507–2515. doi:10.1109/TSG.2015.2502484
Cui, Y., Chen, J., and Liu, J. (2013). Optimal Allocation of TCPS for Enhancing Transfer Capability of Electric Power Transmission Section. Shaanxi Electric Power 41 (11), 75–79+101. doi:10.3969/j.issn.1673-7598.2013.11.018
Dong, Y., Dong, Z., Zhao, T., Li, Z., and Ding, Z. (2021). Short Term Load Forecasting with Markovian Switching Distributed Deep Belief Networks. Int. J. Electr. Power Energ. Syst. 130 (1), 106942. doi:10.1016/j.ijepes.2021.106942
Eremia, M., Liu, C. C., and Edris, A. A. (2016). Advanced Solutions in Power Systems: HVDC, FACTS, and Artificial Intelligence. Hoboken, USA: IEEE Press and Wiley.
Jia, H., Mu, Y., and Yu, X. (2010). Directional Control Method to Interface Power Based on DC Power Flow and Sensitivity. Automation Electric Power Syst. 34 (2), 34–38.
Kang, B., Ku, Y. H., and Kim, Y. D. (2015). A Case Study for ANN-Based Rainfall-Runoff Model Considering Antecedent Soil Moisture Conditions in Imha Dam Watershed, Korea. Environ. Earth Sci. 74 (2), 1261–1272. doi:10.1007/s12665-015-4117-0
Kawaura, Y., Yamanouchi, S., Ichihara, M., Iwamoto, S., Suetsugu, Y., and Higashitani, T. (2016). “Phase-shifting Transformer Application to Power-Flow Adjustment for Large-Scale PV Penetration,” in 2016 IEEE Region 10 Conference (TENCON), Singapore, November 22-25, 2016 (IEEE), 3328–3331. doi:10.1109/TENCON.2016.7848668
Lei, X., Yang, Z., Yu, J., Zhao, J., Gao, Q., and Yu, H. (2021). Data-Driven Optimal Power Flow: A Physics-Informed Machine Learning Approach. IEEE Trans. Power Syst. 36 (1), 346–354. doi:10.1109/TPWRS.2020.3001919
Lin, S., Yang, Z., Fan, G., Liu, M., He, S., Tang, Z., et al. (2019). A Mixed-Integer Second-Order Cone Programming Algorithm for the Optimal Power Distribution of AC-DC Parallel Transmission Channels. Energies 12 (19), 3605. doi:10.3390/en12193605
Liu, G. (2021). Modeling and Solution Research on Dynamic Economic Dispatch of Power System with Wind Power. Master’s thesis/dissertation. Beijing(China): North China Electric Power University.
Liu, H., ShenGuo, X. Q., and Sun, H. (2021). A Data-Driven Approach towards Fast Economic Dispatch in Electricity–Gas Coupled Systems Based on Artificial Neural Network. Appl. Energ. 286, 116480. doi:10.1016/j.apenergy.2021.116480
Liu, X., and Kong, X. (2021). Fast Load Flow Calculation of N-2 Contingency Based on Convolutional Neural Network. Electric Power Eng. Tech. 40 (4), 95–100. doi:10.12158/j.2096-3203.2021.04.013
Liu, Y., Zhang, N., Wang, Y., Yang, J., and Kang, C. (2019). Data-Driven Power Flow Linearization: A Regression Approach. IEEE Trans. Smart Grid 10 (3), 2569–2580. doi:10.1109/TSG.2018.2805169
Lorca, A., and Sun, X. A. (2015). Adaptive Robust Optimization with Dynamic Uncertainty Sets for Multi-Period Economic Dispatch under Significant Wind. IEEE Trans. Power Syst. 30 (4), 1702–1713. doi:10.1109/TPWRS.2014.2357714
Mehdi, P. (2010). Improvement of Transient Stability of Power System by Thyristor Controlled Phase Shifter Transformer. Am. J. Appl. Sci. 7 (11), 1495–1499. doi:10.3844/ajassp.2010.1495.1499
Mezghani, I., Misra, S., and Deka, D. (2020). Stochastic AC Optimal Power Flow: A Data-Driven Approach. Electric Power Syst. Res. 189, 106567. doi:10.1016/j.epsr.2020.106567
Mohamed, A. A., and Venkatesh, B. (2019). Line-Wise Optimal Power Flow Using Successive Linear Optimization Technique. IEEE Trans. Power Syst. 34, 2083–2092. doi:10.1109/TPWRS.2018.2881254
Mohan, N., Soman, K. P., and Sachin Kumar, S. (2018). A Data-Driven Strategy for Short-Term Electric Load Forecasting Using Dynamic Mode Decomposition Model. Appl. Energ. 232, 229–244. doi:10.1016/j.apenergy.2018.09.190
Morrell, T. J., and Eggebraaten, J. G. (2019). “Applications for Phase-Shifting Transformers in Rural Power Systems,” in 2019 IEEE Rural Electric Power Conference (REPC), Bloomington, MN, USA, April 28-May 1, 2019 (IEEE), 70–74. doi:10.1109/REPC.2019.00020
Nadeem, M., Imran, K., Khattak, A., Ulasyar, A., Pal, A., Zeb, M. Z., et al. (2020). Optimal Placement, Sizing and Coordination of FACTS Devices in Transmission Network Using Whale Optimization Algorithm. Energies 13 (3), 753–776. doi:10.3390/en13030753
Noroozian, M., and Andersson, G. (1993). Power Flow Control by Use of Controllable Series Components. IEEE Trans. Power Deliv. 8 (3), 1420–1429. doi:10.1109/61.252669
Pan, S., Jian, J., and Yang, L. (2018). A Hybrid MILP and IPM Approach for Dynamic Economic Dispatch with Valve-Point Effects. Int. J. Electr. Power Energ. Syst. 97, 290–298. doi:10.1016/j.ijepes.2017.11.004
Papazoglou, T. M., Popovic, D. P., and Mijailovic, S. V. (1999). “Phase Shifting Transformers in an Efficient Power Flow Control Method,” in International Conference on Electric Power Engineering, Budapest, Hungary, August 29-September 2, 1999 (IEEE). doi:10.1109/PTC.1999.826439
Roldan, C., Minguez, R., Garcia-Bertrand, R., and Arroyo, J. M. (2019). Robust Transmission Network Expansion Planning under Correlated Uncertainty. IEEE Trans. Power Syst. 34 (3), 2071–2082. doi:10.1109/TPWRS.2018.2889032
Shi, T., Mei, F., Lu, J., Lu, J., Pan, Y., Zhou, C., et al. (2019). Phase Space Reconstruction Algorithm and Deep Learning-Based Very Short-Term Bus Load Forecasting. Energies 12 (22), 4349–4366. doi:10.3390/en12224349
Sivasubramani, S., and Swarup, K. S. (2010). Hybrid SOA-SQP Algorithm for Dynamic Economic Dispatch with Valve-Point Effects. Energy 35 (12), 5031–5036. doi:10.1016/j.energy.2010.08.018
Stott, B., Jardim, J., and Alsac, O. (2009). DC Power Flow Revisited. IEEE Trans. Power Syst. 24 (3), 1290–1300. doi:10.1109/TPWRS.2009.2021235
Sun, W. (2011). Optimal Phase Shifter Calculation Based on Adaptive Genetic Algorithm. J. Mech. Electr. Eng. 28 (7), 901–904.
Tao, C., Wang, X., Gao, F., and Wang, M. (2020). Fault Diagnosis of Photovoltaic Array Based on Deep Belief Network Optimized by Genetic Algorithm. Chin. J. Electr. Eng. 6 (3), 106–114. doi:10.23919/CJEE.2020.000024
Tao, H., Xu, J., and Zou, W. (2013). Model Conversion from BPA to PSCAD. Electric Power Automation Equipment 33 (8), 152–156. doi:10.3969/j.issn.1006-6047.2013.08.026
Van Horn, K. E., Dominguez-Garcia, A. D., Sauer, P. W., Alejandro, D., and SauerPeter, W. (2016). Measurement-Based Real-Time Security-Constrained Economic Dispatch. IEEE Trans. Power Syst. 31 (5), 3548–3560. doi:10.1109/TPWRS.2015.2493889
Verboomen, J., Van Hertem, D., Schavemaker, P. H., Kling, W. L., and Belmans, R. (2005). Phase Shifting Transformers: Principles and Applications,” in 2005,” in International Conference on Future Power Systems, Amsterdam, Netherlands, November 18, 2005 (IEEE). doi:10.1109/FPS.2005.204302
Victoire, T. A. A., and Jeyakumar, A. E. (2004). Hybrid PSO-SQP for Economic Dispatch with Valve-Point Effect. Electric Power Syst. Res. 71 (1), 51–59. doi:10.1016/j.epsr.2003.12.017
Xu, D., Li, Z., Yang, S., Lu, Z., Zhang, H., Chen, W., et al. (2018). “A Classified Identification Deep-Belief Network for Predicting Electric-Power Load,” in 2018 2nd IEEE Conference on Energy Internet and Energy System Integration (EI2), Beijing, China, October 20-22, 2018 (IEEE). doi:10.1109/EI2.2018.8582314
Yu, H., Zhou, F., and Yang, Z. (2013). Parameter Design and Steady State Characteristic Analysis of TCPSTs in a EHV-Grid. Electric Power 46 (11), 36–41. doi:10.3969/j.issn.1004-9649.2013.11.008
Zhang, N., Zhang, K., Li, Q., Liu, J., Zhao, J., and Sun, G. (2021). Optimal Power Flow Calculation of Power System Containing TCPST Based on Improved MCCIPM. Electric Power Eng. Tech. 40 (5), 144–150. doi:10.12158/j.2096-3203.2021.05.020
Zhang, Y., Gong, D.-w., Geng, N., and Sun, X.-y. (2014). Hybrid Bare-Bones PSO for Dynamic Economic Dispatch with Valve-point Effects. Appl. Soft Comput. 18 (4), 248–260. doi:10.1016/j.asoc.2014.01.035
Zhang, Z. (2017). Application of Phase Shifting Measures in Emergency Control of Power System. Master’s thesis/dissertation. Hangzhou(China): Zhejiang University.
Zhu, Y., and Tomsovic, K. (2002). Adaptive Power Flow Method for Distribution Systems with Dispersed Generation. IEEE Trans. Power Deliv. 17 (5), 822–827. doi:10.1109/TPWRD.2002.1022810
Keywords: phase-shifting transformer, power flow optimization, genetic algorithm, data-driven, deep belief network
Citation: Li Z, Li F, Liu R, Yu M, Chen Z, Xie Z and Du Z (2022) A Data-Driven Genetic Algorithm for Power Flow Optimization in the Power System With Phase Shifting Transformer. Front. Energy Res. 9:793686. doi: 10.3389/fenrg.2021.793686
Received: 12 October 2021; Accepted: 20 December 2021;
Published: 31 January 2022.
Edited by:
Xiangjun Zeng, Changsha University of Science and Technology, ChinaReviewed by:
Wenjie Zhang, National University of Singapore, SingaporeCopyright © 2022 Li, Li, Liu, Yu, Chen, Xie and Du. This is an open-access article distributed under the terms of the Creative Commons Attribution License (CC BY). The use, distribution or reproduction in other forums is permitted, provided the original author(s) and the copyright owner(s) are credited and that the original publication in this journal is cited, in accordance with accepted academic practice. No use, distribution or reproduction is permitted which does not comply with these terms.
*Correspondence: Zhaobin Du, ZXBkdXpiQHNjdXQuZWR1LmNu
Disclaimer: All claims expressed in this article are solely those of the authors and do not necessarily represent those of their affiliated organizations, or those of the publisher, the editors and the reviewers. Any product that may be evaluated in this article or claim that may be made by its manufacturer is not guaranteed or endorsed by the publisher.
Research integrity at Frontiers
Learn more about the work of our research integrity team to safeguard the quality of each article we publish.