 Dingqing Guo1
 Daochuan Ge
- 1School of Mechanical Engineering, Shanghai Jiao Tong University, Shanghai, China
- 2China Ship Development and Design Center, Wuhan, China
- 3Institute of Nuclear Energy Safety Technology, HFIPS, Chinese Academy of Sciences, Hefei, China
Loss of power supply from the diesel generator system (DGS) after loss of offsite power (LOOP) will pose great threat to the safety of GEN-II pressurized water reactors (PWR). Therefore, it is very desirable to evaluate the DGS’s reliability. The traditional analyzing tools are limited to static approaches neglecting the dynamic sequence failure behaviors, such as reliability block diagram (RBD), static fault tree (SFT). Static reliability modeling techniques are not capable of capturing the dynamic sequence-dependent failure behaviors typically existing in NPP safety systems such as DGS, and thus often overestimate the unreliability of systems. In this paper, motivated to study the effects of sequence failure behaviors, dynamic fault tree (DFT) is applied to evaluate the reliability of the DGS of one Chinese 1000MWe Nuclear Power Plant (NPP), and an integrated two-phased Markov Chain model is also developed, which can be considered as a contribution of this article. Comparative study of DGS reliability between DFT and SFT is carried out. The results indicate that compared with the result derived from the DFT model, the unreliability of DGS calculated by SFT is greatly overestimated by about one to two orders of magnitude. Therefore, DFT has a potential to improve the economy of NPP by relaxing the overestimated unreliability of nuclear power systems.
1 Introduction
In an NPP, most active systems and equipment’ functions are dependent on uninterrupted power supply (UPS). These active systems and equipment are very important to the safety of GEN-II pressurized water reactors (PWR). To ensure the safety of the power supply, the NPP utilities often take multiple and different power sources. In normal conditions, the power supply of the NPP is provided by offsite power grid (OPG) through the primary power transmission system. When OPG or primary power transmission system fails, the NPP would disconnect the OPG and switch on electric generators (i.e., entering the island operation state). However, if the island operation is lost as well, the NPP is then powered on by the auxiliary power supply (APS). Worse still, if the APS is also lost, then the NPP will lose the alternating current (AC) power supply [i.e., loss of offsite power (LOOP)]. When the LOOP event happens, the NPP can only seek power supply from emergency diesel generator system. The demand order of the power supply of one Chinese 1000MWe PWR can be depicted by Figure 1.
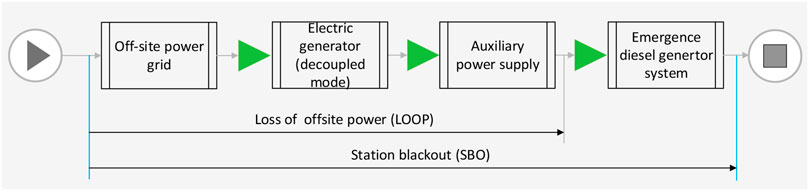
FIGURE 1. Demand order of Power supply of one Chinese 1000MWe PWR.
Station blackout (SBO) accident is well recognized as a severe accident (U.S. NRC, 1998). Once it happens, the safety of the NPP would be greatly challenged. As observed in Figure 1, while the offsite power is lost, the emergency diesel generator system becomes the last candidate. As to active safety systems relying on power supply, they are expected to operate successfully to take the NPP into a safe state after LOOP accident. Therefore, it is very important to carry out an effective reliability evaluation of the DGS after LOOP. Up to now, the reliability evaluation of DGS of NPP has caught much attention. For example, Abdul-Nour et al. (Abdul-Nour et al., 2002), studied maintenance policies for emergency diesel generators (EDG) based on probabilistic safety assessment (PSA) and reliability analysis. Lim et al. (2007) carried out a quantitative assessment of the risk effect taking into account starting time expansion of the EDG. Li (2012) made dynamic analysis of DGS after LOOP. Choi et al. (2010) evaluated the risk contribution of EDG on modified surveillance test interval (STI). Zubair et al. (Zubair and Zhijian, 2011; Zubair and Zhijian, 2013) presented some methods that are used to update the reliability data for EDG. Kančev et al. (2014a), Kančev et al. (2014b) strived to find out failure events of EDG from existing operating record data and performed statistical analysis on the collected data. The researchers mentioned above tried to apply traditional static modeling techniques to analyze the reliability of DGS [e.g., reliability block diagram (RBD) (Figiel and Sule, 1990), SFT, event tree (ET), and go-flow (Yi et al., 2018)] and did not take into account the influence of the temporal failure behaviors. In fact, failure behaviors of DGS are partly sequence-dependent, and need to be considered.
To extend the modeling capability of SFTs for capturing temporal failure behaviors of systems, DFTs were proposed by Professor Dugan JB (Dugan et al., 1992) by integrating several dynamic logic gates into static fault trees (Manian et al., 1998). Compared with traditional SFTs, DFTs can model temporal failure behaviors, such as priority-And failure, sequence enforcing failure, spares failure and functional dependent failure, and thereby can provide more exact evaluation results. To date, DFTs are extensively used for reliability assessment and risk management of industrial systems with temporal failure behaviors (YansongRen and Bechta Dugan, 1998; DurgaRao et al., 2009).
The motivation of this paper is trying to make a more accurate evaluation of the reliability of DGS in one Chinese 1000MWe PWR NPP and find out whether it is beneficial or not to apply DFT methods to analyze systems of NPP tomorrow. DGS of one Chinese 1000MWe PWR can be viewed as a two-phased mission system. In phase one, DGS is a non-repairable system in consideration of limited arrangement time, and in phase two, DGS is a repairable system due to the time permission. For reliability evaluation of phased-mission systems (PMS), several analytical methods were developed, such as phased mission system binary decision diagrams (PMS BDD) (Liudong Xing and Dugan, 2002; Xing, 2007; Li et al., 2018; Zhai et al., 2018) and Markov Chain methods (Dugan, 1991; Dugan et al., 1993). Traditional PMS BDD are only applicable for PMS without sequential failure behaviors, and Makarov Chain methods are typically applied in static PMS as well. For the DGS of one Chinese 1000MWe PWR, the features of its failure behaviors lie in: 1) Having sequential failure behaviors; 2) Component’ reparability being different at different phases, that is to say, some component is non-repairable at one phase, and becomes repairable at the other phase. To deal with this new situation and perform the reliability analysis of the DGS, in this contribution, DFTs are adopted to model DGS graphically, and then an integrated two-phased Markov Chain model and the corresponding computing algorithm were developed based on sequential failure scenarios derived from the built DFT, which are contributions of this work.
The rest of this article is structured as follows: a description of the concerned DGS is provided in Section 2. The DFT methodology is presented in Section 3. The reliability models built by DFT and SFT are shown in Section 4. The proposed integrated two-phased Markov Chain methods for the DGS with dynamic configuration are offered in Section 5. In Section 6, the reliability analysis of two-phased DGS is carried out. The Results and discussions are presented in Section 7. Finally, the conclusions and future work are pointed out in Section 8.
2 DGS Description
2.1 Overall Descriptions of Power Supply System
Figure 2 is the coarse structure scheme of the overall power supply system of one Chinese 1000MWe NPP (GEN-II PWR). The power supply system aims to ensure the permanent bus (LGB and LGC) with continuous 6.6 kV which is used to feed electricity power to the safety-dependent equipment, such as safety injection pump and residual heat removal pump. The equipment contributes much to the safety of the whole NPP.
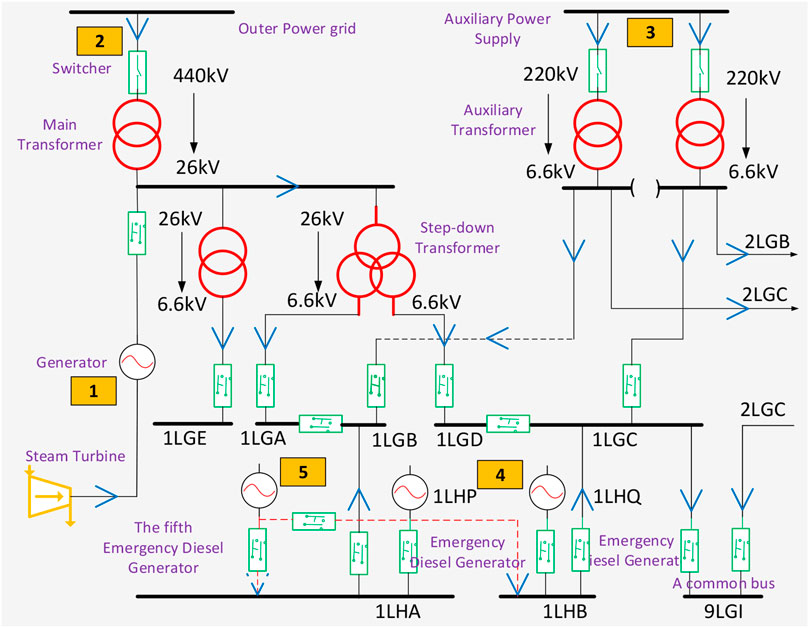
FIGURE 2. Structure scheme of power supply system in one Chinese 1000MWe NPP.
In normal conditions, the whole auxiliary equipment is powered by the primary generator (i.e. Number 1 in Figure 2) through the 26 kV bus. As the primary generators are in a down state, the 26 kV bus is transferred to the 440 kV outer power grid represented by Number 2 through the main transformer. Yet, if the outer power grid is lost neither, the auxiliary equipment is fed power by the auxiliary power supply (APS) indicated by Number 3. Given that APS also fails, the permanent bus is out of power which means the occurrence of LOOP. At the moment, the emergency bus (ILHA and 1LHB) fed by the EDGs denoted by Number four would continue to provide power supply. If the EDGs fail as well (i.e., both 1LHA and 1LHB are out of power), the SBO event would happen. In one Chinese 1000MWe NPP, to strengthen the safety of the EDG, the fifth EDG represented by Number 5 is introduced. The fifth EDG would continue to provide emergency power by a special electricity cab with extremely low failure probability when all other four EDGs fail.
2.2 Diesel Generator System
The GDS mainly comprises five diesel generators including four regular diesel generators and the fifth diesel generator. The four regular diesel generators are configured as two trains, and each train is composed of two diesel generators. The fifth diesel generator is served as the last spare. It starts if and only if the two trains are both lost. The success of DGS’s function requires at least one train to operate successfully.
2.2.1 Basic Assumptions
The basic assumptions taken in our contribution are listed as follows:
• Suppose four regular emergency diesel generators can start successfully when needed, that is to say, neglecting the demand failure.
• The mission time of the DGS is chosen as 24 hours.
• In [0, 3] hours, the DGS is assumed to be non-repairable due to limited time arrangement, and in (3, 24) hours, the DGS is allowed to take repairing actions. Hence, the DGS can be divided into two stages: non-repairable stage (0
• Once a piece of equipment fails, the maintenance action should be carried out immediately and the equipment can be perfectly recovered.
2.2.2 System Temporal Failure Behaviors
Given that the success of any diesel generators train can ensure the power supply of the NPP, the diesel generators train is always activated complying with a pre-defined order one by one. In one Chinese NPP, we suppose the train
3 Dynamic Fault Tree Methodology
3.1 Dynamic Fault Tree
DFT model is first developed by Professor Dugan JB and used to characterize dynamic sequential failure behaviors through integrating several dynamic logic gates, such as priority-And (PAND) gate, function dependent (FDEP) gate, sequence enforcing (SEQ) gate, and spare gates including cold spare (CSP) gate, warm spare (WSP). The graphic symbols of these dynamic gates with two input events are shown in Figure 3.
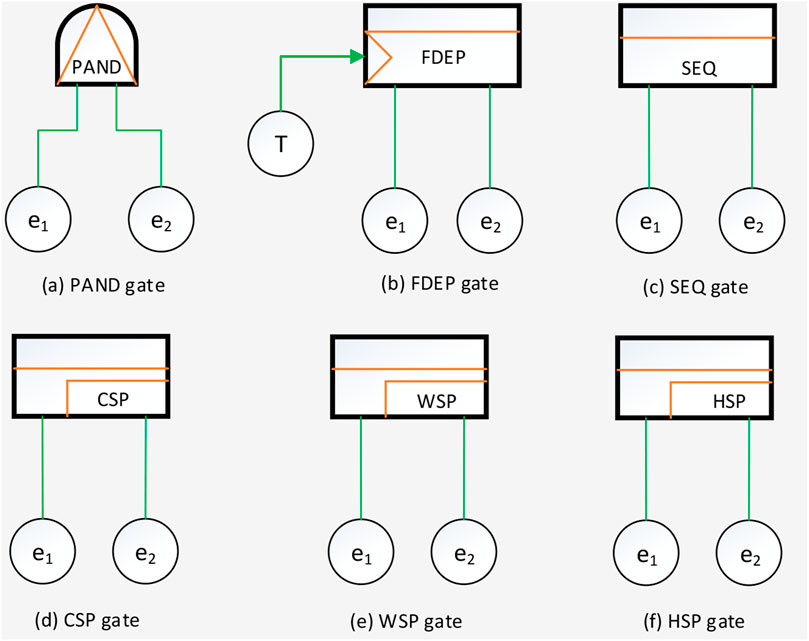
FIGURE 3. Dynamic gates: (A) PAND gate; (B) FDEP gate; (C) SEQ gate; (D) CSP gate; (E) WSP gate; (F) HSP gate.
The failure behaviors that dynamic logic gates characterize are stated as follows (Ge et al., 2015a; Xu et al., 2021): PAND gate is a typical dynamic gate, which is used to check certain occurrence sequence of basic events. Input basic events under a PAND gate can occur at any order, but only the specific order (i.e., left to right) can fire the PAND gate. In the article, we use a special symbol “
3.2 Quantitative Analyzing Techniques
The commonly used techniques for quantitatively analyzing DFTs are combinatorial methods and state space-based Markov Chain based methods. Combinatorial approaches often refer to inclusion-exclusion principle (IEP) (Liu et al., 2007; Merle et al., 2014), sum of disjoint products (SDP) (Ge et al., 2015b; Ge et al., 2015c; Ge and Yang, 2015). In contrast with IEP, SDP methods show great merits in solving non-repairable DFTs with high computational efficiency. As to repairable DFTs, the feasible analyzing tools are state space-based Markov Chain methods.
3.2.1 SDP-Based Combinatorial Methods
In SDP-based methods, a DFT is needed to be converted into sum of disjoint products (SDP) form by applying the adapted Shannon’s decomposition theorem or improved its connecting rules (Ge et al., 2016). The resultant SDP model refers to sequential binary decision diagrams (SBDD). In a SBDD, all paths from the root node to the terminals nodes (1-terimials and 0-terminals) are mutually disjoint where 1-terminal means the failure of the system and 0-terminal means the success of the system. Each path from the root node to 1-terminal node is a failure path (1-path) which represents one failure scenario of the system. Suppose that a SBDD model contains m 1-paths (pi, i = 1, 2, m), then the unreliability of the system can be calculated by
where URsys (t) represents the unreliability of a considered system. It should be noted that, unlike in traditional static BDDs, each disjoint path in SBDD should be solved as a whole due to dependent nodes. In addition, quantifying and negating a cut sequence is also an indispensable task. Interested readers are suggested to refer to the references (Ge et al., 2015d; Ge and Yang, 2016) for more details.
3.2.2 Basic State Space-Based Markov Chain Method
In this contribution, the basic state space-based Markov Chain method refers to a discrete-state continuous-time homogenous Markov random process approach. For this method, the transition probability from system state i to j (i
where aij is used to determine the probability (aij dt) that the system will transit from state i to j (i
Then, given that Eq. 2 and 3, we can get the Chapman-Kolmogorov (C-K) differential equation as:
where the left side of Eq. 4 is the differentiation of P (t), and C-K differential equation can be solved numerically by trapezoid formula (Hosea and Shampine, 1996), Jensen method (Jensen, 1953), and other numerical integration methods.
For an illustration purpose, Figure 4 shows a Markov chain diagram for a simple system with only one component. State one is the initial normal state of the system, and state two is the failure state. a12 is the failure rate of the component, and the a21 is the repair rate of the component. Hence the system transition Matrix can be obtained as:
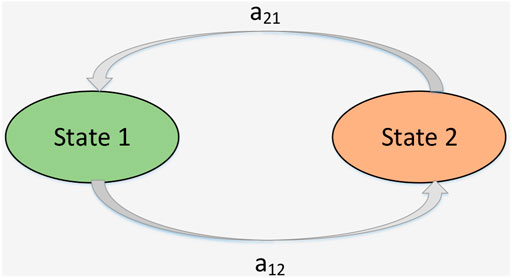
FIGURE 4. A Markov chain with two states.
Sometimes, system component is non-repairable, that is to say, a21 = 0, and the transition Matrix Q should be changed to
4 Reliability Modeling of DGS
4.1 Dynamic Fault Tree Model
According to the DGS temporal failure behaviors mentioned above in Section 2.2.2, the DFT model of the DGS is built as shown in Figure 5. As observed in Figure 5, in 0
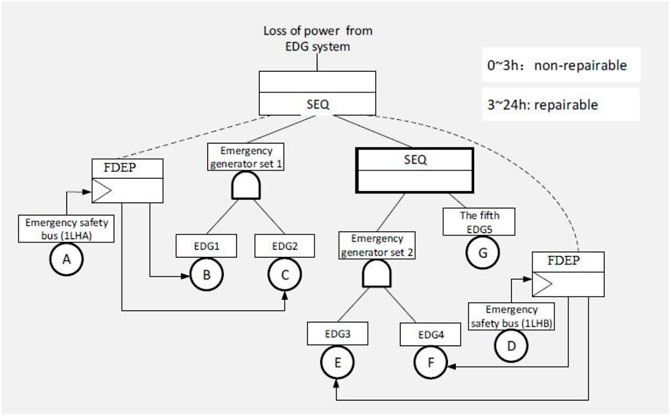
FIGURE 5. DFT model of the DGS.
4.2 Static Fault Tree Model
Compared with a DFT, static fault trees (SFTs) just integrate static logic gates (OR, AND, and K/M voting gate), and cannot characterize temporal failure behaviors. In fact, SFTs logically express what combinations of basic events that can cause a system failure. The SFT of the considered DGS is modeled as shown in Figure 6. In 0
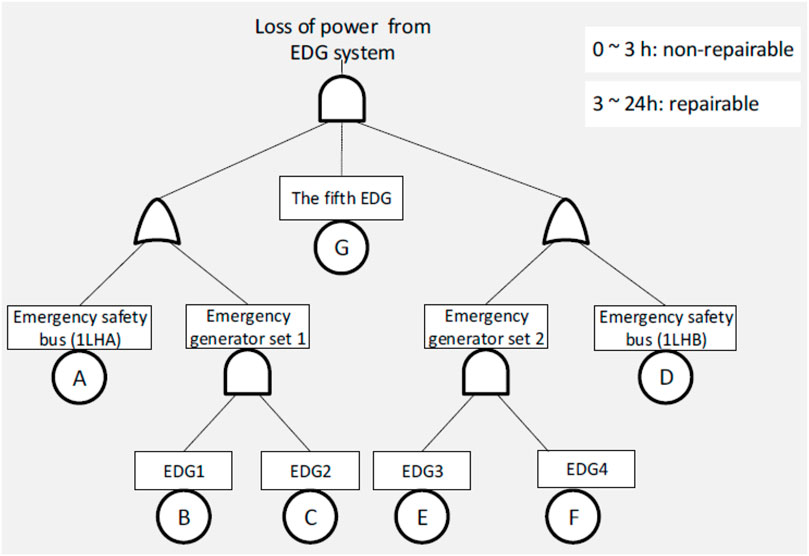
FIGURE 6. SFT model of the GDS.
5 The Proposed Integrated Two-Phased Markov Chain Method
To perform the reliability evaluation of the DGS model by the DFT shown in Figure 5, an integrated two-phased Markov Chain method is proposed in this part. Firstly, a Markov Chain model including all the DGS’s components should be built. The transition process of the Markov Chain should obey the temporal failure behaviors defined by the corresponding DFT. In other words, the fifth EDG5 cannot fail before the emergency generator set 2, and the emergency generator set 2 cannot fail before the emergency generator set 1. Besides, defining the failure states of the Markov Chain model of the DGS is also necessary. The failure states depend on not only the combination of components, but also the failure sequence of components, and they can be defined by the cut sequences derived from the built DFT.
Secondly, a computing algorithm for calculating the Markov model of the DGS should be developed. In traditional Markov Chain model, it can be calculated by C-K equation. Yet, in this contribution, considering the reparability of components in two phases is different, the transition matrices of the system states are different. In the first phase, the components are non-repairable, and hence the repair rates are zero. In the second phase, the components become repairable, and their repair rates should be set accordingly. Besides, the initial state probability vectors for both phases are different. In the first phase (0
For the integrated two-phased Markov Chain method, the C-K equations for non-repairable and repairable stages are expressed by Eq. 7 and 8 respectively,
where P (t) is the system’s state probability in the first phase;
Given the system transition matrix Q and
6 Reliability Analysis of Two-phased DGS
6.1 Phase One: Non-repairable Stage (0
The DGS components are assumed to follow exponential time-to-failure distributions, and their reliability parameters are listed in Table 1 which are referred to the reference (Li, 2012).
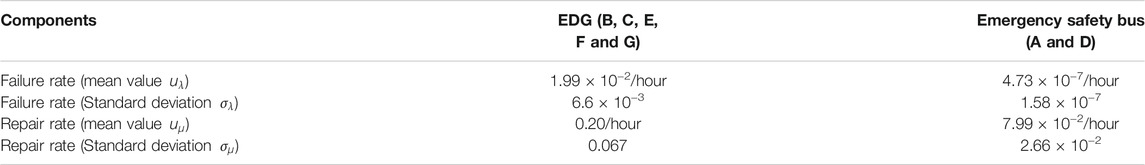
TABLE 1. Components’ reliability parameters.
In the stage of [0, 3] hours, the DGS is non-repairable. Given that DFT model of the DGS shown in Figure 5, the corresponding Markov chain model with 16 system states and 68 transitions is built as shown in Figure 7. Yet for FT model of the DGS in Figure 6, the corresponding Markov chain model with 180 system states and more than 800 transitions is also built. In the period of [0,3] hours, the DGS is considered to be non-repairable, and that is to say, the repair rates of components A, B, C, D, E, F, G are zero. The 16th state F is the failure state, in other words, the probability of the No. state p (16) is the failure probability of the DGS. Based on the Markov chain model, we can obtain the transition matrix Q, then we can use Eq. 9 to calculate the failure probability of the DGS.
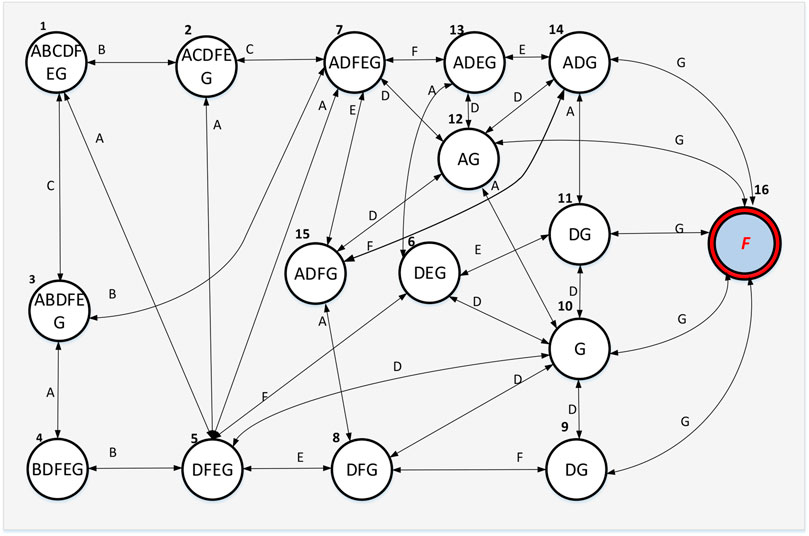
FIGURE 7. Markov chain model of the Diesel Generator system.
The unreliability of the DGS modeled in static and DFT models is derived as shown in Table2.
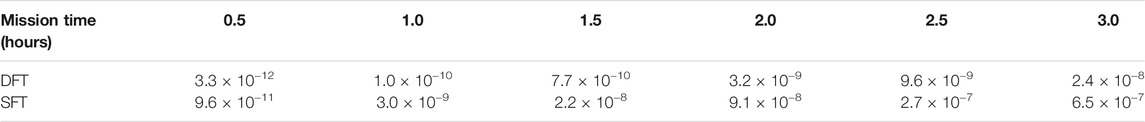
TABLE 2. Unreliability of DGS in the period of (0, 3) hours.
6.2 Phase Two: Repairable Stage (3
In the stage of (3, 24] hours, the DGS allows intervention of repair once components fail. The corresponding Markov chain model is also shown in Figure 7, and the dashed lines with two head arrows mean that the transition process is reversible, just like system can transfer from the current state to the next state due to random failure, and then a repair action can drive the system state back to the last one again. In this paper, we assume that any component can get repaired immediately once failure, and the repair action can make a failed component recover perfectly. The reliability of the DGS at the repairable stage is evaluated by applying the proposed integrated two-phased Markov Chain method.
During 3
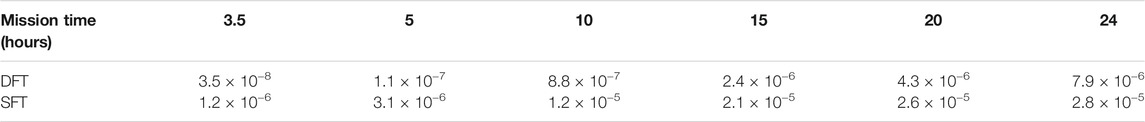
TABLE 3. Unreliability of DGS in the period of (3
7 Results and Discussions
As seen in Table 2 and Table 3, the DGS’ unreliability is very low in the time span of 0
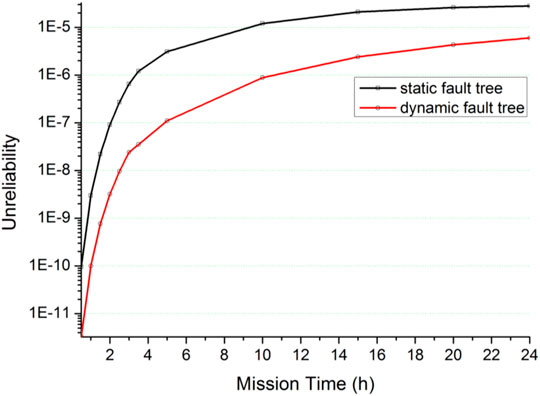
FIGURE 8. Unreliability of the DGS in the mission time of 24 h.
Considering the uncertainty of components’ failure and repair rates has a great influence on the final reliability results, uncertainty analysis for DGS’s unreliability evaluated at mission time t = 24 h is carried out in this contribution. The components’ failure and repair rates
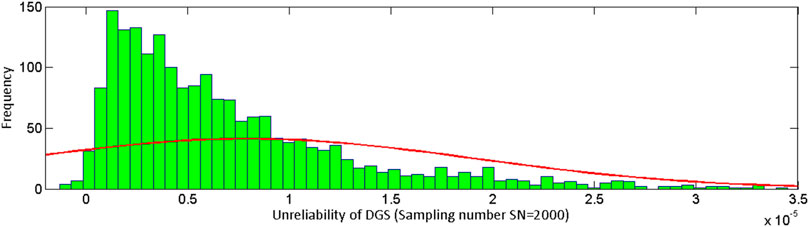
FIGURE 9. Frequency histogram for DGS unreliability (sampling number SN = 2000).
8 Conclusion and Future Work
For nuclear power and other industrial systems, temporal failure behaviors extensively exist due to redundancy design and management. Hence, it is necessary to adopt an accurate modeling technique that can reflect the real failure behaviors and give comparatively accurate reliability results. In our contribution, motivated to study the effects of sequence failure behaviors, DFT model-based reliability evaluation of the DGS after LOOP accident is implemented. Compared with traditional static fault tree models, DFTs are more accurate modeling techniques for systems having temporal failure behaviors, and hence can give reliable results. In this contribution, an integrated two-phased Markov Chain method is proposed to analyze the reliability of the DGS. The results indicate the obtained unreliability of the DGS modeled by DFT is lower than that of SFT at one to two orders of magnitude. Apparently, DFT-based method is beneficial for relaxing the overestimated unreliability of a concerned system. The proposed integrated Markov Chain method is also helpful to design more reliable systems economically in unclear power and other industrial fields in the future.
DFT-based methods are still under development. The complex systems of NPP sometimes not only have dynamic sequence failure behaviors, but also are featured in multi-state and interactions among hardware, software and human, which pose great challenges to their reliability assessments. Our ongoing work is devoted into developing a powerful modeling and analytical technique that can solve these concerned issues effectively.
Data Availability Statement
The original contributions presented in the study are included in the article/Supplementary Material, further inquiries can be directed to the corresponding author.
Author Contributions
DG conceptualized and implemented this study, and wrote the original draft; MY and HW carried out data analysis and wrote parts of the contribution; DG instructed and proposed the methodology; XC reviewed and verified the results.
Funding
This contribution was supported by National Natural Science Foundation of China (No. 71901203), National Key R & D Program of China (No. 2018YFB1900301).
Conflict of Interest
The authors declare that the research was conducted in the absence of any commercial or financial relationships that could be construed as a potential conflict of interest.
Publisher’s Note
All claims expressed in this article are solely those of the authors and do not necessarily represent those of their affiliated organizations, or those of the publisher, the editors and the reviewers. Any product that may be evaluated in this article, or claim that may be made by its manufacturer, is not guaranteed or endorsed by the publisher.
Abbreviations
AC, Alternating Current; APS, Auxiliary Power Supply; CSP, Cold Spare; DCS, Digital Control System; DFT, Dynamic Fault Tree; DGS, Diesel Generator System; EDG, Emergency Diesel Generator; FDEP, Function Dependent; LOCA, Loss of Coolant Accident; LOOP, Loss of Offsite Power; NPP, Nuclear Power Plant; OPG, Offsite Power Grid; PAND, Priority AND; PSA, Probabilistic Safety Assessment; SDP, Sum of Disjoint Products; SEQ, Sequence Enforcing; SFT, Static Fault Tree; STI, Surveillance Test Interval; UPS, Uninterrupted power supply; WSP, Warm Spare.
References
Abdul-Nour, G., Demers, M., and Vaillancourt, R. (2002). Probabilistic Safety Assessment and Reliability Based Maintenance Policies: Application to the Emergency Diesel Generators of a Nuclear Power Plant. Comput. Ind. Eng. 42, 433–438. doi:10.1016/s0360-8352(02)00038-4
Choi, S. Y., Lee, J., and Yang, J.-E. (2010). An Analysis for Risk Impact of Emergency Diesel Generator on Modified Surveillance Test Interval by Considering Failure Due to Demand Stress. Nucl. Eng. Des. 240, 3577–3581. doi:10.1016/j.nucengdes.2010.05.033
Dugan, J. B. (1991). Automated Analysis of Phased-mission Reliability. IEEE Trans. Rel. 40 (1), 45–52. doi:10.1109/24.75332
Dugan, J. B., Bavuso, S. J., and Boyd, M. A. (1992). Dynamic Fault-Tree Models for Fault-Tolerant Computer Systems. IEEE Trans. Rel. 41 (3), 363–377. doi:10.1109/24.159800
Dugan, J. B., Bavuso, S. J., and Boyd, M. A. (1993). Fault Trees and Markov Models for Reliability Analysis of Fault-Tolerant Digital Systems. Reliability Eng. Syst. Saf. 39 (3), 291–307. doi:10.1016/0951-8320(93)90005-J
Durga Rao, K., Gopika, V., Kushwaha, V. V. S. H. S., Verma, A. K., and Srividya, A. (2009). Dynamic Fault Tree Analysis Using Monte Carlo Simulation in Probabilistic Safety Assessment. Reliability Eng. Syst. Saf. 94 (4), 872–883. doi:10.1016/j.ress.2008.09.007
Figiel, K. D., and Sule, D. R. (1990). “A Generalized Reliability Block Diagram (RBD) Simulation,” in Conference on Winter Simulation, New Orleans, LA, USA, 9-12 Dec. 1990 (IEEE). doi:10.1109/WSC.1990.129574
Ge, D., Li, D., Chou, Q., Zhang, R., and Yang, Y. (2016). Quantification of Highly Coupled Dynamic Fault Tree Using IRVPM and SBDD. Qual. Reliab. Engng. Int. 32 (1), 139–151. doi:10.1002/qre.1734
Ge, D., Li, D., Lin, M., and Yang, Y.-H. (2015). SFRs-Based Numerical Simulation for the Reliability of Highly-Coupled DFTs. Eksploatacja i Niezawodnosc - Maintenance and Reliability 17 (2), 199–206. doi:10.17531/ein.2015.2.5
Ge, D., Lin, M., Yang, Y., Zhang, R., and Chou, Q. (2015). Quantitative Analysis of Dynamic Fault Trees Using Improved Sequential Binary Decision Diagrams. Reliability Eng. Syst. Saf. 142, 289–299. doi:10.1016/j.ress.2015.06.001
Ge, D., Lin, M., Yang, Y., Zhang, R., and Chou, Q. (2015). Reliability Analysis of Complex Dynamic Fault Trees Based on an Adapted K.D. Heidtmann Algorithm. Proc. Inst. Mech. Eng. O: J. Risk Reliability 229 (6), 576–586. doi:10.1177/1748006X15594694
Ge, D., and Yang, Y. (2016). Negating a Generalized Cut Sequence: Bridging the Gap between Dynamic Fault Trees Quantification and Sum of Disjoint Products Methods. Qual. Reliab. Engng. Int. 33 (2), 357–367. doi:10.1002/qre.2012
Ge, D., and Yang, Y. (2015). Reliability Analysis of Non-repairable Systems Modeled by Dynamic Fault Trees with Priority and gates. Appl. Stochastic Models Bus. Ind. 31 (6), 809–822. doi:10.1002/asmb.2108
Ge, D., Zhang, R., Chou, Q., and Yang, Y. (2015). Probabilistic Model-Based Multi-Integration Formulas for Quantifying a Generalized Minimal Cut Sequence. Proc. Inst. Mech. Eng. Part O: J. Risk Reliability 229 (1), 73–82. doi:10.1177/1748006X14552004
Hosea, M. E., and Shampine, L. F. (1996). Analysis and Implementation of TR-BDF2. Appl. Numer. Math. 20 (1–2), 21–37. doi:10.1016/0168-9274(95)00115-8
Jensen, A. (1953). Markoff Chains as an Aid in the Study of Markoff Processes. Scand. Actuarial J. 1953, 87–91. doi:10.1080/03461238.1953.10419459
Kančev, D., Duchac, A., Zerger, B., Maqua, M., and Wattrelos, D. (2014). Events Related to Emergency Diesel Generators in the Nuclear Industry: Analysis of Lessons Learned from the Operating Experience. Prog. Nucl. Energ. 75, 192–197. doi:10.1016/j.pnucene.2014.05.002
Kančev, D., Duchac, A., Zerger, B., Maqua, M., and Wattrelos, D. (2014). Statistical Analysis of Events Related to Emergency Diesel Generators Failures in the Nuclear Industry. Nucl. Eng. Des. 273, 321–331. doi:10.1016/j.nucengdes.2014.03.050
Li, X.-Y., Huang, H.-Z., and Li, Y.-F. (2018). Reliability Analysis of Phased mission System with Non-exponential and Partially Repairable Components. Reliability Eng. Syst. Saf. 175, 119–127. doi:10.1016/j.ress.2018.03.008
Li, Z. (2012). Dynamic Analysis of Diesel Generator System after Loss of Offsite Power Event Occurring in Nuclear Power Plants. Nucl. Power Eng. (in Chinese) 33 (1), 60–65. Available at: https://inis.iaea.org/search/search.aspx?orig_q=RN:45102750.
Lim, H.-G., Yang, J.-E., and Hwang, M.-J. (2007). A Quantitative Analysis of a Risk Impact Due to a Starting Time Extension of the Emergency Diesel Generator in Optimized Power Reactor-1000. Reliability Eng. Syst. Saf. 92, 961–970. doi:10.1016/j.ress.2006.07.004
Liu, D., Zhang, C., Xing, W., Li, R., and Li, H. (2007). “Quantification of Cut Sequence Set for Fault Tree Analysis,” in HPCC lecture notes in computer science, Houston, USA, September 26 - 28, 2007 (Springer-Verlag), 755–765. doi:10.1007/978-3-540-75444-2_70
Liudong Xing, L., and Dugan, J. B. (2002). Analysis of Generalized Phased-Mission System Reliability, Performance, and Sensitivity. IEEE Trans. Rel. 51 (2), 199–211. doi:10.1109/tr.2002.1011526
Manian, R., Bechta, J., and Sullivan, K. J. (1998). “Combining Various Solution Techniques for Dynamic Fault Tree Analysis of Computer Systems,” in IEEE International High-assurance Systems Engineering Symposium, Washington, DC, USA, 13-14 Nov. 1998 (IEEE). doi:10.1109/HASE.1998.731591
Merle, G., Roussel, J.-M., and Lesage, J.-J. (2014). Quantitative Analysis of Dynamic Fault Trees Based on the Structure Function. Qual. Reliab. Engng. Int. 30 (1), 143–156. doi:10.1002/qre.1487
Rauzy, A. (1993). New Algorithms for Fault Trees Analysis. Reliability Eng. Syst. Saf. 40 (3), 203–211. doi:10.1016/0951-8320(93)90060-C
Sinnamon, R. M., and Andrews, J. D. (1997). New Approaches to Evaluating Fault Trees. Reliability Eng. Syst. Saf. 58 (2), 89–96. doi:10.1016/S0951-8320(96)00036-1
U.S. NRC (1998). Rates of Initiating Events at U.S. Nuclear Power Plants: 1987-1995. NUREG/CR-5750. Washington, DC: US Nuclear Regulatory Commission. Available at: https://nrcoe.inl.gov/publicdocs/InitEvent/nureg-cr-5750.pdf.
Xing, L. (2007). Reliability Evaluation of Phased-Mission Systems with Imperfect Fault Coverage and Common-Cause Failures. IEEE Trans. Rel. 56 (1), 58–68. doi:10.1109/tr.2006.890900
Xu, Z., Guo, D., Wang, J., Li, X., and Ge, D. (2021). A Numerical Simulation Method for a Repairable Dynamic Fault Tree. EiN 23 (1), 34–41. doi:10.17531/ein.2021.1.4
Yansong Ren, Y., and Bechta Dugan, J. (1998). Design of Reliable Systems Using Static and Dynamic Fault Trees. IEEE Trans. Rel. 47 (3), 234–244. doi:10.1109/24.740491
Yi, R., Fan, D., Ma, X., Wang, Z., Feng, Q., and Yang, D. (2018). A GO-FLOW and Dynamic Bayesian Network Combination Approach for Reliability Evaluation with Uncertainty: A Case Study on a Nuclear Power Plant. IEEE Access 6, 7177–7189. doi:10.1109/ACCESS.2017.2775743
Zhai, Q., Xing, L., Peng, R., and Yang, J. (2018). Aggregated Combinatorial Reliability Model for Non-repairable Parallel Phased-mission Systems. Reliability Eng. Syst. Saf. 176, 242–250. doi:10.1016/j.ress.2018.04.017
Zubair, M., and Zhijian, Z. (2011). Reliability Data Update Method for Emergency Diesel Generator of Daya Bay Nuclear Power Plant. Ann. Nucl. Energ. 38, 2575–2580. doi:10.1016/j.anucene.2011.07.020
Keywords: reliability analysis, diesel generator system, dynamic fault tree, loss of offsite power, temporal failure
Citation: Guo D, Yang M, Wu H, Ge D and Cao X (2021) Dynamic Reliability Evaluation of Diesel Generator System of One Chinese 1000MWe NPP Considering Temporal Failure Effects. Front. Energy Res. 9:793577. doi: 10.3389/fenrg.2021.793577
Received: 12 October 2021; Accepted: 09 November 2021;
Published: 06 December 2021.
Edited by:
Mingjun Wang, Xi’an Jiaotong University, ChinaReviewed by:
Dong Li, Shanghai University of Electric Power, ChinaHongxun Hui, University of Macau, China
Copyright © 2021 Guo, Yang, Wu, Ge and Cao. This is an open-access article distributed under the terms of the Creative Commons Attribution License (CC BY). The use, distribution or reproduction in other forums is permitted, provided the original author(s) and the copyright owner(s) are credited and that the original publication in this journal is cited, in accordance with accepted academic practice. No use, distribution or reproduction is permitted which does not comply with these terms.
*Correspondence: Daochuan Ge, ZGFvY2h1YW4uZ2VAaW5lc3QuY2FzLmNu