- 1Department of Electrical Engineering, Ilam University, Ilam, Iran
- 2Department of Electrical Engineering, University of Bonab, Bonab, Iran
- 3Faculty of Civil Engineering, Technische Universität Dresden, Dresden, Germany
- 4Institute of Information Society, University of Public Service, Budapest, Hungary
- 5John von Neumann Faculty of Informatics, Obuda University, Budapest, Hungary
- 6School of Credit Management, Guangdong University of Finance, Guangzhou, China
The law of free access to the transmission network obliges the transmission network to be in orbit, and on the other hand, the high loads in the transmission network, and economic uncertainties cause that the owners of transmission companies, don’t have sufficient motivation and resources to rebuild and develop the network. The main objective of this paper is the modeling the price of emergency power transmission lines in the reserve markets. This paper presents a method for calculating the reference price that a transmission line owner uses to bid on a price in excess of the nominal capacity of the transmission line under his ownership. For this purpose, first, the effects of operating a transmission line at a power greater than the rated power are described. After that, the reduction rate of the transmission line due to operation in these conditions is calculated, and finally the price determination is calculated based on the reduction rate of the generated life. In the next stage, this excess capacity is entered the two-stage model of energy market and reservation considering renewable energy sources as a price offer function. Numerical results of 6-Shin network show that the entry of renewable energy sources reduces energy costs, but the costs of the reserve market increases due to uncertainty. However, despite the emergency capacity, these costs are reduced due to the use of cheap resources in the network.
1 Introduction
Today, due to increasing energy demand, old power plants and transmission lines no longer meet this growing need. The construction of new power plants is not economically viable due to the high costs as well as the disadvantages of using fossil fuels, such as environmental issues. On the other hand, the use of renewable energy and microgrids is highly regarded and their integration with the distribution network can be very useful in meeting this increase in energy needs. However, another problem that persists even after the use of renewable energy is the permissible load capacity of transmission lines, which has reached its maximum after the increase in energy demand, and the construction of new transmission lines due to problems such as heavy costs and a lot of time spent on the design and implementation steps, is not economical Cao et al. (2020); Lu et al. (2021); Mohammadi et al. (2021); Qu et al. (2021).
In the design of transmission lines, a constant value is determined as the line capacity to limit the power passing through it, while if the cooling conditions of the conductor such as wind speed and air temperature are appropriate, it can pass more power. It should be noted that due to the benefits of artificial intelligence, this technology can also be used to predict the capacity of transmission lines Tavoosi et al. (2021a), Tavoosi et al. (2021b). In order to solve the problem of transmission line capacity, we can use its emergency capacity, but in this case, due to the passage of additional power through the transmission lines, the temperature of these lines rises and causes damages such as loss of elastic thickness in the line Palm (2021); Pandey et al. (2021).
The aforementioned damages to the line as a result of the use of emergency capacity reduce the life of transmission lines and greatly increase the cost of investing in lines, because the cost of using additional power is considered equal to normal power. As a result, investors have no desire to invest in this area Sarwar and Siddiqui (2021). In order to encourage investors, in this paper, using the time line temperature diagram due to flow changes, the amount of loss of the line thickness phenomenon is calculated. It will be counted, then the effect of the permanent line elongation phenomenon due to the increase in temperature is calculated and finally the limit value of overcapacity is calculated.
2 Literature Review
Methods for increasing the capacity of transmission lines have been investigated in Fu et al. (2011). In Miura et al. (2009), the heat capacity of the lines is calculated by considering the worst weather conditions such as low wind speed and high ambient temperature, and is often considered a constant value for a season or a year. These conservative assumptions limit the carrying capacity of the lines when better weather conditions prevail.
At present, transmission capacity assessments are usually performed using the static thermal rating (STR) method in harsh environmental conditions. In this method, the maximum line current through harsh conditions such as low wind, high temperature, and sunlight is used as a standard for measuring the transmission capacity of the line. The need for intelligence when increasing demand and the need to increase network reliability has become an inevitable path in power network development. Dynamic thermal rating (DTR) method is an important method for use in smart networks. The technology uses measuring equipment to evaluate REAL TIME parameters along the transmission line to dynamically check the current carrying capacity in the conductor. Then, by examining the weather conditions and conductor conditions, the maximum transmission capacity is calculated Iyer and Banerjee (2021); Xu et al. (2021).
Compared to STR, DTR technology has advantages such as high accuracy, better usability of line capacity without estimating maximum conductor capacity, increased equipment performance, and increased penetration of renewable resources Song et al. (2019). In wind turbines, real time meteorological data, especially wind speed, have a direct impact on the temperature of transmission conductors, and are an important factor in determining the production capacity of these turbines. The DTR method is one of the factors affecting the transmission capacity of lines that can improve the efficiency of these systems. In Wang et al. (2018) in order to improve energy reception from the distribution network integrated with wind turbines, the effect of wind speed and direction on the grading of outlet transmission lines of wind farms by DTR method is investigated. It is observed that by using the DTR method in these turbines, the operating capacity of the power plant and consequently the grading of transmission lines is improved and used by analyzing the factors affecting the tolerable overload capacity in transmission lines to reduce load density. A computational method for integrating DTR into AC optimal load distribution problems is presented in Nick et al. (2015). In this method, linear optimal load distribution (AC OFF) AC formulas are used to define the problem. In Michiorri et al. (2015), an overview of the DTR prediction research status has been made and the aim of this work is to explain a series of complex relationships between the environment and power systems. In this study, different ways of calculating the actual current carrying capacity via DTR are described. By comparing the line capacity in STR and DTR modes, it was concluded that the conservative assumptions for calculating the current carrying capacity obtained via DTR are considerable. Is greater than the maximum seasonal power constant. The reliability of the power network in the presence of wind resources and DTR system has been investigated in Teh and Cotton (2015a). In this study, Monte Carlo simulation has been used to model the time dependence of wind power generation and DTR. Reliability model is provided for transmission lines and DTR system and ARMA model is used to model line time series rating of line and wind speed. Then, the production capacity of wind farms is modeled and in order to apply the proposed model, the relationship between wind speed and rating of lines under relations is expressed Palm and Backman (2020); Palm and Thollander (2020); Okedu and Barghash (2021).
Given that conventional strategies for determining transmission line capacity are very conservative and suitable for one or two seasons of the year, this problem can be solved using a weather-based method. This method, which is dynamic line rating (DLR) technology, measures all the unused capacities of the lines and increases the capacity of the transmission lines Bhattarai et al. (2017), Bhattarai et al. (2018). In Teh et al. (2018), a comparison between static and dynamic capacity and system standards is performed and then dynamic thermal capacity monitoring technologies are examined. The need to respond to the increasing demands of electricity while minimizing the limitation of renewable energy is the main topic of research. The use of dynamic heat capacity has many advantages over wind energy integrated with the distribution network. According to studies conducted in windy areas, the use of thermal limit and online load management system, greatly increases the efficiency of transmission lines Teh and Cotton (2015b).
3 Flow and Temperature Curves
In order to calculate the necessary parameters in the study of the effects of using more power than the rated power of transmission lines in order to price in different conditions, we must be able to extract the temperature curve over time. The temperature of a conductor changes gradually after a change in its current. This variable temperature can be calculated in overhead transmission lines using the rules of energy conservation per unit length. The result is an energy equilibrium equation that compares the difference between the heat energy input to the conductor and the energy transmitted from the conductor surface to the stored heat energy. The main heat generated in conductors is due to losses and a very small percentage is due to sunlight Aihara et al. (2016). This heat is dissipated from the conductor in two ways: convective convection with ambient air and heat radiation to the surrounding environment. A typical linear differential equation of conductor temperature is obtained as Eq. 1.
where, ml is the mass of the conductor length, Cp is the amount of heat at a constant pressure based on the type of conductor, I is the conductor current, ɛs is the amount of sunlight emitted on the outer surface of the conductor, T is the temperature of the conductor, QS_sun is the amount of solar energy per unit area. D is the diameter, h is the convective heat transfer coefficient, σ is the Stephen Boltzmann constant, and the constant E is as follows:
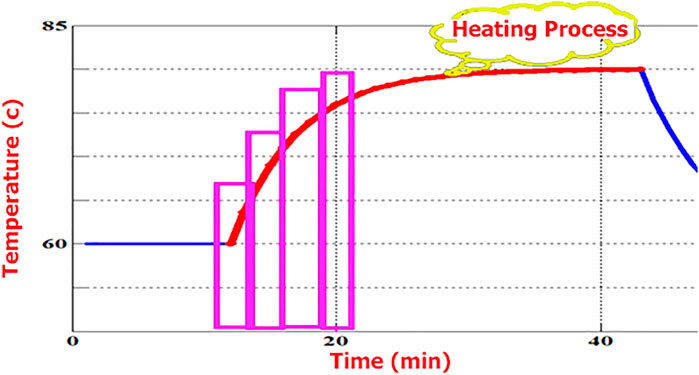
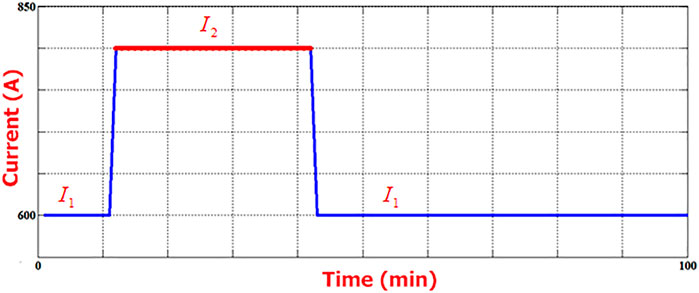
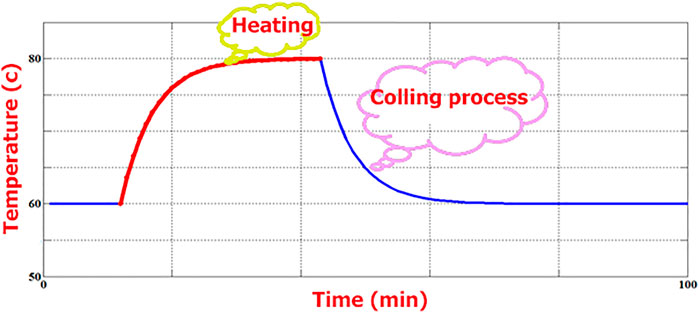
If, according to Figures 1, 2, the current of the conductor changes from a value to a step in the form of a step, the answer in Eq. 1 will be in the form of Eq. 3.
where, T1 = T (0) and T2 = T (∞).
4 Decreased Tensile Strength
Another effective factor in calculating the price of transmission line investors for the operation of conductors and lines at high temperatures is the reduction of line tensile strength. Transmission line designers typically use a safety factor to calculate the line belly. The percentage of tensile strength lost at this stage is calculated using Eq. 5.
where, Wa is the rate of loss of strength in complete heating mode. Also Ti is the temperature, txi is the cumulative time and A3, B3, and n1 are the constants presented. Then, according to Figures 3, 4, the temperature value is assumed to be constant for each time step. The size of the stairs is calculated depending on the required accuracy. It is necessary to consider steps with different sizes for each part of the chart, and therefore the algorithm used considers time steps with different sizes, and specific accuracy.
5 Inelastic Elongation
The conductors of transmission lines are exposed to a uniaxial tension, which puts pressure on the conductor, part of which causes a type of inelastic tension known as the creep phenomenon. The equation of the creep phenomenon is as follows, where σ is the amount of stress and Ec is the creep traction.
There are three trends in the creep process: primary creep, secondary or permanent creep, and tertiary creep. The tensile rate in the creep process changes over time so that it has a decreasing trend in the primary creep, a constant trend in the secondary creep and an increasing trend in the secondary creep. There is no exact model for describing each of the functions (time, stress, and temperature) in terms of each other, but many approximate models have been proposed to describe them. However, the best model to use is the curve provided by the line manufacturer.
6 Calculate the Economic Value of the Transmission Line Emergency Capacity
Now, according to the cases examined in the previous sections, we must now deal with how to calculate the economic value of the strategy capacity and transmission lines. The economic value of an emergency transmission line is determined by the amount of life loss caused by line operation in overload conditions. Factors affecting this reduction in life, which were fully described in the previous sections, i.e., the reduction of tensile strength and inelastic elongation are taken into account when calculating the economic value. The time required to create similar conditions in normal operation mode will be calculated as follows:
where, the index r represents natural conditions (nominal values). The amount of life reduction caused by each part is calculated as follows
In order to find the effective amount of life lost, the amount of previous payments made is taken into account. In this method we use the previous values of reduced life (the part that has already been paid). In this method, if the amount of reduced life due to the decrease in tensile strength (LS) is greater than the amount of life reduced due to creep (IE), the difference is deducted from the actual amount of reduced life due to IE. Conversely, if the amount of reduced life due to IE is greater than the amount of life reduced due to LS, the difference will be deducted from the actual amount of reduced life due to LS.
where in:
and
Then the maximum calculated value is selected as follows:
Now, in order to calculate the bid price, its economic efficiency can be considered by considering two effective factors, namely the parameter of reinvestment at the end of the physical life of the conductor with the symbol F, and the rate of return on investment in each period that it show with A, obtained through the following equation:
where, i is the interest rate in each period and n is the expected value of the conductor life from the current moment. This current value is determined as the operating price of the conductor at capacities higher than the rated current and will be plotted according to the duration of the emergency operation and the amount of overcurrent over the rated current.
7 Evaluate the Proposed Method
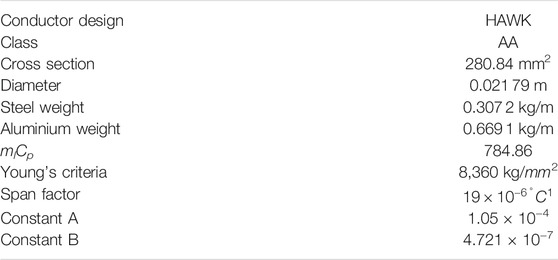
To evaluate the performance of the proposed method, we select a type of ASCR conductor that has the specifications according to Table 1. The rated current for this conductor is 600 amps (Nominal temperature for the conductor used is assumed to be 58°C). Also, the overload current varies from 700 to 800 amps and the emergency operating time varies from 2 to 60 min. The weather conditions required to calculate the temperature curve over time are given in Table 2. Now in this step we will calculate the reduction in life due to the loss of tensile strength. Also, the calculation of the total amount of tensile strength lost recursively using Eq. 3 as described in the previous sections is examined.
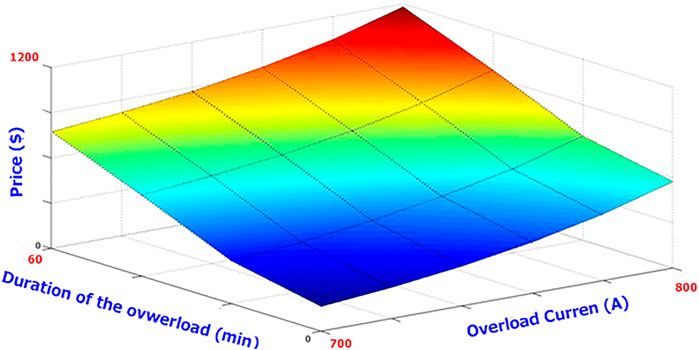
Now, using the results obtained in the previous steps and Eq. 15, the amount of effective life lost is calculated. The final economic value is then calculated using Eq. 16 and the values presented in Tables 3, 4. Price changes in terms of emergency operation time and overload flow are shown in Figure 5. Due to the calculation of the electricity market price, which is based on the price of active power per hour, the price curve should be converted to the price of each megawatt per unit time. For example, if the ACSR line in question is a 230 kV line with a power factor of 0.8, the line owner can sell 40 megawatts (equivalent to 700 amps) for a 10-min interval for $15. Another important point is that unlike the production sector in the transmission network, a fixed time can not be used. However, the idea of selling “part of the power” can be considered, which is the idea of using the advantage in periods when the line is in use, which can be in critical periods. Since distributed generation sources are the most important competitors of transmission lines today, reducing prices during peak hours is important.
8 Modeling the Emergency Capacity Price Function in the Reserve Market
In transmission lines that we want to use more than the nominal power, by installing weather remote sensors, the temperature of the lines and important measurement parameters can be transmitted to the control centers and by analyzing the data, a reasonable price can be suggested for the market. In addition, using this data, the condition of the lines can be checked instantly, and line damage and losses can be prevented. The problem of modeling the emergency capacity price function in the reservation market with respect to renewable energy sources includes an objective function which is expressed as follows:
In the above objective function, the first sentence expresses the energy production of production units, taking into account the start-up cost. The second sentence is the cost of planning the ascending and descending reservation of production units. The third sentence is the proposed cost of emergency power lines to increase capacity during the events of the second stage. The fourth sentence is the expected cost to provide security for the second stage scenarios. The resource function is the second stage of probabilistic two-stage planning. The second step represents the security cost for contingency scenarios and renewable energy sources with emergency capacity to manage scenarios.
In the expected high cost function, the first sentence is the cost of using the up/down reservation for each scenario. The second sentence is the cost of using the emergency power of the lines to make the most of the nominal power to manage the scenarios. The third sentence of the function represents the cost of forced loading in each scenario.
9 Conclusion
In this paper, due to the increasing need for energy as well as the high costs and time of construction of the power plant or the construction of new transmission lines, and due to the increasing use of renewable energy sources, the use of emergency capacity of transmission lines is proposed. However, the use of this capacity causes damages, which after examining these damages, it is concluded that the investment costs in the lines increase drastically. This paper calculates the cost of using emergency line capacity in a way that encourages investors to invest in transmission lines. To evaluate the performance of the proposed method, a type of ASCR conductor is considered. The variation of overload current, weather condition and emergency operating times are investigated, and the reducing prices during peak hours and the calculation of the total amount of tensile strength lost are recursively studied. Furthermore, the problem of modeling the emergency capacity price function in the reserve markets with respect to renewable energy sources is investigated. The results show that entry of renewable energy sources reduces energy costs, but the costs of the reserve market increases due to uncertainty. However, despite the emergency capacity, these costs are reduced due to the use of cheap resources in the network.
Data Availability Statement
Publicly available datasets were analyzed in this study. This data can be found here: Not Applicable.
Author Contributions
Study conception and design: RA, JT, AM, WG and AHM. Acquisition of data: RA, JT, AM, HI, MS, WG and A-RA. Analysis and interpretation of data: RA, JT, WG and AM. Drafting of article: RA, JT, AM, HI, MS, WG and A-RA. Critical revision: RA, JT,WG AM, and AHM.
Funding
Open Access Funding by the Publication Fund of the TU Dresden.
Conflict of Interest
The authors declare that the research was conducted in the absence of any commercial or financial relationships that could be construed as a potential conflict of interest.
Publisher’s Note
All claims expressed in this article are solely those of the authors and do not necessarily represent those of their affiliated organizations, or those of the publisher, the editors and the reviewers. Any product that may be evaluated in this article, or claim that may be made by its manufacturer, is not guaranteed or endorsed by the publisher.
References
Aihara, Y., Ito, S., Omoda, R., Yamada, T., Fujiki, S., Watanabe, T., et al. (2016). The Electrochemical Characteristics and Applicability of an Amorphous Sulfide-Based Solid Ion Conductor for the Next-Generation Solid-State Lithium Secondary Batteries. Front. Energ. Res. 4, 18. doi:10.3389/fenrg.2016.00018
Bhattarai, B. P., Gentle, J. P., Hill, P., McJunkin, T., Myers, K. S., Abbound, A., et al. (2017). “Transmission Line Ampacity Improvements of Altalink Wind Plant Overhead Tie-Lines Using Weather-Based Dynamic Line Rating,” in Prceeding of the 2017 IEEE Power & Energy Society General Meeting, Chicago, IL, USA, 16-20 July 2017 (IEEE), 1–5. doi:10.1109/PESGM.2017.8273766
Bhattarai, B. P., Gentle, J. P., McJunkin, T., Hill, P. J., Myers, K. S., Abboud, A. W., et al. (2018). Improvement of Transmission Line Ampacity Utilization by Weather-Based Dynamic Line Rating. IEEE Trans. Power Deliv. 33, 1853–1863. doi:10.1109/tpwrd.2018.2798411
Cao, K.-K., Pregger, T., Haas, J., and Lens, H. (2020). Analyzing the Future Role of Power Transmission in the European Energy System. Front. Energ. Res.
Fu, J., Morrow, D. J., Abdelkader, S., and Fox, B. (2011). “Impact of Dynamic Line Rating on Power Systems,” in Prceeding of the 2011 46th International Universities’ Power Engineering Conference (UPEC), Soest, Germany, 5-8 Sept. 2011 (VDE), 1–5.
Iyer, A. V., and Banerjee, R. (2021). “Transitions in the Indian Electricity Sector: Impacts of High Renewable Share,” in Proceedings of the 7th International Conference on Advances in Energy Research (Singapore: Springer), 1489–1500. doi:10.1007/978-981-15-5955-6_141
Lu, Z., Zhu, L., Lau, C. K. M., Isah, A. B., and Zhu, X. (2021). The Role of Economic Policy Uncertainty in Renewable Energy-Growth Nexus: Evidence from the Rossi-Wang Causality Test. Front. Energ. Res. doi:10.3389/fenrg.2021.750652
Michiorri, A., Nguyen, H.-M., Alessandrini, S., Bremnes, J. B., Dierer, S., Ferrero, E., et al. (2015). Forecasting for Dynamic Line Rating. Renew. Sustain. Energ. Rev. 52, 1713–1730. doi:10.1016/j.rser.2015.07.134
Miura, M., Satoh, T., Iwamoto, S., and Kurihara, I. (2009). Application of Dynamic Rating to Increase the Available Transfer Capability. Elect. Eng. Jpn. 166, 40–47. doi:10.1002/eej.20537
Mohammadi, F., Mohammadi-Ivatloo, B., Gharehpetian, G. B., Ali, M. H., Wei, W., Erdinç, O., et al. (2021). Robust Control Strategies for Microgrids: A Review. IEEE Syst. J. doi:10.1109/jsyst.2021.3077213
Nick, M., Mousavi, O. A., Cherkaoui, R., and Paolone, M. (2015). “Integration of Transmission Lines Dynamic thermal Rating into Real-Time Optimal Dispatching of Power Systems,” in Prceeding of the 2015 50th International Universities Power Engineering Conference (UPEC), Stoke on Trent, UK, 1-4 Sept. 2015 (IEEE), 1–6. doi:10.1109/upec.2015.7339943
Okedu, K. E., and Barghash, H. F. (2021). Enhanced Dynamic Behaviour of Grid Connected Wind Farms in Load Participation and Frequency Regulation. Front. Energ. Res. 8, 404. doi:10.3389/fenrg.2020.606019
Palm, J., and Backman, F. (2020). Energy Efficiency in Smes: Overcoming the Communication Barrier. Energy Efficiency 13, 809–821. doi:10.1007/s12053-020-09839-7
Palm, J. (2021). Exploring Limited Capacity in the Grid: Actors, Problems, and Solutions. Front. Energ. Res. 9, 199. doi:10.3389/fenrg.2021.663769
Palm, J., and Thollander, P. (2020). “Reframing Energy Efficiency in Industry: A Discussion of Definitions, Rationales, and Management Practices,” in Energy and Behaviour (Singapore: Elsevier), 153–175. doi:10.1016/b978-0-12-818567-4.00007-7
Pandey, B., Bohara, B., Pungaliya, R., Patwardhan, S. C., and Banerjee, R. (2021). A thermal comfort-driven Model Predictive Controller for Residential Split Air Conditioner. J. Building Eng. 42, 102513. doi:10.1016/j.jobe.2021.102513
Qu, Z., Li, M., Zhang, Z., Cui, M., and Zhou, Y. (2021). Dynamic Optimization Method of Transmission Line Parameters Based on Grey Support Vector Regression. Front. Energ. Res. 9, 17. doi:10.3389/fenrg.2021.634207
Sarwar, M., and Siddiqui, A. S. (2021). A Novel Approach for Optimal Allocation of Series Facts Device for Transmission Line Congestion Management. Eng. Rep. 3, e12342. doi:10.1002/eng2.12342
Song, F., Wang, Y., Zhao, L., Qin, K., Liang, L., Yin, Z., et al. (2019). Study on thermal Load Capacity of Transmission Line Based on Ieee Standard. J. Inf. Process. Syst. 15, 464–477. doi:10.3745/JIPS.04.0114
Tavoosi, J., Mohammadzadeh, A., and Jermsittiparsert, K. (2021a). A Review on Type-2 Fuzzy Neural Networks for System Identification. Soft Comput. 25, 7197–7212. doi:10.1007/s00500-021-05686-5
Tavoosi, J., Suratgar, A. A., Menhaj, M. B., Mosavi, A., Mohammadzadeh, A., and Ranjbar, E. (2021b). Modeling Renewable Energy Systems by a Self-Evolving Nonlinear Consequent Part Recurrent Type-2 Fuzzy System for Power Prediction. Sustainability 13, 3301. doi:10.3390/su13063301
Teh, J., and Cotton, I. (2015a). Reliability Impact of Dynamic thermal Rating System in Wind Power Integrated Network. IEEE Trans. Reliability 65, 1081–1089. doi:10.1109/TR.2015.2495173
Teh, J., and Cotton, I. (2015b). Risk Informed Design Modification of Dynamic thermal Rating System. IET Generation, Transm. Distribution 9, 2697–2704. doi:10.1049/iet-gtd.2015.0351
Teh, J., Lai, C.-M., Muhamad, N. A., Ooi, C. A., Cheng, Y.-H., Mohd Zainuri, M. A. A., et al. (2018). Prospects of Using the Dynamic thermal Rating System for Reliable Electrical Networks: A Review. IEEE Access 6, 26765–26778. doi:10.1109/access.2018.2824238
Wang, Y., Yang, M., Liang, L., Mo, Y., and Wu, M. (2018). “Analysis on the Dtr of Transmission Lines to Improve the Utilization of Wind Power,” in Prceeding of the2018 IEEE Industry Applications Society Annual Meeting (IAS), Portland, OR, USA, 23-27 Sept. 2018 (IEEE), 1–9. doi:10.1109/ias.2018.8544525
Keywords: renewable energy, emergency capacity, reserve market, transmission lines, distribution network, machine learning
Citation: Iranmehr H, Aazami R, Tavoosi J, Shirkhani M, Azizi A-R, Mohammadzadeh A, Mosavi AH and Guo W (2022) Modeling the Price of Emergency Power Transmission Lines in the Reserve Market Due to the Influence of Renewable Energies. Front. Energy Res. 9:792418. doi: 10.3389/fenrg.2021.792418
Received: 31 October 2021; Accepted: 13 December 2021;
Published: 13 January 2022.
Edited by:
Rakibuzzaman Shah, Federation University Australia, AustraliaReviewed by:
Javid Khorasani, Khorasan Institute of Higher Education, IranNarottam Das, Central Queensland University, Australia
Copyright © 2022 Iranmehr, Aazami, Tavoosi, Shirkhani, Azizi, Mohammadzadeh, Mosavi and Guo. This is an open-access article distributed under the terms of the Creative Commons Attribution License (CC BY). The use, distribution or reproduction in other forums is permitted, provided the original author(s) and the copyright owner(s) are credited and that the original publication in this journal is cited, in accordance with accepted academic practice. No use, distribution or reproduction is permitted which does not comply with these terms.
*Correspondence: Rahmat Aazami, ci5hYXphbWlAaWxhbS5hYy5pcg==; Ardashir Mohammadzadeh, YS5temFkZWhAdWJvbmFiLmFjLmly; Amir H. Mosavi, YW1pci5tb3NhdmlAbWFpbGJveC50dS1kcmVzZGVuLmRl
 Hamid Iranmehr1
 Jafar Tavoosi
 Mohammadamin Shirkhani
 Amir-Reza Azizi
 Ardashir Mohammadzadeh
 Amir H. Mosavi