 Yudong Li
 Ling Tao
 Nick Nagle
 Melvin Tucker1
 Xiaowen Chen
 Erik M. Kuhn
- 1National Renewable Energy Laboratory, Catalytic Carbon Transformation and Scale Up Center, Golden, CO, United States
- 2National Renewable Energy Laboratory, Energy Systems Integration Facility Department, Golden, CO, United States
Mass production of sustainable biofuels replacing fossil fuels will significantly reduce global greenhouse gas emissions. However, biomass feedstock variability, availability, and affordability pose significant risks for the sustainable production of biofuels in biorefinery plants. To derisk the sustainable production of biofuels, this work investigates the sugar yields and production costs of four different feedstocks as well as their blends, using different pretreatment methods: deacetylation and dilute acid pretreatment (DDA) and deacetylation and mechanical refining pretreatment (DMR). We found that not only feedstock species variability, but also feedstock harvesting techniques have large impacts on both sugar yields and production costs. Single-pass harvested corn stover (SPCS) showed higher sugar yields and lower production costs than multipass harvested corn stover, followed by sorghum and switchgrass. The highest glucose yields of 91% and 95.3%, which corresponds to the lowest sugar production costs of $0.2286/lb. and $0.2490/lb., were observed for SPCS using DDA and DMR, respectively. The difference in sugar yields and production costs due to feedstock variability can be largely mitigated by increasing deacetylation severity, especially in DMR. Higher deacetylation severity resulted in decreased sugar production costs in the case of DMR in contrast to increased costs in the case of DDA. Blending switchgrass and sorghum into corn stover, which can significantly increase the feedstock availability and sustainability, resulted in sugar yields and production costs of roughly the weighted average of those derived from constituent individual feedstocks, respectively. Thus, blending feedstocks of different biomass species is a potential successful strategy for sustainable production of biofuels to replace fossil-derived fuels.
Introduction
The 2016 billion-ton report by the U.S. Department of Energy (DOE) predicts that more than 1 billion dry tons of biomass per year will be available in the United States sufficient to produce enough biofuels to displace 30% of then-current petroleum consumption (Langholtz et al., 2016). However, this prediction was not restricted by the feedstock species and its price at the plant gate. Using only one single feedstock has significant risks in feedstock availability, affordability, and sustainability for a biorefinery plant (Ray et al., 2017). For example, corn stover is proposed as the primary feedstock for biochemical biorefineries (Baral et al., 2019). Its supply and price are highly dependent on the region and climate, and this feedstock is only harvested in the fall, therefore, requiring year-round readily available storage. Blending different biomass species with different time and location dependence can reduce overall costs and improve sustainability, such as corn stover and sorghum harvested in fall and switchgrass harvested in the winter (Kuhn et al., 2020).
Different feedstocks may have different optimal pretreatment conditions to achieve maximum sugar yields due to their different chemical compositions and physiochemical properties (Kuhn et al., 2020). For example, lignin structures and composition are biomass species–dependent and can highly influence biochemical conversion of lignocellulosic biomass pretreatment and enzymatic hydrolysis processes. Even with a single biomass species, recalcitrance varies with geographic growing locations and harvesting techniques (Williams et al., 2016). For corn stover, the conventional multipass harvest system collects almost all the lowest part of the plant and emphasizes quantity rather than quality of material harvested (Johnson et al., 2010). In contrast, the single-pass harvest system only takes the upper portion of the plant (Perry, 2008; Webster, 2011).
Conversion of lignocellulosic feedstocks to sugar or ethanol in the past has been widely studied using one single biomass feedstock. A variety of pretreatment methods have been investigated to improve conversion yields, such as alkaline, acid, organic solvent, and ionic liquid pretreatment methods (Chen et al., 2012a; Chen et al., 2012b; Zhang et al., 2016; Wyman et al., 2013; Shi et al., 2011; Shi et al., 2013; Zhang et al., 2013). Deacetylation is a specific dilute alkaline pretreatment that removes almost all the acetate and most of the lignin from biomass (Chen et al., 2012a; Kuhn et al., 2016). Our previous studies (Chen et al., 2012a; Chen et al., 2012c) show that the addition of one deacetylation step before dilute acid pretreatment (deacetylation and dilute acid pretreatment, DDA), as shown in Figure 1A, significantly improves the corn stover conversion yields in enzymatic hydrolysis and fermentation. Due to the addition of a deacetylation step, the xylan hydrolysis in high solids dilute acid pretreatment increased by more than 50%, and the xylose and glucose yield during enzymatic hydrolysis increased by greater than 10% and 20%, respectively. In addition, the deacetylation step also reduces the hydrolysate toxicity during fermentation due to lower acetic acid, furfural, and 5-hydroxymethlyfurfural (HMF) concentrations in the hydrolysate slurries (Chen et al., 2012a). The ethanol yield during fermentation was increased by 7%.

FIGURE 1. Illustration of different pretreatment pathways: (A) the DDA process and (B) the DMR process.
Deacetylation and mechanical refining pretreatment (DMR), as shown in Figure 1B, uses mechanical energy to disrupt the biomass fiber structures and increase enzyme accessibility to overcome biomass recalcitrance after the deacetylation step (Chen et al., 2013; Chen et al., 2014; Chen et al., 2016a). DMR features a very simple process design, lower capital costs, lower fermentation inhibitor production, low chemical and steam usage, high sugar yields and concentrations, and readiness for commercialization through repurposing of a pulp and paper mill (Chen et al., 2016a; Chen et al., 2016b). Previous studies show that the DMR process greatly improved conversion yields for both enzymatic hydrolysis and fermentation. In addition, using corn stover in the DMR process, we were able to achieve >230 g/L monomeric sugars in enzymatic hydrolysis and >10% (v/v) ethanol in fermentation (Chen et al., 2016a).
Even though extensive studies have been done using single biomass in conversion processes, limited research is reported in understanding and optimizing the conversion of feedstock blends. The blending of feedstocks by mixing different crops increases the structural and compositional heterogeneity and can help manage the seasonal variability in feedstock supplies (Nielsen et al., 2019). Thus, the study of the pretreatment effects on feedstock blends is more challenging but with increased opportunity compared with a single biomass species (Shi et al., 2013; Shi et al., 2015). Synergistic effects were reported in SO2-catalyzed steam explosion pretreatment of steam pretreated hybrid poplar and wheat straw feedstock blend (Vera et al., 2015). The results show that blended feedstock produced 20% higher sugar yields than that produced from hybrid poplar and wheat straw alone. However, another study reports that synergistic effects were not found in the dilute acid pretreated feedstock blends of hardwood, softwood, and herbaceous feedstocks (Brodeur-Campbell et al., 2012). Instead, the results indicate that a linear interpolation can predict the blended feedstock total sugar yield within 4% based on individual feedstock performance. Similar findings were reported for DMR and DDA pretreated feedstock blends in a more detailed recent study (Kuhn et al., 2020). Both linear interpolation and nonlinear regression were used to predict blended switchgrass and corn stover feedstocks sugar yields with different blending ratios based on individual feedstock performance. The nonlinear regression showed better agreement with experimental results. However, the nonlinear contribution is rather small, and a linear interpolation model predicted sugar yields within a 4% difference compared with experimental data. Whereas previous studies focused on the feedstock variability effects on sugar yields, the economic impact of the feedstock composition on biorefinery processes needs to be studied and is much more critical in the successful application of feedstock blending strategies.
In this study, technoeconomic analysis (TEA) was conducted to compare the cost of sugars produced from different feedstocks and feedstock blends using different pretreatment methods. The following six individual and blended feedstocks were investigated in this work: single-pass corn stover (SPCS), multi-pass corn stover (MPCS), switchgrass (SW), sorghum (SG), a 60/40 bi-blend of MPCS and SPCS, and a 25/35/35/5 quad blend of MPCS/SPCS/SW/SG. The six feedstock samples were subjected to DDA or DMR pretreatment at three deacetylation severity conditions. Sugar production from the pretreated biomass slurries were conducted by enzymatic hydrolysis at an enzyme loading of 12 mg total protein/g glucan using an 80:20 mixture of Novozymes Cellic® CTec3 and HTec3.
Materials and Methods
Feedstock Materials
Four different feedstocks were processed at the DOE’s Biomass Feedstock National User Facility (BFNUF) located at the Idaho National Laboratory (INL): SPCS, MPCS, SW, and SG. All feedstocks were tub ground to pass a 25.4-mm (1-inch) screen. Hammer milling was not used to avoid fines generation. The National Renewable Energy Laboratory (NREL) further size reduced the SPCS, MPCS, and SW via knife milling (Jordan Reduction Solutions, Birmingham, AL) to pass a 19.1-mm (3/4-inch) screen. The sorghum was further size reduced to pass a 6.4-mm (1/4-inch) screen at NREL using a small knife mill (Mitts and Merrill, Lake County, FL). Two advanced feedstock blends were produced from the four feedstocks based on a least cost formulation of $84/ton feedstock from INL feedstock price calculations. One feedstock is a quad blend of four materials in the following ratios: 25/35/35/5 of MPCS/SPCS/SW/SG, and the other is a bi-blend consisting of a 60/40 mix of MPCS and SPCS, respectively.
Deacetylation
Deacetylation was performed by dilute alkali extraction in a 90-L paddle reactor that is described in our previous work (Chen et al., 2012b). A measured 5 kg (dry) of biomass was loaded into the reactor with 45 kg of NaOH solution injected into the reactor for all feedstocks and blend feedstocks. Three different deacetylation severities were controlled via NaOH loadings: 50 kg NaOH/oven dry metric ton (ODMT, or MT hereafter in this work refers to ODMT) of biomass as the low-severity deacetylation condition, 70 kg NaOH/MT of biomass as the medium-severity deacetylation condition, and 100 kg NaOH/MT of biomass as the high-severity deacetylation condition. The 50 kg NaOH/MT of biomass loading was selected for the lowest NaOH loading as it is still over the loading needed to stoichiometrically neutralize all the acetyl function groups in the biomass, allowing for partial lignin removal from the feedstock. The NaOH solutions were prepared by mixing water and appropriate amounts of NaOH in a 60-L stainless steel pressurized dispensing tank and injecting the various NaOH solutions into the reactor with the paddle agitator running at approximately 100 rpm. The NaOH solutions were transferred into the paddle reactor after the biomass was loaded. The paddle reactor was heated to the target temperature by a low-pressure steam jacket (35 psig steam supply, 15 min temperature ramp up duration). Then, the temperature of the paddle reactor was controlled at the constant target temperature by controlling the steam flow, assuming that the temperature of the biomass slurry in the reactor is in equilibrium with the vapor temperature in the reactor headspace due to assumed good mixing provided by the rotating paddles. The process temperatures are 80°C for the low-severity deacetylation condition and 92°C for the medium- and high-severity deacetylation conditions. The reaction times for all three severity deacetylation conditions were 2 h. Table 1 summarizes all three deacetylation conditions for the four feedstocks and two blends. After the deacetylation reaction reached the target amount of time, cooling water was supplied to the vessel jacket after steam shut off. The alkaline spent liquors were drained through a 10-inch screen with 2 mm wire spacing after the slurry was cooled down to 40°C–50°C. The remaining slurry (approximately 10%–15% solids) was dewatered to 30%–40% solids by a screw press (Vincent Corporation, model CP-4, Tampa, FL). The screw-pressed biomass was then stored in 15-gal barrels at 4°C prior to acid impregnation or mechanical refining. Eq. 1 is used in calculating deacetylation yields for lignin and xylose. Deacetylation yields represent the fraction of the component remains in solid form after deacetylation relative to raw materials. In Equation 1,
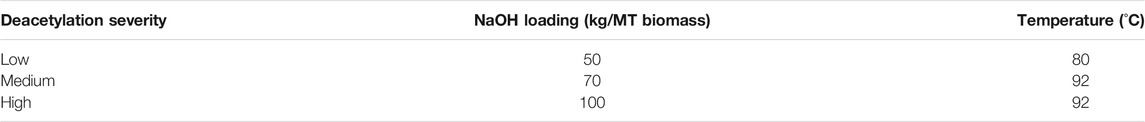
TABLE 1. Deacetylation alkali loading and temperature for all feedstock types in experiments.
Acid Impregnation
The weight and solids content of the deacetylated biomass were measured prior to acid impregnation. Then, the deacetylated feedstocks were loaded into the 90-L paddle reactor and diluted to 5 wt% solid slurries. The slurries were neutralized to pH 7 by sulfuric acid (93 wt%). After neutralization, additional sulfuric acid was added to achieve 1 wt% H2SO4 in the paddle reactor and the slurry was held for 2 h at 45°C. After acid impregnation is completed, the slurry was drained and screw-pressed to remove excess acid solution to 40%–50% solids content.
Dilute Acid Pretreatment
Pretreatment of acid-impregnated, deacetylated feedstock was performed in a 4-L batch steam explosion reactor (Chen et al., 2012c). Aliquots of 500 g of individual and blended feedstocks were loaded into the reactor and heated to the target temperature by direct steam injection. The contents were flash discharged from the reactor into a cooled flash tank after the desired reaction times at constant reaction temperature. Steam pretreatment was performed at two different conditions (150°C, 20 min and 170°C, 5 min) for each of the eight deacetylated and acid impregnated feedstocks as listed in Table 2. The pretreatment severity,
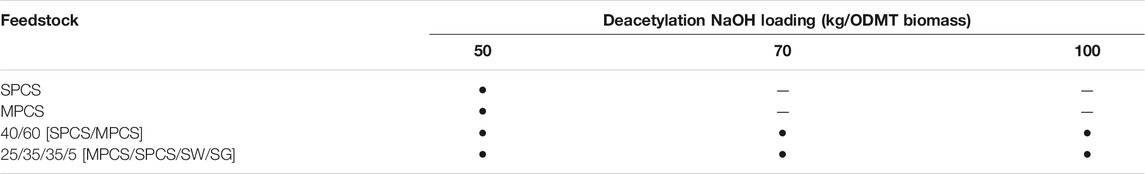
TABLE 2. Deacetylated feedstocks that also underwent DAP in the 4-L steam explosion reactor at 1% H2SO4, 150°C, 20 min and 1% H2SO4, 170°C, 5 min, an “•” indicates that DAP was performed at two conditions on that deacetylated feedstock.
Mechanical Refining
In this work, mechanical refining was conducted in two steps: Refining in a disc refiner with a second step refining in a planetary ring-roller mill. The disc refining was carried out using a 12-inch disk refiner (Sprout Waldron Koppers model 12”) equipped with type C2976 NH plates. The refining gap between rotor and stator was set close to zero (plates barely touching). The refiner energy consumption was measured by a Fluke 1735 power logger meter and expressed as the difference in kWh/MT between the refiner running water and wet deacetylated biomass.
Second step refining was carried out in a planetary ring-roller mill (The Szego Mill, SM-160 mill, Toronto, ON, Canada); the details of this apparatus and process are described in detail in our previous publications (Chen et al., 2014; Chen et al., 2016a). The energy consumption of the Szego Mill was measured to be in the range of 80–120 kWh/MT by a Fluke 1735 power logger meter with the mill running water and wet deacetylated biomass.
Enzymatic Hydrolysis
Enzymatic hydrolysis was performed in replicates in 125-ml wide-mouth polypropylene bottles (Thermo Fisher Scientific, Inc., Waltham, MA) loaded with 30 g of neutralized pretreated slurry (pH 5) at 20 wt% total solids loading (TS). To achieve homogenization of the biomass/enzyme mixing, these bottles were loaded with three stainless steel balls and rotated horizontally at 4 rpm on a three-deck roller apparatus for mini bottles (Wheaton Industries Inc., Millville, NJ) (Mohagheghi et al., 1992). The roller apparatus was placed in a general-purpose incubator (Model 1,545, VWR International, LLC, West Chester, PA) at 50°C. Novozymes cellulase, Cellic® CTec3, and hemicellulose, Cellic® HTec3, were used at enzyme loadings of 9.6 mg CTec3 and 2.4 mg HTec3 (protein basis) per gram of cellulose. The protein concentrations were measured using the method described in our previous work (Chen et al., 2012a). The enzymatic hydrolysis experiments were terminated after 7 days. Upon completion, the hydrolysis slurries were measured for solids and liquor composition and fraction insoluble solids.
Analytical Methods
Deacetylated and residual solids from enzymatic hydrolysis were analyzed for composition (e.g., glucan, xylan, lignin, etc.) according to NREL’s laboratory analytical procedures (LAP) (Sluiter et al., 2008a). Pretreatment and enzymatic saccharification liquors were analyzed for monomeric sugars using HPLC according to NREL LAP (Sluiter et al., 2006). The insoluble solids content pretreated and enzymatic hydrolyzed slurry were analyzed according to NREL LAP (Sluiter et al., 2008b). Sugar yields of high-solids enzymatic hydrolysis were calculated based on the method published by McMillan et al. (2011).
TEA
Process economics analysis includes a conceptual level of process design to develop a detailed process flow diagram (based on research data), rigorous material and energy balance calculations (via a commercial simulation tool, Aspen Plus), capital and project cost estimations (via an in-house model using spreadsheets), a discounted cash flow economic model, and the calculation of a minimum sugar selling price (MSSP). The NREL biochemical cellulosic sugar model is used for this study (NREL, 2021) with the conceptual process design shown in Figure 2. The process design includes feedstock handling and storage, pretreatment and enzymatic hydrolysis, solid/liquid separation of hydrolysate after the enzymatic hydrolysis step, sugar product concentration (optional), lignin combustion, product storage, onsite wastewater treatment, and all other required utilities. A nth-plant commercial facility processing 2000 dry metric tons per day of corn stover is assumed with 7884 operating hours per year based on previous developed models. The modeled corn stover feedstock contains 35% cellulose, 21% xylan, and 21% lignin. For outside battery limit (OSBL) facilities, all the wastewater generated in the conversion process is sent to the onsite wastewater treatment (WWT) system, using a similar design and cost assumptions as documented in other recent TEA reports (Humbird et al., 2011a; Davis et al., 2013a; Davis et al., 2013b; Davis et al., 2014; Tao et al., 2014; Davis et al., 2015). Although this is a costly operation, it produces clean and fully reusable water, which reduces both the fresh makeup water demand and discharge to the environment. All residual lignin and unconverted components, plus WWT biogas, sludge, and other gas streams are combusted in an onsite boiler/steam turbine system to produce steam and electricity, which are used to help meet the facility’s energy demands. Excess electricity is exported to the grid and assigned as a coproduct revenue according to standard biochemical TEA model assumptions. The costing basis for the boiler/steam turbine and all other utility operations is also maintained consistently with prior recent design cases (Humbird et al., 2011a; Davis et al., 2013a).
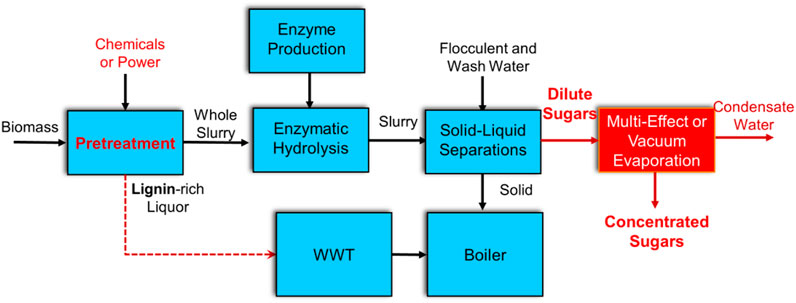
FIGURE 2. Block diagram schematic of cellulosic sugars model process. Options for concentrating sugar or not are highlighted in red.
The operating expense (OPEX) calculations for the designed facility are based on material and energy balance calculations using Aspen Plus process simulations (AspenPlus™, 2007). Raw material unit costs come from literature or existing models. (Kwiatkowski et al., 2006; Humbird et al., 2011b). All costs are adjusted to 2016 U.S. dollars using the plant cost index from Chemical Engineering Magazine (K-Marcuschamer et al., 2011), the industrial inorganic chemical index from SRI Consulting (SRI Consulting, U.S. Producer Price Indexes – Chemicals and Allied Products/Industrial Inorganic Chemicals Index, 2008), and the labor indices provided by the U.S. Department of Labor Bureau of Labor Statistics. (U.S. Bureau of Labor Statistics Data website National Employment, 2009).
Material and energy balance and flow rate information are used to size equipment and to calculate capital expenses. Capital costs are primarily based on detailed equipment quotations from several previous NREL design reports (Aden et al., 2002; Anex et al., 2010; Dutta et al., 2010; Humbird et al., 2011b; Dutta et al., 2011; Phillips et al., 2011; Davis et al., 2013c; Dutta et al., 2014; Dutta et al., 2015a; Dutta et al., 2015b; Eric et al., 2015; Dutta et al., 2018). For most of the equipment, the scaling factor for the power law is obtained from previously published works (Aden et al., 2002; Anex et al., 2010; Dutta et al., 2010; Humbird et al., 2011b; Dutta et al., 2011; Phillips et al., 2011; Davis et al., 2013c; Dutta et al., 2014; Dutta et al., 2015a; Dutta et al., 2015b; Eric et al., 2015; Dutta et al., 2018). For equipment not listed in the NREL design cases or for which vendor guidance is not available, the Aspen process economic evaluator is used to estimate baseline capital costs, and an exponent term of 0.6 is assumed. Factors used in previous NREL reports (Aden et al., 2002; Humbird et al., 2011b) are used to obtain the total project investment from the purchased equipment costs. For conceptual analyses of this type, factored equipment estimates are used to forecast the total project investment based on the calculation of total capital investment.
Once equipment costs are determined, direct and indirect overhead cost factors (e.g., installation costs and project contingency) are applied to determine a feasibility-level estimate of total capital investment (TCI) in 2016 U.S. dollars. The TCI, along with the plant OPEX (also developed using flow rates from the Aspen model), is used in a discounted cash flow rate of return (DCFROR) analysis to determine a plant gate price for total fuel at a given discount rate. The plant gate price is also called the MSSP (in $/lb sugar) required to obtain a net present value (NPV) of zero for a 10% internal rate of return (IRR) after taxes, associated with a hypothetical nth-plant model.
Results and DISCUSSION
Effect of Deacetylation Severity on Solids Composition
Deacetylation removes acetate and also partially removes lignin, xylan, a small portion of glucan, and some inorganic ash (McMillan et al., 2011). This is shown by the component concentrations of the raw (left bar in each cluster) and deacetylated individual and blended feedstocks shown in Figure 3. For raw individual feedstocks, SPCS, MPCS, and SW are similar in lignin content and total nonsoluble sugars (16.9%–17.8% of lignin and 53.5%–56.5% of nonsoluble glucan and xylan), whereas SG has a lower lignin content of 11.3% and a lower total nonsoluble sugar of 38.8%. On the other hand, SG has much higher free sugar content of 17.2% (11.5% sucrose, 2.7% glucose, 3.0% fructose) compared with the other three feedstocks.

FIGURE 3. Raw and deacetylated feedstock solids composition by component. The left bar in each cluster is the raw feedstock, and the remaining three bars to the right are low severity (50 kg NaOH/MT biomass) at 80°C, mid severity (70 kg NaOH/MT biomass) at 92°C, and high severity (100 kg NaOH/MT biomass) at 92°C severity deacetylation, respectively.
After deacetylation, the glucan and xylan content increased in the insoluble solids from low to high deacetylation severity for all samples because of the solubilization of other components. The acetate composition, as expected, decreased with increasing deacetylation severity from 1.4%–2.8% in the raw feedstock to 0.1%–0.6% in deacetylated samples. The change of lignin composition after deacetylation was dependent on the feedstocks in addition to deacetylation severity. The low severity deacetylation resulted in an increase to the lignin composition for MPCS, SW, and SG. This is an indication that the percentage of lignin removal is less than the percentage of the biomass weight loss of these feedstocks at low severity. That is, biomass weight loss at low severity is mainly from the loss of acetate, free sugars, protein, and ash. In contrast, lignin content decreased from 16.9% to 13.9% as observed in SPCS during low-severity deacetylation. This is likely because SPCS has low amounts of acetate and free sugars compared with other feedstocks.
High-severity deacetylation resulted in different percentage change in lignin composition for SPCS, MPCS, SW, and SG (−68.0%, −42.7%, −33.9%, and +2.1%, respectively). SG was the only feedstock that observed an increase in the lignin composition at every deacetylation condition, which we speculate was the result of the solubilization of a large amount of free sugars and extractives during deacetylation. For both bi-blend and quad-blend feedstocks, the lignin composition changes after high-severity deacetylation compared with the raw blended feedstocks (54.0% for bi-blend and 42.1% for quad-blend) were very close to the weighted average of the lignin composition change of individual feedstocks in the blend (52.8% for bi-blend and 43.7% for quad blend).
In the lignin deacetylation yield results, as shown in Figure 4 (the bars are not stacked), SPCS was observed to have the most lignin removal compared with other feedstocks (40% at low severity, 62% at medium severity, and 79% at high severity). The lower deacetylation severity, the greater the difference in lignin removal compared with other feedstocks with SPCS. For example, at low severity, there is no measurable amount of lignin removed from SG, and less than 10% of the lignin was removed from SW. Increasing the deacetylation temperature and NaOH loading increased the lignin yield for all feedstocks. At higher deacetylation temperatures and higher NaOH loading, the difference in lignin yield between different feedstocks were minimized, which contributes to the minimized sugar yields at high deacetylation severity as shown in the following discussion.
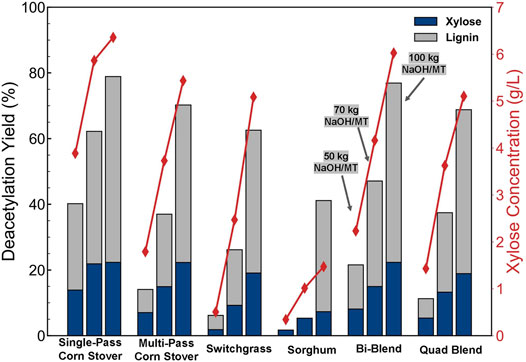
FIGURE 4. Lignin and total xylose yields (left axis) of feedstocks after deacetylation and total xylose concentrations (right axis) in the black liquor. The left, middle, and right bars in each cluster represent low (50 kg NaOH/ODMT and 80°C), medium (70 kg NaOH/ODMT and 92°C), and high severity (100 kg NaOH/ODMT and 92°C) deacetylation conditions, respectively. The deacetylation yields for lignin and total xylose are independent (not stacked).
Total xylose yields (monomeric and oligomeric) in deacetylation for different feedstocks at different deacetylation severities are shown in Figure 4 (bars are not stacked). Higher deacetylation severities resulted in higher xylan losses. For MPCS, SW, and SG, the xylan yield increased approximately linearly with the deacetylation severity, ranging from 2% to 23%. The total xylose concentrations in the BL ranged from 0.5 to 6.0 g/L with SG noticeably lower at 0.4–1.5 g/L from low to high deacetylation severity. The blended feedstock yields were approximately the weighted averages of the individual feedstocks making up the blends.
DDA Pretreatment
Dilute acid pretreatment primarily solubilizes xylan and hydrolyzes most of the solubilized xylan to monomeric xylose while minimally solubilizing and hydrolyzing the glucan (cellulose) to glucose. The cellulose remaining in the dilute acid pretreated solids residue is hydrolyzed to monomeric glucose using cellulase. After deacetylation, aliquots of the dewatered biomass slurries were further subjected to DDA and enzymatic hydrolysis. The dilute acid pretreatment conditions are shown in Table 2. The xylose yields resulting from DDA are shown in Figure 5. We found, in the DDA process, monomeric xylose yields ranged from 58% to 86% for all samples. The MPCS deacetylated at 50 kg NaOH/ODMT and treated at 170°C, 1% (w/w) H2SO4, and 5 min resulted in the highest monomeric xylose yields in pretreatment at 86%. The blended feedstock xylose yields were approximately the weighted averages of the xylose yields of individual feedstocks making up the blends. For example, at the 170°C and 5 min DDA pretreatment condition, bi-blend feedstock deacetylated at low severity (50 kg NaOH/ODMT condition) showed monomeric and oligomeric xylose yields of 84.8% and 3.8%, respectively, which is very close to the weighted average of the individual feedstocks that constitute the bi-blend resulting in monomeric and oligomeric glucose yields of 83.7% and 4.7%, respectively.
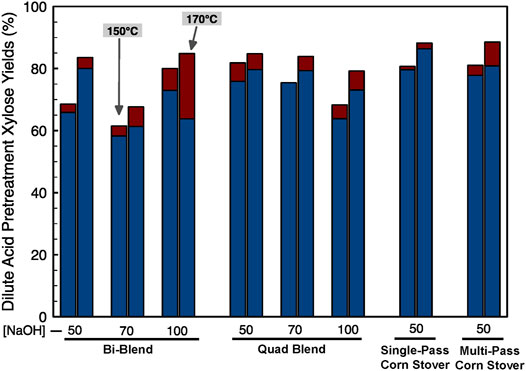
FIGURE 5. DDA pretreatment xylose yields (Red bars are stacked on top of blue bars. Total xylose yields are represented by the top of red bars). The left bar in each cluster is data from the 150°C, 20 min, 1% H2SO4 condition and the right bar represents the 170°C, 5 min, 1% H2SO4 pretreatment condition. The numbers on the x-axis note the deacetylation alkali loading in kg NaOH/ODMT biomass with 50, 70, and 100 referring to low, medium, and high deacetylation severities, respectively.
The monomeric and oligomeric glucose yields resulting from DDA pretreatments are shown in Figure 6. Most of the cellulose remained as insoluble solids in the DDA pretreatment slurry, which is further hydrolyzed to glucose during enzymatic hydrolysis. During DDA pretreatment, 3.2%–8.0% of the cellulose was solubilized into monomeric glucose with 0%–2.0% converted to oligomeric glucose. Nevertheless, as expected there is little differences in cellulose conversion to sugars during dilute acid pretreatment because the conditions are not severe enough to cause significant cellulose hydrolysis.
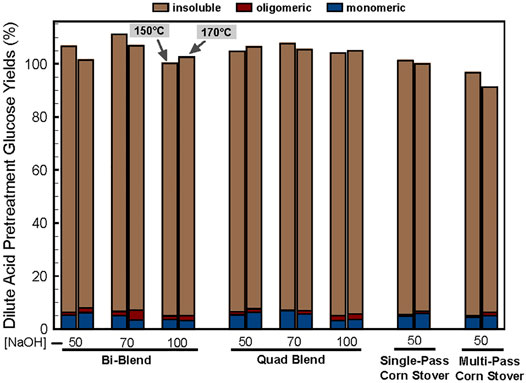
FIGURE 6. DDA pretreatment glucose yields. The left bar in each cluster is data from the 150°C, 20 min, 1% H2SO4 condition and the right bar represents the 170°C, 5 min, 1% H2SO4 pretreatment condition. The numbers on the x-axis note the deacetylation alkali loading in kg NaOH/ODMT dry biomass with 50, 70, and 100 referring to low, medium, and high deacetylation severity, respectively.
Enzymatic Hydrolysis
After DDA and DMR pretreatment, the slurries were subjected to enzymatic hydrolysis according to the methods described earlier. The enzymatic hydrolysis glucose yields (monomeric and oligomeric) of different feedstocks after DDA pretreatment at different conditions are compared and shown in Figure 7. The highest monomeric glucose yield of 85% with the highest total (sum of monomeric and oligomeric) glucose yield of 91% is achieved with corn stover bi-blend feedstock deacetylated with 100 kg NaOH/ODMT and pretreated at 170°C, 5 min, 1% H2SO4. For bi-blend and quad-blend feedstocks, higher deacetylation severity resulted in higher glucose yield. The glucose yield of DDA pretreated quad blend is lower than the bi-blend at the same pretreatment conditions. This indicates that SW and SG are more recalcitrant than corn stover. The bi-blend feedstock deacetylated with 50 kg NaOH/ODMT glucose yields are approximately the weighted average of the yields of SPCS and MPCS at both dilute acid pretreatment severities. In general, the dilute acid pretreatment temperature has a smaller influence on the glucose yield than the feedstock composition and deacetylation severity.
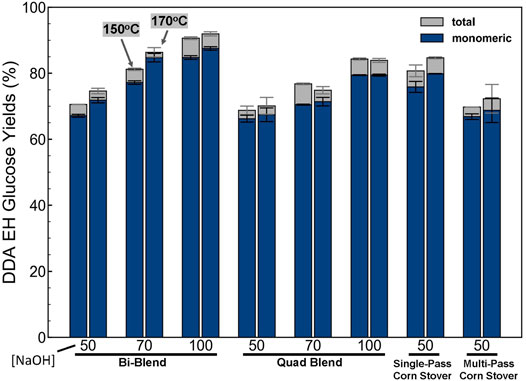
FIGURE 7. Monomeric and oligomeric glucose yields of DDA pretreated feedstocks after high-solids enzymatic hydrolysis. The left bar in each cluster is data from the 150°C, 20 min, 1% H2SO4 condition and the right bar represents the 170°C, 5 min, 1% H2SO4 pretreatment condition. The numbers on the x-axis note the deacetylation alkali loading in kg NaOH/ODMT biomass with 50, 70, and 100 referring to low, medium, and high deacetylation severity, respectively. The enzymatic hydrolysis was conducted at an enzyme loading of 12 mg total protein/g glucan using an 80:20 mixture of Novozymes Cellic CTec3/HTec3 at 50°C and 20% total solids loading for 7 days. Bars and error bars show the average and the standard deviation, respectively, of two replicated experiments.
The enzymatic hydrolysis glucose yields of different feedstocks after DMR pretreatment with different deacetylation severities are compared and shown in Figure 8. Higher deacetylation severities resulted in higher glucose yields for all feedstocks, which is most likely due to the higher lignin removal shown in Figure 4. The glucose yield of SG has the largest increase in response to the increase in deacetylation severity (from 50.7% to 86.1%) followed by MPCS (from 61.1% to 94.1%). The SPCS achieved the highest glucose yield, whereas the SW had the lowest yield among all these feedstocks at all deacetylation severities. The highest glucose yield of 95.3% ± 0.2% was observed for SPCS at high deacetylation severity (92°C and 100 kg NaOH/ODMT). The lowest glucose yield was 43.8% ± 0.4% for the SW at the low deacetylation severity (80°C and 50 kg NaOH/ODMT).
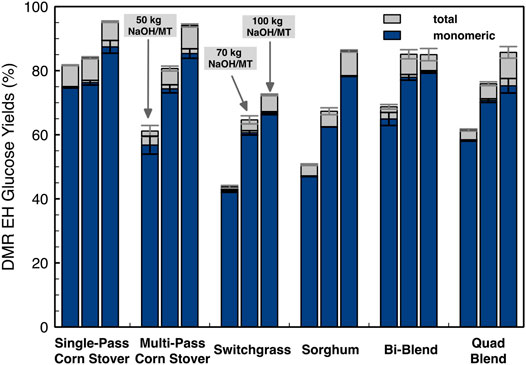
FIGURE 8. Monomeric and oligomeric enzymatic hydrolysis glucose yields of DMR pretreated feedstocks at 20% initial insoluble solids loading. The enzymatic hydrolysis was conducted at an enzyme loading of 12 mg total protein/g glucan using an 80:20 mixture of Novozymes Cellic CTec3/HTec3 at 50°C for 7 days. Bars and error bars show the average and the standard deviation, respectively, of two replicated experiments.
Whereas dilute acid pretreatment hydrolyzes most of the xylan, the DMR process leaves xylan relatively intact and susceptible to enzymatic hydrolysis as shown by the results in Figure 9. Xylose yields had similar trends to glucose yields as shown in Figure 8 with SPCS > MPCS > SG > SW. The DMR pretreatment relies heavily on the deacetylation to remove lignin content before mechanical refining to achieve high enzymatic digestibility. Both glucose and xylose yields show the largest differences in all individual feedstocks at low-severity deacetylation, whereas increasing deacetylation severities mitigates the sugar yield difference among these four different individual feedstocks. This result suggests that high-severity deacetylation reduces the impact of feedstock variability on glucose and xylose yields for the DMR process. The impact of deacetylation severity on sugar yield is more significant for DMR than DDA pretreatment biomass. However, increasing deacetylation severity requires higher NaOH loadings with associated increases in chemical and processing cost necessitating the need for TEA to find the optimum conditions.
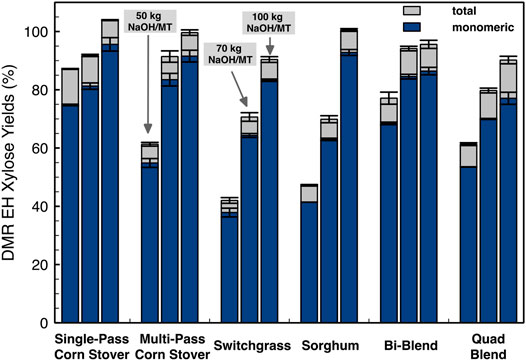
FIGURE 9. Monomeric xylose yields of DMR pretreated feedstock from high solids enzymatic hydrolysis at 20% initial insoluble solids. The enzymatic hydrolysis was conducted at an enzyme loading of 12 mg total protein/g glucan using an 80:20 mixture of Novozymes Cellic CTec3/HTec3 at 50°C for 7 days. Bars and error bars show the average and the standard deviation, respectively, of two replicated experiments.
TEA
Sugar is one of the most important precursors for many biofuel intermediates or final products through biological or catalytic conversions. Thus, we selected MSSP as the key metric in our TEA. The distributions of major cost contributors to MSSP for producing sugars using different feedstocks at different DDA and DMR pretreatment conditions are shown in Figure 10, including cost contributions from feedstock, pretreatment, enzymatic hydrolysis, cellulase production, and plant balance (OSBL capital and operating expenses).
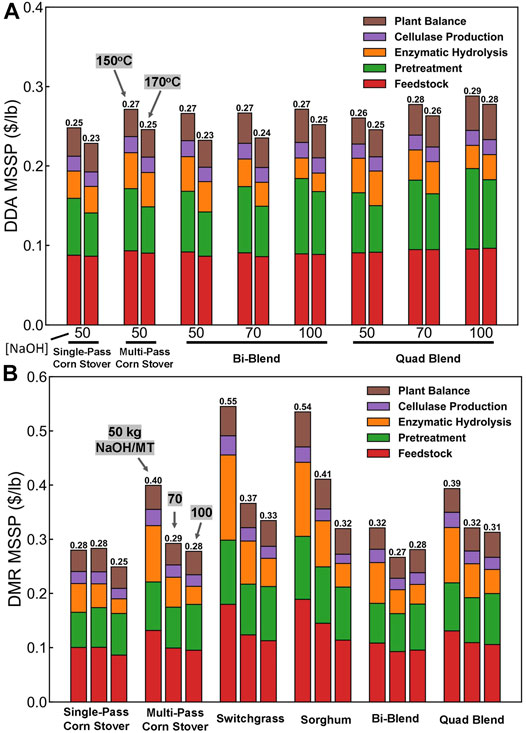
FIGURE 10. MSSP for different feedstocks as a function of pretreatment technique: (A) DDA and (B) DMR.
The DDA and DMR pretreatment technologies considered vary in terms of process design and projected capital/operating costs, resulting in variable MSSP estimates (where there is a larger difference around deacetylation severity and yields). The MSSP values for intermediate hydrolysate sugars were estimated to range from 0.25–0.55 $/lb for DMR or 0.23–0.29 $/lb for DDA with variations on feedstock type, pretreatment severity, and resulted yields. Variation on DDA severity does not impact cost significantly, whereas DMR severity impacts sugar yields, resulting in more significant impacts on costs. It was found that the sugar yield remains a key driver in determining projected MSSPs for each scenario with pretreatment and enzymatic hydrolysis capital costs, chemical or power usage, and OSBL facility costs also playing significant roles in MSSP.
Blending recalcitrant feedstocks, which are SW and SG used in this study, in corn stover does increase the MSSP using either the DMR or the DDA pretreatment methods. On the other hand, blending different feedstocks can effectively lower the MSSP compared with using only recalcitrant feedstocks, which will be a potentially successful strategy in mitigating feedstock availability issues for biorefineries. For future studies, further investigations around sugar yields, capital costs, and energy integration for the overall process as well as around opportunities to optimize deacetylation metrics and hydrolysate clarification details, will provide additional insights into the importance of individual factors that may influence overall sugar costs.
Comparing different feedstocks, the costs of DMR sugars produced from SW and SG are higher than MPCS and SPCS due to the low sugar yields at all deacetylation severities. The MSSP of DMR sugar produced from feedstock blends are approximately the weighted average of the MSSP of DMR sugars produced from single feedstocks. The lowest MSSP of sugars produced using the DMR and DDA pretreatment are $0.25/lb and $0.23/lb, respectively. For DMR, the lowest MSSP is observed for SPCS deacetylated at 100 kg/ODMT NaOH loading. The lowest MSSP of DDA sugar is produced from SPCS using low deacetylation severity and high DAP temperature. SPCS has the lowest MSSP at different pretreatment conditions using both pretreatment methods. Blending recalcitrant feedstocks, which are SW and SG used in this study, in corn stover does increase the MSSP using either the DMR or the DDA pretreatment methods. On the other hand, blending different feedstocks can effectively lower the MSSP compared with using only recalcitrant feedstocks which will be a potential successful strategy in mitigating feedstock availability issues for biorefineries.
Conclusions
To address feedstock variability, availability, and affordability issues for biorefineries, we investigated the effects of feedstock variability, blending strategy, and pretreatment severity on sugar yields and MSSPs. Two different pretreatment methods, DDA and DMR, were studied under different deacetylation severity and pretreatment conditions. In DDA pretreatment, most of the xylose was extracted from the biomass in a monomeric form in the DAP stage, whereas most of the glucose remained as insoluble cellulose before enzymatic hydrolysis. Biomass pretreated under higher DAP temperature shows higher enzymatic glucose yields. Higher deacetylation severities resulted in higher lignin removal and xylan losses for all feedstocks. Higher deacetylation severities also increased enzymatic sugar yields for both DDA and DMR pretreated feedstocks. The impact of deacetylation severity on sugar yield was found to be more significant for DMR than DDA pretreatment biomass. The DMR pretreatment relies heavily on the deacetylation unit operation to remove lignin content before mechanical refining to achieve higher enzymatic digestibility.
Feedstock variability has large effects on enzymatic sugar yields. Corn stover was generally found to have higher sugar yields than SW and SG. Different corn stover harvesting techniques can also result in feedstock variability and higher recalcitrance to pretreatment. SPCS was found to have higher sugar yields than MPCS. Higher deacetylation severities in the DMR pretreatment mitigates the sugar yield difference among these different feedstocks. The sugar yields of both bi-blend and quad-blend feedstocks are roughly the weighted average of constituent single feedstock sugar yields.
The MSSP values for intermediate hydrolysate sugars were estimated to range from 0.25–0.55 $/lb for DMR or 0.23–0.29 $/lb for DDA with variations on feedstock type, pretreatment severity, and resulted yields. Variation on DDA severity does not impact cost significantly, whereas DMR severity impacts sugar yields, resulting in more significant impacts on costs. Sugar yield remains a key driver in determining projected MSSPs. Blending SW and SG in corn stover was found to decrease the sugar yields and increase the MSSP. However, blending feedstocks may be a successful strategy for biorefineries to solve feedstock availability and sustainability issues without dramatically increasing the MSSP.
Synopsis
To derisk the feedstock variability, availability, and affordability in sustainable production of biofuels to replace fossil fuels and reduce global greenhouse gas emissions, this work studied the effects of biomass variability, blends, and pretreatment methods on the sugar conversion yield and production cost.
Data Availability Statement
The original contributions presented in the study are included in the article/Supplementary Material, further inquiries can be directed to the corresponding authors.
Author Contributions
The manuscript was written through the contribution of all authors. All authors have given approval to the final version of the manuscript.
Funding
This work was authored by the National Renewable Energy Laboratory, operated by Alliance for Sustainable Energy, LLC, for the United States Department of Energy (DOE) under Contract No. DE-AC36-08GO28308. Funding provided by the United States Department of Energy Office of Energy Efficiency and Renewable Energy Bioenergy Technologies Office.
Author Disclaimer
The views expressed in the article do not necessarily represent the views of the DOE or the United States Government. The United States Government retains and the publisher, by accepting the article for publication, acknowledges that the United States Government retains a nonexclusive, paid-up, irrevocable, worldwide license to publish or reproduce the published form of this work, or allow others to do so, for United States Government purposes.
Conflict of Interest
The authors declare that the research was conducted in the absence of any commercial or financial relationships that could be construed as a potential conflict of interest.
Publisher’s Note
All claims expressed in this article are solely those of the authors and do not necessarily represent those of their affiliated organizations, or those of the publisher, the editors, and the reviewers. Any product that may be evaluated in this article, or claim that may be made by its manufacturer, is not guaranteed or endorsed by the publisher.
Acknowledgments
We would like to thank Allison Ray, Neal Yancey, and Vicky Thompson at Idaho National Laboratory for providing the biomass feedstock. We also want to thank Dan Schell and Rick Elander at NREL for their pilot plant support.
Abbreviations
DDA, deacetylation and dilute acid (pretreatment); DMR, deacetylation and mechanical refining (pretreatment); DAP, dilute acid pretreatment; TEA, techno-economic analysis; SPCS, single-pass corn stover; MPCS, multi-pass corn stover; SW, switchgrass; SG, sorghum; INL, Idaho National Laboratory; NREL, National Renewable Energy Laboratory; ODMT and MT, oven dry metric ton; LAP, laboratory analytical procedure; BL, black liquor; MSSP, minimum sugar selling price.
References
Aden, A., Ruth, M., Ibsen, K., Jechura, J., Neeves, K., Sheehan, J., et al. (2002). Lignocellulosic Biomass to Ethanol Process Design and Economics Utilizing Co-current Dilute Acid Prehydrolysis and Enzymatic Hydrolysis for Corn stover. Golden, CO, US: National Renewable Energy Lab.
Anex, R. P., Aden, A., Kazi, F. K., Fortman, J., Swanson, R. M., Wright, M. M., et al. (2010). Techno-economic Comparison of Biomass-To-Transportation Fuels via Pyrolysis, Gasification, and Biochemical Pathways. Fuel 89 (0), S29–S35. doi:10.1016/j.fuel.2010.07.015
Baral, N. R., Davis, R., and Bradley, T. H. (2019). Supply and Value Chain Analysis of Mixed Biomass Feedstock Supply System for Lignocellulosic Sugar Production. Biofuels, Bioprod. Bioref. 13 (3), 635–659. doi:10.1002/bbb.1975
Brodeur-Campbell, M., Klinger, J., and Shonnard, D. (2012). Feedstock Mixture Effects on Sugar Monomer Recovery Following Dilute Acid Pretreatment and Enzymatic Hydrolysis. Bioresour. Tech. 116, 320–326. doi:10.1016/j.biortech.2012.03.090
Chen, X., Tao, L., Shekiro, J., Mohaghaghi, A., Decker, S., Wang, W., et al. (2012). Improved Ethanol Yield and Reduced Minimum Ethanol Selling Price (MESP) by Modifying Low Severity Dilute Acid Pretreatment with Deacetylation and Mechanical Refining: 1) Experimental. Biotechnol. Biofuels 5 (1), 60–10. doi:10.1186/1754-6834-5-60
Chen, X., Kuhn, E., Jennings, E. W., Nelson, R., Tao, L., Zhang, M., et al. (2016). DMR (Deacetylation and Mechanical Refining) Processing of Corn stover Achieves High Monomeric Sugar Concentrations (230 G L− 1) during Enzymatic Hydrolysis and High Ethanol Concentrations (> 10% V/v) during Fermentation without Hydrolysate Purification or Concentration. Energ. Environ. Sci. 9 (4), 1237–1245.
Chen, X., Kuhn, E., Wang, W., Park, S., Flanegan, K., Trass, O., et al. (2013). Comparison of Different Mechanical Refining Technologies on the Enzymatic Digestibility of Low Severity Acid Pretreated Corn stover. Bioresour. Tech. 147, 401–408. doi:10.1016/j.biortech.2013.07.109
Chen, X., Shekiro, J., Elander, R., and Tucker, M. (2012). Improved Xylan Hydrolysis of Corn stover by Deacetylation with High Solids Dilute Acid Pretreatment. Ind. Eng. Chem. Res. 51 (1), 70–76. doi:10.1021/ie201493g
Chen, X., Shekiro, J., Franden, M. A., Wang, W., Zhang, M., Kuhn, E., et al. (2012). The Impacts of Deacetylation Prior to Dilute Acid Pretreatment on the Bioethanol Process. Biotechnol. Biofuels 5 (1), 8. doi:10.1186/1754-6834-5-8
Chen, X., Shekiro, J., Pschorn, T., Sabourin, M., Tao, L., Elander, R., et al. (2014). A Highly Efficient Dilute Alkali Deacetylation and Mechanical (Disc) Refining Process for the Conversion of Renewable Biomass to Lower Cost Sugars. Biotechnol. Biofuels 7 (1), 98. doi:10.1186/1754-6834-7-98
Chen, X., Wang, W., Ciesielski, P., Trass, O., Park, S., Tao, L., et al. (2016). Improving Sugar Yields and Reducing Enzyme Loadings in the Deacetylation and Mechanical Refining (DMR) Process through Multistage Disk and Szego Refining and Corresponding Techno-Economic Analysis. ACS Sust. Chem. Eng. 4 (1), 324–333. doi:10.1021/acssuschemeng.5b01242
Davis, R., Biddy, M. J., Tao, L., and Tan, E. (2014). FY14 Biochemical Platform State of Technology. BETO. Golden, CO: National Renewable Energy Lab.
Davis, R., Biddy, M., Tao, L., and Tan, E. (2015). FY15 Biochemical Platform State of Technology. BETO.
Davis, R., Tao, L., Scarlata, C., and Tan, E. C. (2013), FY13 Biochemical Platform State of Technology.
Davis, R., Tao, L., Tan, E. C., Biddy, M. J., Beckham, G., Scarlata, C. J., et al. (2013). Process Design and Economics for the Conversion of Lignocellulosic Biomass to Hydrocarbons-Dilute-Acid and Enzymatic Deconstruction of Biomass to Sugars and Biological Conversion of Sugars to Hydrocarbons. NREL/TP, 5100–60223. doi:10.2172/1107470
Davis, R., Tao, L., Tan, E. C. D., Biddy, M. J., Beckham, G. T., Scarlata, C., et al. (2013). Process Design and Economics for the Conversion of Lignocellulosic Biomass to Hydrocarbons: Dilute-Acid and Enzymatic Deconstruction of Biomass to Sugars and Biological Conversion of Sugars to Hydrocarbons. Natl. Renew. Energ. Lab. NREL/TP-5100-60223Golden, CO, 2013/10/01. doi:10.2172/1107470
Dutta, A., Bain, R. L., and Biddy, M. J. (2010). Techno-economics of the Production of Mixed Alcohols from Lignocellulosic Biomass via High-Temperature Gasification. Environ. Prog. Sust. Energ. 29 (2), 163–174. doi:10.1002/ep.10445
Dutta, A., Hensley, J., Bain, R., Magrini, K., Tan, E. C. D., Apanel, G., et al. (2014). Technoeconomic Analysis for the Production of Mixed Alcohols via Indirect Gasification of Biomass Based on Demonstration Experiments. Ind. Eng. Chem. Res. 53 (30), 12149–12159. doi:10.1021/ie402045q
Dutta, A. M., Hensley, M., Worley, D., Dudgeon, D., Barton, P., Groenendijk, D., et al. (2011). Hess Process Design and Economics for Conversion of Lignocellulosic Biomass to Ethanol. Thermaochemical Pathway by Indirect Gasification Mixed Alcohol Synth., 5100–51400. NREL/TPNREL: NREL.-
Dutta, A., Sahir, A., Tan, E., Humbird, D., Snowden-Swan, L. J., Meyer, P., et al. (2015). Process Design and Economics for the Conversion of Lignocellulosic Biomass to Hydrocarbon Fuels Thermochemical Research Pathways with In Situ and Ex Situ Upgrading of Fast Pyrolysis Vapors. NREL/TP, 5100–62455. National Renewable Energy Laboratory: National Renewable Energy Laboratory. doi:10.2172/1215007-
Dutta, A., Sahir, A., Tan, E., Humbird, D., Snowden-Swan, L., Meyer, P., et al. (2015). “Process Design and Economics for the Conversion of Lignocellulosic Biomass to Hydrocarbon Fuels: Thermochemical Research Pathways with In Situ and Ex Situ Upgrading of Fast Pyrolysis Vapors,” in National Renewable Energy Laboratory (Golden, CO (United States): NREL).
Dutta, A., Tan, E. C., Ruddy, D., Nash, C. P., Dupuis, D. P., Hartley, D., et al. (2018). “High-Octane Gasoline From Lignocellulosic Biomass Via Syngas And Methanol/Dimethyl Ether Intermediates,” in 2018 State Of Technology And Future Research; National Renewable Energy Lab (Golden, CO (United States): NREL).
Eric, C. D., Talmadge, M., Dutta, A., Hensley, J., Schaidle, J., Biddy, M., et al. (2015). Process Design and Economics for the Conversion of Lignocellulosic Biomass to Hydrocarbons via Indirect Liquefaction. Thermochemical Research Pathway to High-Octane Gasoline Blendstock Through Methanol/Dimethyl Ether Intermediates (Golden, CO: National Renewable Energy Lab.(NREL)) No. NREL/TP-5100-62402.
Humbird, D., Davis, R., Tao, L., Kinchin, C., Hsu, D., Aden, A., et al. (2011). Process Design and Economics for Biochemical Conversion of Lignocellulosic Biomass to Ethanol. Dilute-Acid Pretreatment and Enzymatic Hydrolysis of Corn Stover, 2011. NREL/TP-510-47764May. doi:10.2172/1013269
Humbird, D., Davis, R., Tao, L., Kinchin, C., Hsu, D., Aden, A., et al. (2011). Process Design and Economics for Biochemical Conversion of Lignocellulosic Biomass to Ethanol: Dilute-Acid Pretreatment and Enzymatic Hydrolysis of Corn Stover. Natl. Renew. Energ. Lab. NREL/TP-5100-47764Golden, CO, 2011/03/01. doi:10.2172/1013269
Johnson, J. M. F., Wilhelm, W. W., Karlen, D. L., Archer, D. W., Wienhold, B., Lightle, D. T., et al. (2010). Nutrient Removal as a Function of Corn stover Cutting Height and Cob Harvest. Bioenerg. Res. 3 (4), 342–352. doi:10.1007/s12155-010-9093-3
K-Marcuschamer, D., Simmons, B. A., and Blanch, H. W. (2011). Techno-economic Analysis of a Lignocellulosic Ethanol Biorefinery with Ionic Liquid Pre-treatment. Biofuels, Bioproducts and Biorefining 5 (5), 562–569.
Kuhn, E. M., Chen, X., Tucker, M. P., and DeacetylationMechanical Refining, (2020). Deacetylation and Mechanical Refining (DMR) and Deacetylation and Dilute Acid (DDA) Pretreatment of Corn Stover, Switchgrass, and a 50:50 Corn Stover/Switchgrass Blend. ACS Sust. Chem. Eng. 8 (17), 6734–6743. doi:10.1021/acssuschemeng.0c00894
Kuhn, E. M., O’Brien, M. H., Ciesielski, P. N., and Schell, D. J. (2016). Pilot-scale Batch Alkaline Pretreatment of Corn stover. ACS Sust. Chem. Eng. 4 (3), 944–956. doi:10.1021/acssuschemeng.5b01041
Kwiatkowski, J. R., McAloon, A. J., Taylor, F., and Johnston, D. B. (2006). Modeling the Process and Costs of Fuel Ethanol Production by the Corn Dry-Grind Process. Ind. Crops Prod. 23 (3), 288–296. doi:10.1016/j.indcrop.2005.08.004
Langholtz, M. H., Stokes, B. J., and Eaton, L. M. (2016). Economic Availability of Feedstock. Oak Ridge National Laboratory, Oak Ridge, Tennessee, Managed by UT-Battelle, LLC for the US Department of Energy. 2016 Billion-ton Rep. Advancing Domest. Resour. a thriving bioeconomy 1, 1–411. 2016.
McMillan, J. D., Jennings, E. W., Mohagheghi, A., and Zuccarello, M. (2011). Comparative Performance of Precommercial Cellulases Hydrolyzing Pretreated Corn stover. Biotechnol. Biofuels 4 (1), 29. doi:10.1186/1754-6834-4-29
Mohagheghi, A., Tucker, M., Grohmann, K., and Wyman, C. (1992). High Solids Simultaneous Saccharification and Fermentation of Pretreated Wheat Straw to Ethanol. Appl. Biochem. Biotechnol. 33 (2), 67–81. doi:10.1007/bf02950778
Nielsen, F., Galbe, M., Zacchi, G., and Wallberg, O. (2019). The Effect of Mixed Agricultural Feedstocks on Steam Pretreatment, Enzymatic Hydrolysis, and Cofermentation in the Lignocellulose-To-Ethanol Process. Biomass Convers. Biorefinery 10, 1–14. doi:10.1007/s13399-019-00454-w
NREL (2021) Nrel.Gov Extranet Biorefinery Aspen-Models Available at: https://www.nrel.gov/extranet/biorefinery/aspen-models/downloads/bc1707a/bc1707a-sugars.xlsm
Overend, R. P., and Chornet, E. (1987). Fractionation of Lignocellulosics by Steam-Aqueous Pretreatments. Phil. Trans. R. Soc. Lond. Ser. A, Math. Phys. Sci. 321 (1561), 523–536.
Phillips, S. D., Tarud, J. K., Biddy, M. J., and Dutta, A. (2011). Gasoline from Wood via Integrated Gasification Synthesis, and Methanol-To-Gasoline Technologies. NREL/TP, 5100–47594. doi:10.2172/1004790-
Ray, A. E., Li, C., Thompson, V. S., Daubaras, D. L., Nagle, N., and Hartley, D. S. (2017). Biomass Blending and Densification: Impacts on Feedstock Supply and Biochemical Conversion Performance. Ida. Natl. Lab. (Inl) Ida. Falls, ID (United States). doi:10.5772/67207
Shi, J., Ebrik, M. A., and Wyman, C. E. (2011). Sugar Yields from Dilute Sulfuric Acid and Sulfur Dioxide Pretreatments and Subsequent Enzymatic Hydrolysis of Switchgrass. Bioresour. Tech. 102 (19), 8930–8938. doi:10.1016/j.biortech.2011.07.042
Shi, J., George, K. W., Sun, N., He, W., Li, C., Stavila, V., et al. (2015). Impact of Pretreatment Technologies on Saccharification and Isopentenol Fermentation of Mixed Lignocellulosic Feedstocks. Bioenerg. Res. 8 (3), 1004–1013. doi:10.1007/s12155-015-9588-z
Shi, J., Thompson, V. S., Yancey, N. A., Stavila, V., Simmons, B. A., and Singh, S. (2013). Impact of Mixed Feedstocks and Feedstock Densification on Ionic Liquid Pretreatment Efficiency. Biofuels 4 (1), 63–72. doi:10.4155/bfs.12.82
Sluiter, A., Hames, B., Ruiz, R., Scarlata, C., Sluiter, J., and Templeton, D. (2006). Determination of Sugars, Byproducts, and Degradation Products in Liquid Fraction Process Samples. Golden: Natl. Renew. Energ. Lab. 339 (1), 55–57. doi:10.1007/bf00324760
Sluiter, A., Hames, B., Ruiz, R., Scarlata, C., Sluiter, J., Templeton, D., et al. (2008). Determination of Structural Carbohydrates and Lignin in Biomass. Lab. Anal. procedure 1617 (1), 1–16.
Sluiter, A., Hyman, D., Payne, C., and Wolfe, J. (2008). Determination of Insoluble Solids in Pretreated Biomass Material. Lab. Anal. procedure (Lap). National Renewable Energy Laboratory Technical Report, NREL/TP-510-42627, Golden, CO.
SRI Consulting, U.S. Producer Price Indexes – Chemicals and Allied Products/Industrial Inorganic Chemicals Index (2008). In Chemical Economics Handbook. Menlo Park, CA.
Tao, L., Schell, D., Tan, E. C., and Elander, R. A. (2014). B. Achievement of Ethanol Cost Targets: Biochemical Ethanol Fermentation via Dilute-Acid Pretreatment and Enzymatic Hydrolysis of Corn Stover.
U.S. Bureau of Labor Statistics Data website National Employment, Hours, and Earnings Catalog, Industry: Chemicals and Allied Products, 2009. Available at: http://data.bls.gov/cgi-bin/srgate (accessed Jul.1980).
Vera, R. M., Bura, R., and Gustafson, R. (2015). Synergistic Effects of Mixing Hybrid poplar and Wheat Straw Biomass for Bioconversion Processes. Biotechnol. Biofuels 8 (1), 226. doi:10.1186/s13068-015-0414-9
Williams, C. L., Westover, T. L., Emerson, R. M., Tumuluru, J. S., and Li, C. (2016). Sources of Biomass Feedstock Variability and the Potential Impact on Biofuels Production. Bioenerg. Res. 9 (1), 1–14. doi:10.1007/s12155-015-9694-y
Wyman, C. E., Dale, B. E., Balan, V., Elander, R. T., Holtzapple, M. T., Ramirez, R. S., et al. (2013). Comparative Performance of Leading Pretreatment Technologies for Biological Conversion of Corn stover, poplar wood, and Switchgrass to Sugars. Aqueous pretreatment Plant biomass Biol. Chem. Convers. Fuels chemicals, 239–259. doi:10.1002/9780470975831.ch12
Zhang, K., Pei, Z., and Wang, D. (2016). Organic Solvent Pretreatment of Lignocellulosic Biomass for Biofuels and Biochemicals: a Review. Bioresour. Tech. 199, 21–33. doi:10.1016/j.biortech.2015.08.102
Keywords: biomass to biofuel conversion, biomass pretreatment, dilute acid pretreatment, alkaline pretreatment, mechanical refining, feedstock blend, technoeconomic analysis
Citation: Li Y, Tao L, Nagle N, Tucker M, Chen X and Kuhn EM (2022) Effect of Feedstock Variability, Feedstock Blends, and Pretreatment Conditions on Sugar Yield and Production Costs. Front. Energy Res. 9:792216. doi: 10.3389/fenrg.2021.792216
Received: 09 October 2021; Accepted: 03 December 2021;
Published: 14 January 2022.
Edited by:
John Korstad, Oral Roberts University, United StatesReviewed by:
Bo Wu, Biogas Institute of Ministry of Agriculture (CAAS), ChinaZhaoxian Xu, Nanjing University of Science and Technology, China
Jian Zhang, East China University of Science and Technology, China
Copyright © 2022 Li, Tao, Nagle, Tucker, Chen and Kuhn. This is an open-access article distributed under the terms of the Creative Commons Attribution License (CC BY). The use, distribution or reproduction in other forums is permitted, provided the original author(s) and the copyright owner(s) are credited and that the original publication in this journal is cited, in accordance with accepted academic practice. No use, distribution or reproduction is permitted which does not comply with these terms.
*Correspondence: Xiaowen Chen, WGlhb3dlbi5DaGVuQG5yZWwuZ292; Erik M. Kuhn, RXJpay5LdWhuQG5yZWwuZ292