 Zi-gui Chen
 Ling-jun Kong2
 Min Wang
- 1Design & Art Institute, Hunan University of Technology and Business, Changsha, China
- 2School of Economy & Trade, Hunan University of Technology and Business, Changsha, China
- 3School of Information Engineering, Lanzhou University of Finance and Economics, Lanzhou, China
- 4School of Business, Central South University of Forestry and Technology, Changsha, China
Rational planning and optimization of urban spatial form to achieve the goal of energy efficient utilization and carbon emission reduction is one of the important ways to improve energy efficiency. We deconstruct urban spatial form into centrality, aggregation and complexity, and analyze net effect and its heterogeneity of urban spatial form on energy efficiency with OLS, quantile regression model as well as grouped regression model. The results show that the effects of urban spatial centrality and complexity on energy efficiency are nonlinear. For the vast majority of cities, strengthening urban spatial centrality will significantly improve energy efficiency, but the growth rate will gradually decrease. The impact effect of urban complexity on energy efficiency has the characteristics of U-shaped trend with an inflection point value of 0.429. And for the three-quarters of urban samples, enhancing urban spatial complexity will reduce energy efficiency. The positive effect of urban spatial aggregation on energy efficiency is only significant in cities with high quantile for energy efficiency. In terms of urban heterogeneity, the positive effects of spatial centrality and aggregation on energy efficiency are more obvious in megacities with a permanent population of more than 5 million, and the negative effect of spatial complexity on energy efficiency is more obvious in small and medium-sized cities. Whether it is promotion or inhibition, the urban samples with high energy efficiency are more affected by the change of urban spatial form. Optimizing the urban spatial form is one of the important ways to improve the energy efficiency, and the policy setting should give full consideration to the urban heterogeneity and classified policies.
Introduction
Resource depletion and ecological environment problems caused by excessive energy consumption have become one of the major challenges of human development in the 21st century. Improving energy efficiency is the key to achieve the goals of energy conservation, emission reduction and green development (Chen et al., 2018). Looking back on the development process of major countries in the world, as the lifeline of national economic development, energy plays a self-evident role as the driving force for a country or region’s economic growth. At the same time, the dependence of the world economy on energy has not decreased markedly, but has deepened (Zhang et al., 2020). In China, energy has supported the process of industrialization and urbanization to a certain extent, and has become a vital factor of production for economic growth. According to the data released by BP World Energy Statistical Yearbook, China is still the largest energy consumer in the world. In 2018, China’s total energy consumption has reached 3.273 billion tons of oil equivalents, accounting for 23.6% of the world, and its contribution to the growth of total primary energy consumption has reached 34%, far exceeding that of other countries in the world. On the supply side, energy consumption has shifted from self-sufficiency to import, and the proportion of import has increased year by year. Since 2018, China has become the world’s largest oil and gas importer, and its dependence on foreign crude oil and natural gas has reached a new high in recent 50 years ( Rong et al., 2016). The huge energy consumption makes China’s carbon emissions jump to the first in the world, accounting for 28.9% of the global total.
Consistent with the growth trend of energy consumption, China has experienced a large-scale and rapid urbanization process since the reform and opening up. Over the past 40 years, more than 650 million rural residents have moved to cities to live and work. By the end of 2020, China’s urbanization rate has reached 63.89%. According to Wu et al. (2020), by 2035, China’s urbanization rate will reach 75–80%, adding nearly 400 million urban residents. The expanded cities have rapidly obtained factors of production such as labor and energy, and achieved rapid development. At the same time, they have also expanded the scale of production and life, increased fossil energy consumption, and exacerbated the problem of regional and structural energy shortage. As the center of human social and economic activities, urban areas now account for 85% of the total national energy consumption and more than 70% of the national carbon emissions. In addition, the decentralization and complexity of urban spatial form, as well as the spatial mismatch between industry and resource elements in the city, inhibit the efficient and intensive utilization of energy resources to a certain extent. Therefore, how to achieve the goals of energy efficient utilization and carbon emission reduction through reasonable planning, optimization and adjustment of urban spatial form provides a new path for China to deal with the energy crisis and improve energy efficiency under the “double carbon” strategic goal.
This study is structured as follows. Literature Review and Hypothesis Section summarizes the existing research progress and theory hypothesis. Material and Methods Section presents the identification method of urban spatial form and energy efficiency, and the econometric model specification of the theoretical hypothesis test. In Result section, the net effect and its heterogeneity of urban spatial form on energy efficiency are systematically analyzed. Conclusion Section draws conclusions and policy implications.
Literature Review and Hypothesis
The research on urban spatial form originated from the urban form and land use research center founded by British scholars March and Martin in the 1950s. They believe that urban spatial form is a variety of spatial structures and traffic corridors composed of basic spatial geometric elements. After entering the 21st century, with the reorganization of the world economic pattern and global economic integration, the urban spatial form has further developed in the direction of regionalization and information networking, and its internal mechanism has become more complex (Tanushri and Sarika, 2021). The evolution of urban spatial form is showing unprecedented new mechanisms and characteristics, and has become an important field of urban geography and economic research (Li et al., 2021; (Xiong and Duan, 2020). This is because the urban spatial form can not only comprehensively reflect the social and economic activities of the city in different periods, but also change with the changes of urban economic activities and social culture, showing a dynamic interaction process. At this stage, there are various measurement indicators of urban spatial form, mainly focusing on the geometric characteristics of urban space and the economic and social indicators related to spatial form, which can be roughly divided into three types: urban spatial aggregation, urban spatial complexity and urban spatial centrality. Among them, the indicators to measure urban spatial aggregation include cluster degree (Shu and Lam, 2011), similar adjacency rate (Falahatkar et al., 2020), aggregation index (Fang et al., 2015), compactness index (Liu et al., 2012), maximum patch compactness index (Makido et al., 2012), etc; Indicators to measure urban spatial complexity include landscape shape index (Bereitschaft and Debbage, 2013; Liu et al., 2015), edge density (Ma et al., 2013), average perimeter area ratio (Ou et al., 2013), etc; The largest patch area (Chen et al., 2011; Jia et al., 2019) is the index to measure the urban spatial centrality.
The effect of urban spatial form on energy efficiency has always been the focus of academic attention. However, from the existing research, few literatures systematically explore the net impact of urban spatial form on energy efficiency and its mechanism from multiple dimensions. It mainly investigates the impact of a certain dimension index of urban spatial form on urban energy efficiency (Zhong et al., 2020; Esfandi et al., 2022). First, some researchers have investigated the impact of urban spatial aggregation on energy efficiency, and believe that the higher the aggregation, the higher the energy efficiency (Ewing and Rong., 2008). This is because high aggregation degree means that urban spatial form shows high population density, high building density and relatively high industrial concentration, which are more conducive to improving energy intensive utilization efficiency (Steemers, 2003; Wang et al., 2020). Moreover, the centralized residential space and industrial distribution form help to save the energy consumption of transportation, commuting and product transportation (Hankey and Marshall, 2010; Ma et al., 2015; Quan and Li, 2021). Second, the centralization of urban spatial structure will also have a positive impact on energy efficiency, because the higher the urban centrality, the more conducive to saving overall energy consumption and realizing intensive utilization (Chen et al., 2011; Mangan et al., 2020). Third, the complexity of urban spatial form represents the geometric complexity of urban patch form. Moreover, cities with higher complexity usually have higher energy consumption and lower energy efficiency. This conclusion was obtained by Falahatkar et al. (2010) based on the sample data of Iran and Makido et al. (2012) Based on the empirical analysis of Japanese sample data. Therefore, this paper proposes proposition 1.
Proposition 1. Aggregation, centrality and complexity of urban spatial form will have an impact on energy efficiency. And urban spatial aggregation and centrality are positively correlated with energy efficiency, while urban spatial complexity is negatively correlated with energy efficiency.
In addition, the impact of urban spatial form on energy efficiency is not invariable (Mangan et al., 2020). On the one hand, with the change of urban spatial form, the urban internal population and industrial spatial structure will be dynamically adjusted, and the corresponding energy consumption scale and structure will also be adjusted accordingly (Zeng et al., 2021; Wu et al., 2021a). It can be seen that the effect of urban spatial form on energy efficiency is not necessarily completely linear, but may show nonlinear characteristics. On the other hand, urban space is not completely homogeneous. The heterogeneity of different cities in geographical characteristics, economic development and technological innovation (Peng et al., 2021) makes the impact of urban spatial form on the scale and structure of energy consumption significantly different among different cities (Yu, 2021; Zhang and Gao, 2021). Therefore, this paper proposes the second and third theoretical hypothesis.
Proposition 2. The aggregation, centrality and complexity of urban spatial form may have a nonlinear impact on energy efficiency.
Proposition 3. The marginal effect of aggregation, centrality and complexity of urban spatial form on energy efficiency will show urban heterogeneity characteristics.
Material and Methods
Data
This paper performs an empirical analysis based on cross-sectional data from 282 cities of China in 2017. The cross-sectional data in 2017 is selected as the analysis data set because the original data of urban spatial form variable indicators calculated in this paper comes from the basic remote sensing data source published by Gong et al. (2019), and the latest year of the data source is 2017. In urban spatial form recognition, the most important thing is to obtain the spatial structure data of urban built-up areas, and the urban impervious surface is the main path to extract urban built-up areas (Liu et al., 2021; Gong et al., 2019). The basic remote sensing data source of urban spatial morphology released by Gong et al. (2019) comprehensively considers MODIS and night light data, and effectively separates the impervious surface between urban and rural areas. In order to obtain the spatial form data set of 282 cities in China, we first derived the impervious surface data in 2017, then segmented and extracted the impervious surface grid map by using the segmented city vector map, and then obtained the impervious surface distribution map of 282 cities. At the same time, the landscape index calculation software FRAGSTATS is used to calculate the index data including patch, area, shape, edge and so on. Finally, in view of the dimensional difference of urban spatial form variable index data, in order to eliminate this influence, we also use the extreme value standardization method to normalize all variable indexes.
The independent variable of this study is energy efficiency, which is also calculated through relevant input and output indicators. Among them, the data of some input index variable, such as the number of employees, total investment in fixed assets, and R&D expenditure, are derived from the China Economic and Social Big Data Research Platform of the China National Knowledge Infrastructure (CNKI). The input index of energy consumption refers to the total energy consumption of various types, including coal, oil, natural gas, primary power and other energy consumption. The variable index is obtained by converting the common energy consumption into standard coal and summing it up. The data of output index variable, such as GDP, gross value of industrial output, industrial SO2 emissions, industrial wastewater discharge, are derived from the Economy Prediction System (EPS). The missing data of some variable indicators are supplemented by China Urban Statistical Yearbook and various urban statistical yearbooks.
Identification Methods
Urban Spatial Form
Scientific, reasonable and accurate identification of urban spatial form is the key to ensure the reliability of research results. Based on the existing related research, this paper describes the urban spatial form from the three dimensions of centrality, aggregation and complexity. In order to avoid the tendency and multi-collinearity of the index set, only one characterization index is reserved for each dimension of urban spatial form recognition.
(1) Centrality
Galster et al. (2001) defined the centrality of urban spatial form as the degree to which urban residential or non residential areas are close to the central business district, which can also be expressed as the degree to which urban spatial form is characterized by a single core development model. This paper uses the maximum patch index to measure the centrality of urban spatial form. Among them, the largest patch index is the proportion of the largest patch area in the total urban landscape area, and the largest proportion indicates that the higher the city centrality. The calculation formula is as follow:
Where
(2) Aggregation
Aggregation refers to the degree of agglomeration or separation of patch types in space. Generally speaking, the landscape organized by many discrete small patches in a landscape has a low degree of aggregation; When a landscape is composed of several large patches or the patches of the same category are fully connected, the degree of aggregation is higher. As the core concept of urban sustainable development, the quantitative index of aggregation degree is an effective method to evaluate the aggregation distribution of urban spatial structure. Aggregation development makes urban economic development and function distribution more compact, and effectively shortens the spatial distance between urban patches. The calculation formula is as follows:
Where Pi is the proportion of the landscape occupied by patch type i, and Gi is the proportion of the landscape occupied by like adjacencies between pixels of patch type i;
(3) Complexity
The complexity of urban spatial form mainly refers to the irregularity of patch shape. In landscape ecology, shape index is closely related to edge effect. Therefore, scholars often characterize the complexity of landscape patches based on the area and perimeter of patches. Generally speaking, the urban landscape with highly complex and irregular boundaries will increase the straight-line distance and commuting time between different patches in the city. This paper uses the landscape shape index to describe the regularity of urban spatial form, and uses the perimeter area ratio of urban patches to measure the landscape shape index. The calculation formula is as follow:
Where eik is the total edge length of class i in the landscape, and
Energy Efficiency
There are many indicators and methods for measuring energy efficiency in academia, such as parametric and nonparametric estimation methods. Considering that the super-SBM model not only overcomes the limitations of the traditional SBM model, but also has relatively high accuracy of measurement results (Li et al., 2021), this paper establishes a super-SBM model of non angular, non radial and considering undesirable output to measure energy efficiency with reference to the practice of Wu et al., 2021b. The model is constructed as follows:
In Eq. 1,
For a more comprehensive understanding of energy efficiency in China, a multidimensional analytical framework has been created for energy efficiency identification. The framework characterized has two dimensions (i.e., the inputs and outputs), as shown in Table 1. Number of employees (per 10 thousand people), total investment in fixed assets (per 10 thousand RMB), Energy consumption (kgce/100 million tons), and R&D expenditure (per 10 thousand RMB) are selected as indicators of inputs. GDP (per 100 million RMB), and gross value of industrial output (per 100 million RMB) are selected as an index of desirable output indicators. And industrial SO2 emissions (per ton), industrial wastewater discharge (per 10 thousand t) are selected as an index of undesirable output indicators.
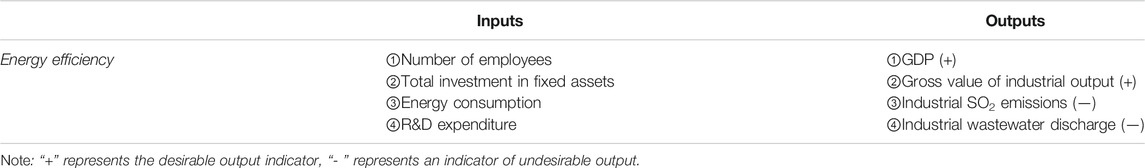
TABLE 1. Input and output variables for energy efficiency identification.
Model Specification
The impact of urban spatial form on energy efficiency has been supported by theoretical research. Moreover, as the three types of representations of urban spatial form, there are obvious differences in the effects and mechanisms of centrality, aggregation, and complexity on urban energy efficiency. In order to further verify the response of urban energy efficiency to the centrality, aggregation, and complexity of spatial form, this paper constructs the following three groups of basic regression models:
Where, the dependent variable
In addition, certain literatures show that the centrality, aggregation, and complexity of urban spatial form may have a nonlinear relationship with energy efficiency. In order to verify this inference, the basic regression model is optimized, and the nonlinear performance of influence effect is investigated by adding the quadratic term of independent variable. The model settings are as follows:
After introducing the quadratic term of the independent variable, the influence coefficient of urban spatial form on energy efficiency is adjusted as follows:
Result
Baseline Regression
Table 2 represents the baseline estimates for the net effect of urban spatial form on energy efficiency. Among them, regression Equations 1–3 only investigate the linear effects of urban spatial centrality, aggregation, and complexity on energy efficiency; In regression Equations 4–6, the quadratic variables of urban spatial centrality, aggregation and complexity are introduced respectively to further investigate the nonlinear effects of urban spatial centrality, aggregation and complexity on energy efficiency. From the estimation results of Equations 1–3, the urban spatial centrality has a significant positive effect on energy efficiency, and the marginal effect is 1.48, which means that every unit increase in the urban spatial centrality will effectively improve energy efficiency by 1.48 units. The complexity of urban spatial form has a significant negative effect on energy efficiency, and its marginal influence coefficient is 0.61, indicating that every increase of urban spatial complexity will lead to a decrease of urban energy efficiency by 0.61 units. The estimation coefficient of urban spatial aggregation is positive but not significant, indicating that urban spatial aggregation has no significant impact on energy efficiency. In other words, from the perspective of overall average effect, it is impossible to clearly distinguish the net impact of urban aggregation on energy efficiency. In summary, it can be seen that part of the proposition 1 has been proved.
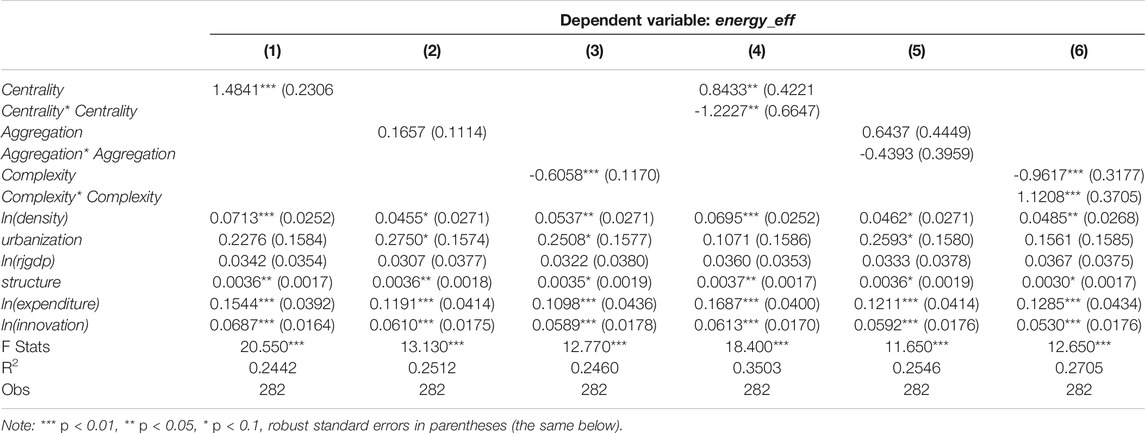
TABLE 2. Baseline regression estimation results.
In regression Eq. 4, the estimated coefficient of the urban spatial centrality is significantly positive, and the quadratic term estimation coefficient is significantly negative, indicating that the effect of urban spatial centrality on energy efficiency shows the inverted U trend characteristic. Further, the inflection point value of this impact effect is 0.3449, and only 5 cities are greater than the inflection point value, namely Shanghai, Shenzhen, Xiamen, Foshan, and Zhongshan. Therefore, it can be considered that for the vast majority of cities, increasing the centralization is conducive to improving energy efficiency. That is to say, for the vast majority of urban samples whose centrality is not high enough, enhancing the area proportion of the largest urban patch essentially strengthens the urban single center structure mode, which is conducive to the intensive consumption and efficient utilization of energy resources. However, strengthening the centrality of cities such as Shanghai, Shenzhen, Xiamen, Foshan, and Zhongshan is not conducive to the improvement of energy efficiency, which may be related to the heavy reliance of the above cities on the single center structure mode. Therefore, the appropriate development of the multi center structure mode is more conducive to the improvement of urban energy efficiency.
In Equation 6, the estimation coefficient of urban spatial complexity is significantly negative and the estimation coefficient of quadratic term is significantly positive, which means that the impact effect of urban complexity on energy efficiency has the characteristics of U-shaped trend. Further calculation shows that the inflection point value of urban complexity is 0.4290, and three-quarters of urban samples are located on the left side of the inflection point value, and one-quarter of urban samples are located on the right side of the inflection point value. This shows that for most cities, increasing the complexity of urban spatial form will reduce their energy efficiency. This is because the more complex the shape and edge of urban space, the more dispersed the energy consumption within the city, which is not conducive to the intensive utilization of energy resources. In Equation 5, the estimation coefficients of urban spatial aggregation and its quadratic term variable are not significant, indicating that from the overall average effect, aggregation has no significant impact on urban energy efficiency. In short, for the vast majority of cities, appropriately improving urban centrality or reducing urban complexity is conducive to enhancing urban energy efficiency. Therefore, the part of the theoretical proposition 2 is proved.
From the estimation results of control variables, the variables such as urban population density, urbanization, industrial structure index, government expenditure level, and innovation ability have consistent estimation results in each regression equation, and the regression coefficients are significantly positive, indicating that the higher the urban population density, urbanization, government expenditure level and urban innovation ability, the more conducive it is to promote the intensive consumption and efficient use of urban energy. In addition, the industrial structure biased towards the primary and tertiary industries is conducive to the improvement of urban energy efficiency. Finally, from the significance test results of the model, F statistical values of each estimation equation are 20.55, 13.13, 12.77, 18.40, 11.65 and 12.65 respectively, which are significant at the 1% level, indicating that the econometric model is well set.
Heterogeneity Analysis
Quantile Regression Estimation
Traditional regression estimation studies the relationship between conditional expectations between independent variables and dependent variables. The quantile regression studies the relationship between the conditional quantiles of independent variables and dependent variables, so it can further identify the heterogeneous effects of urban spatial form on energy efficiency at different quantiles. Furthermore, according to the statistical data, there are significant differences in energy efficiency between different cities, which means that cities with different energy efficiency may be affected differently by urban spatial form. In order to verify this inference, we use quantile regression model (QR) to further investigate the differentiated effect of urban spatial form on the energy efficiency at different quantiles.
Table 3 reports the response of energy efficiency to urban spatial form at the 25th, 50th and 75th quantile. Firstly, from the centrality estimation results, the estimation coefficients of urban centrality variables are significantly positive in all quantile regression models, and the estimation coefficients of quadratic term are significantly negative, indicating that the net effect of urban centrality on energy efficiency shows an inverted U-shaped trend of first rising and then falling. Moreover, the net effect of centrality on energy efficiency gradually strengthens with increasing quantiles, meaning that cities with higher energy efficiency benefit more from the centralization of urban spatial structure. Secondly, the estimated coefficients of urban aggregation variables and their quadratic terms are only significant in the 50 and 75 quantile regression models, and showed inverted U trend features. This shows that for urban samples with high energy efficiency, the net effect of aggregation on energy efficiency will also show an inverted U trend characteristic of rising first and then decreasing. Moreover, cities with relatively high energy efficiency can more benefit from urban spatial aggregation. Thirdly, the estimated coefficients of urban complexity variables are significantly negative in all quantile regression models, and their quadratic terms are significantly positive, meaning that the net effect of urban complexity on energy efficiency exhibited a U-shaped trend characteristic of falling first before rising. Moreover, for urban samples with high energy efficiency, urban complexity has the most obvious inhibitory effect on energy efficiency. Taken together, urban samples with high energy efficiency are more prominently affected by urban spatial morphology changes, whether by facilitation or inhibition.
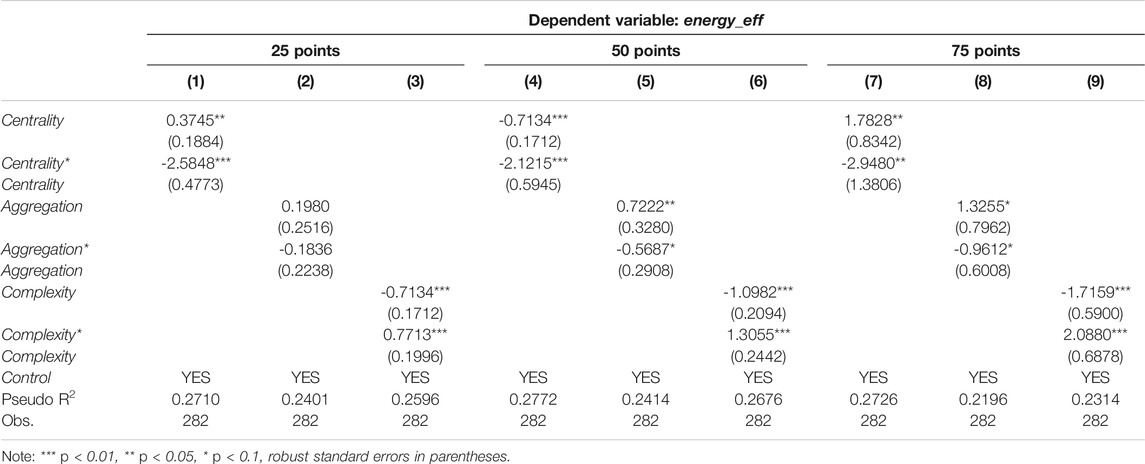
TABLE 3. Quantile regression estimation results.
Urban Heterogeneity Analysis
According to the research of Wu et al. (2020), megacities, large cities, and small and medium-sized cities show certain heterogeneity in spatial structure and economic development level, which means that the impact of urban spatial form on energy efficiency will be different in different levels of cities. Therefore, this paper classifies cities according to the size of permanent population in the municipal area, and divides cities with a permanent population of more than 5 million into megacities, cities with a permanent population of more than 1 million and less than 5 million into large cities, and cities with a permanent population of less than 1 million into small and medium-sized cities (SMCs). Table 4 reports the grouping estimation results of different types of urban samples.
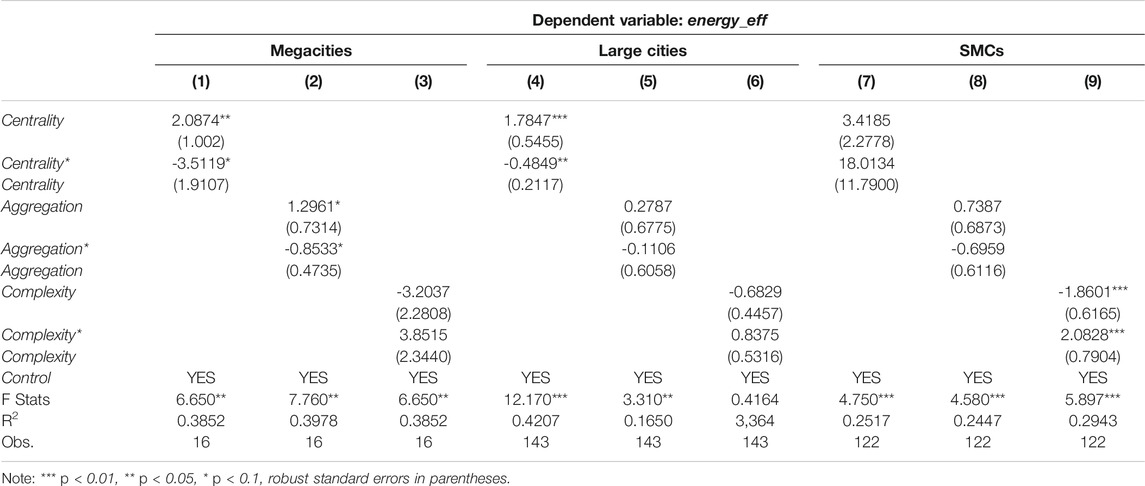
TABLE 4. Urban heterogeneity analysis results.
From the estimates of urban centrality, its primary-term and quadratic-term regression coefficients are only significant in the megacities and large city samples, but not in SMCs. In addition, the net effect of centrality on the energy efficiency of megacities and big cities shows the inverted U type trend of rising first before decreasing, and it will gradually increase with the expansion of urban scale. For urban aggregation, its net effect on urban energy efficiency is only significant in megacities, and also presents a characteristic of inverted U trend of rising first and then decreasing. From the estimates of urban complexity, the net effect on energy efficiency is only significant in small and medium-sized city samples. Moreover, the inhibitory effect of complexity on urban energy efficiency will gradually slow down with increasing complexity. In general, the effects of urban aggregation, centrality, and complexity on energy efficiency show obvious heterogeneity in urban scale heterogeneity, which means that optimizing energy efficiency from the urban spatial form needs to consider urban heterogeneity and adopt classified policies. In conclusion, the theoretical proposition 3 is proved.
Conclusion
This study deconstructed urban spatial form into centrality, aggregation and complexity, and analyzed net effect and its heterogeneity of urban spatial form on energy efficiency with OLS, quantile regression model as well as grouped regression model. The following main conclusions were reached: First, the effect of urban centrality on energy efficiency shows an inverted U-shaped trend with an inflection point value of 0.34, and 98.23% of the city samples are on the left of the inflection point, meaning that strengthening urban centralization for the vast majority of cities helps improve energy efficiency. Second, the effect of urban spatial complexity on energy efficiency shows a U-shaped trend of first decreasing and then increasing, and about three-quarters of urban samples are located on the left side of the inflection point. It can be seen that with the rise of urban spatial complexity, the urban energy efficiency tends to decline, but the decreasing rate gradually decreases. Third, from the perspective of the overall average effect, the net effect of urban aggregation on energy efficiency is not significant. However, in the sample of high quantile for energy efficiency, the net effect of urban spatial aggregation on energy efficiency is significantly positive, but the growth rate tends to decrease. Fourth, whether it is promotion or inhibition, the urban samples with high energy efficiency are more affected by the change of urban spatial form. Fifth, the effect of urban spatial form on energy efficiency shows obvious urban heterogeneity. Specifically, the positive effect of spatial centrality and aggregation on urban energy efficiency is more obvious in megacities, and the negative effect of spatial complexity on urban energy efficiency is more obvious in SMCs. In short, the significant impact of different types of urban spatial forms on energy efficiency provides new ideas for the path selection and optimization of urban energy efficiency improvement, which is to push force from the urban spatial form. That’s to say, optimizing the urban spatial form is one of the important ways to improve the energy efficiency. But the policy setting should give full consideration to the urban heterogeneity and classified policies.
Data Availability Statement
The raw data supporting the conclusions of this article will be made available by the authors, without undue reservation.
Author Contributions
Z-gC: Conceptualization, Writing - original draft, Methodology L-jK: Data curation, Software MW: Methodology, Writing - review & editing H-kL: Data curation, Supervision D-kX: Software, Conceptualization.
Funding
This research is supported by the National Natural Science Foundation of China (Grant No. 71903056), MOE (Ministry of Education in China) Project of Humanities and Social Sciences (Grant No. 19YJC790154), Natural Science Foundation of Hunan Province in China (Grant No. 2020JJ5104), Project of Hunan Social Science Achievement Appraisal Committee (Grant No. XSP21YBZ094), Scientific Research Project of Hunan Education Department in China (Grant No. 19C1038), Research and Innovation Project for Graduate Students in Hunan Province (Grant No. CX20211,126), and Innovation and Entrepreneurship Training Program for College Students in Hunan Province (Grant No. S202010554045).
Conflict of Interest
The authors declare that the research was conducted in the absence of any commercial or financial relationships that could be construed as a potential conflict of interest.
Publisher’s Note
All claims expressed in this article are solely those of the authors and do not necessarily represent those of their affiliated organizations, or those of the publisher, the editors and the reviewers. Any product that may be evaluated in this article, orclaim that may be made by its manufacturer, is not guaranteed or endorsed by the publisher.
References
Bereitschaft, B., and Debbage, K. (2013). Urban Form, Air Pollution, and CO2Emissions in Large U.S. Metropolitan Areas. The Prof. Geographer 65 (4), 612–635. doi:10.1080/00330124.2013.799991
Chen, X., Yi, N., Zhang, L., and Li, D. (2018). Does Institutional Pressure foster Corporate green Innovation? Evidence from China's Top 100 Companies. J. Clean. Prod. 188 (7), 304–311. doi:10.1016/j.jclepro.2018.03.257
Chen, Y., Li, X., Zheng, Y., Guan, Y., and Liu, X. (2011). Estimating the Relationship between Urban Forms and Energy Consumption: A Case Study in the Pearl River Delta, 2005-2008. Landscape Urban Plann. 102 (1), 33–42. doi:10.1016/j.landurbplan.2011.03.007
Esfandi, S., Rahmdel, L., Nourian, F., and Sharifi, A. (2022). The Role of Urban Spatial Structure in Energy Resilience: An Integrated Assessment Framework Using a Hybrid Factor Analysis and Analytic Network Process Model. Sustain. Cities Soc. 76, 103458. doi:10.1016/j.scs.2021.103458
Ewing, R., and Rong, F. (2008). The Impact of Urban Form on U.S. Residential Energy Use. Housing Policy Debate 19 (1), 1–30. doi:10.1080/10511482.2008.9521624
Falahatkar, S., Rezaei, F., and Afzali, A. (2020). Towards Low Carbon Cities: Spatio-Temporal Dynamics of Urban Form and Carbon Dioxide Emissions. Remote Sensing Appl. Soc. Environ. 18, 100317. doi:10.1016/j.rsase.2020.100317
Fang, C., Wang, S., and Li, G. (2015). Changing Urban Forms and Carbon Dioxide Emissions in China: A Case Study of 30 Provincial Capital Cities. Appl. Energ. 158, 519–531. doi:10.1016/j.apenergy.2015.08.095
Galster, G., Hanson, R., Ratcliffe, M. R., Wolman, H., Coleman, S., and Freihage, J. (2001). Wrestling Sprawl to the Ground: Defining and Measuring an Elusive Concept. Housing Policy Debate 12 (4), 681–717. doi:10.1080/10511482.2001.9521426
Gong, P., Li, X., and Zhang, W. (2019). 40-Year (1978–2017) Human Settlement Changes in China Reflected by Impervious Surfaces From Satellite Remote Sensing. Sci. Bull. 64 (11), 756–763.
Hankey, S., and Marshall, J. D. (2010). Impacts of Urban Form on Future US Passenger-Vehicle Greenhouse Gas Emissions. Energy Policy 38 (9), 4880–4887. doi:10.1016/j.enpol.2009.07.005
Jia, Y., Tang, L., Xu, M., and Yang, X. (2019). Landscape Pattern Indices for Evaluating Urban Spatial Morphology - A Case Study of Chinese Cities. Ecol. Indicators 99, 27–37. doi:10.1016/j.ecolind.2018.12.007
Li, H., Chen, Z., and Guo, Q. (2021). The Evolution and Approaches of Information Analysis Service of University Libraries in China. Sci. Tech. Libraries 40 (1), 52–64. doi:10.1080/0194262x.2020.1830921
Liu, J., Jiao, L., Zhang, B., Xu, G., Yang, L., Dong, T., et al. (2021). New Indices to Capture the Evolution Characteristics of Urban Expansion Structure and Form. Ecol. Indicators 122 (4), 107302. doi:10.1016/j.ecolind.2020.107302
Liu, X., Hu, G., Ai, B., Li, X., and Shi, Q. (2015). A Normalized Urban Areas Composite index (NUACI) Based on Combination of DMSP-OLS and MODIS for Mapping Impervious Surface Area. Remote Sensing 7 (12), 17168–17189. doi:10.3390/rs71215863
Liu, Y., Song, Y., and Arp, H. P. (2012). Examination of the Relationship between Urban Form and Urban Eco-Efficiency in China. Habitat Int. 36 (1), 171–177. doi:10.1016/j.habitatint.2011.08.001
Ma, J., Liu, Z., and Chai, Y. (2015). The Impact of Urban Form on CO2 Emission from Work and Non-work Trips: The Case of Beijing, China. Habitat Int. 47, 1–10. doi:10.1016/j.habitatint.2014.12.007
Ma, M., Hietala, R., Kuussaari, M., and Helenius, J. (2013). Impacts of Edge Density of Field Patches on Plant Species Richness and Community Turnover Among Margin Habitats in Agricultural Landscapes. Ecol. indicators 31, 25–34. doi:10.1016/j.ecolind.2012.07.012
Makido, Y., Dhakal, S., and Yamagata, Y. (2012). Relationship between Urban Form and CO2 Emissions: Evidence from Fifty Japanese Cities. Urban Clim. 2, 55–67. doi:10.1016/j.uclim.2012.10.006
Mangan, S. D., Oral, G. K., Kocagil, I. E., and Sozen, I. (2020). The Impact of Urban Form on Building Energy and Cost Efficiency in Temperate-Humid Zones. J. Building Eng. 33, 101626. doi:10.1016/j.jobe.2020.101626
Ou, J., Liu, X., Li, X., and Chen, Y. (2013). Quantifying the Relationship between Urban Forms and Carbon Emissions Using Panel Data Analysis. Landscape Ecol. 28 (10), 1889–1907. doi:10.1007/s10980-013-9943-4
Peng, Y., Feng, T., and Timmermans, H. J. P. (2021). Heterogeneity in Outdoor comfort Assessment in Urban Public Spaces. Sci. Total Environ. 790, 147941. doi:10.1016/j.scitotenv.2021.147941
Quan, S. J., and Li, C. (2021). Urban Form and Building Energy Use: A Systematic Review of Measures, Mechanisms, and Methodologies. Renew. Sustain. Energ. Rev. 139, 110662. doi:10.1016/j.rser.2020.110662
Rong, H., Zhang, H., Xiao, S., Li, C., and Hu, C. (2016). Optimizing Energy Consumption for Data Centers. Renew. Sustain. Energ. Rev. 58, 674–691. doi:10.1016/j.rser.2015.12.283
Shu, Y., and Lam, N. S. N. (2011). Spatial Disaggregation of Carbon Dioxide Emissions from Road Traffic Based on Multiple Linear Regression Model. Atmos. Environ. 45 (3), 634–640. doi:10.1016/j.atmosenv.2010.10.037
Steemers, K. (2003). Energy and the City: Density, Buildings and Transport. Energy and Buildings 35 (1), 3–14. doi:10.1016/s0378-7788(02)00075-0
Tanushri, K., and Sarika, B. (2021). Investigating Application of Compact Urban Form in central Indian Cities. Land Use Policy 23, 105694. doi:10.1016/j.landusepol.2021.105694
Wang, S., Yu, D., Kwan, M.-P., Zheng, L., Miao, H., and Li, Y. (2020). The Impacts of Road Network Density on Motor Vehicle Travel: an Empirical Study of Chinese Cities Based on Network Theory. Transportation Res. A: Pol. Pract. 132, 144–156. doi:10.1016/j.tra.2019.11.012
Wu, W.-p., Zhu, Y.-f., Zeng, W.-k., Wang, M., Yang, D.-x., and Chen, W.-f. (2021b). Green Efficiency of Water Resources in Northwest China: Spatial-Temporal Heterogeneity and Convergence Trends. J. Clean. Prod. 320, 128651. doi:10.1016/j.jclepro.2021.128651
Wu, W. P., Chen, Z. G., and Yang, D. X. (2020). Do internal Migrants Crowd Out Employment Opportunities for Urban Locals in China?—Reexamining under the Skill Stratification. Physica A: Stat. Mech. its Appl. 537 (1), 1–16. doi:10.1016/j.physa.2019.122580
Wu, W. P., Zeng, W. K., Gong, S. W., and Chen, Z. G. (2021a). Does Energy Poverty Reduce Rural Labor Wages? Evidence from China’s Rural Household Survey. Front. Energ. Res. 9, 1–8. doi:10.3389/fenrg.2021.670026
Xiong, X., and Duan, Y. J. (2020). Analysis on the Spatial Differences of Shared Development Level and its Causes in Urban Agglomerations in the Middle Reaches of the Yangtze River. Commercial Sci. Res. 27 (1), 120–128.
Yu, B. (2021). Urban Spatial Structure and Total-Factor Energy Efficiency in Chinese Provinces. Ecol. Indicators 126, 107662. doi:10.1016/j.ecolind.2021.107662
Zeng, S., Su, B., Zhang, M., Gao, Y., Liu, J., Luo, S., et al. (2021). Analysis and Forecast of China's Energy Consumption Structure. Energy Policy 159, 112630. doi:10.1016/j.enpol.2021.112630
Zhang, H., Cai, G., and Yang, D. (2020). The Impact of Oil price Shocks on Clean Energy Stocks: Fresh Evidence from Multi-Scale Perspective. Energy 196, 117099. doi:10.1016/j.energy.2020.117099
Zhang, M., and Gao, Z. (2021). Effect of Urban Form on Microclimate and Energy Loads: Case Study of Generic Residential District Prototypes in Nanjing, China. Sustain. Cities Soc. 70 (16), 102930. doi:10.1016/j.scs.2021.102930
Keywords: urban spatial form, energy efficiency, centrality, aggregation, complexity, China
Citation: Chen Z-g, Kong L-j, Wang M, Liu H-k, Xiao D-k and Wu W-p (2021) The Effect of Urban Spatial Form on Energy Efficiency: A Cross-Sectional Study in China. Front. Energy Res. 9:792199. doi: 10.3389/fenrg.2021.792199
Received: 09 October 2021; Accepted: 04 November 2021;
Published: 20 December 2021.
Edited by:
Yong-cong Yang, Guangdong University of Foreign Studies, ChinaReviewed by:
Kexing Wu, Shanghai Lixin University of Accounting and Finance, ChinaHuihui Wang, Cleveland State University, United States
Copyright © 2021 Chen, Kong, Wang, Liu, Xiao and Wu. This is an open-access article distributed under the terms of the Creative Commons Attribution License (CC BY). The use, distribution or reproduction in other forums is permitted, provided the original author(s) and the copyright owner(s) are credited and that the original publication in this journal is cited, in accordance with accepted academic practice. No use, distribution or reproduction is permitted which does not comply with these terms.
*Correspondence: Min Wang, aGVubWFuQDE2My5jb20=; Hang-kai Liu, bGhrMjAwMDE4NTcwNTUyNjE2QDE2My5jb20=; Da-kai Xiao, eGRrMTIzMzIxQDE2My5jb20=; We-ping Wu, d3V3ZWlwaW5nLjIwMDdAMTYzLmNvbQ==