- 1School of Mechanical Engineering and Automation, Northeastern University, Shenyang, China
- 2Key Laboratory of Vibration and Control of Aero-Propulsion System, Northeastern University, Shenyang, China
- 3Vehicle Measurement, Control and Safety Key Laboratory of Sichuan Province, Chengdu, China
The accurate estimation of the battery state of charge (SOC) is crucial for providing information on the performance and remaining range of electric vehicles. Based on the analysis of battery charge and discharge data under actual vehicle driving cycles, this paper presents an online estimation method of battery SOC based on the extended Kalman filter (EKF) and neural network (NN). A battery model is established to identify and calibrate battery parameters. SOC estimation is conducted in the low-SOC area by exploring the relationship between battery parameters and SOC through many experimental results. In the fusion online estimation method, the NN is carried out to propose the estimation as the global mainstream trend providing a high precision feasible region; the EKF algorithm is used to provide the initial assessment and the local fluctuation boundary revision. Verified results show that it can improve the SOC estimation in low-battery capacity accuracy. It has achieved good adaptability to the estimation accuracy of low battery capacity SOC in different cycle conditions.
Introduction
As the ecological environment gradually deteriorates, designing the cleaning and efficient vehicle has attracted significant attention. Among various cleaning vehicles, pure electric vehicles (PEVs) are popular best with their environmental friendliness. Compared to other forms of energy, Lithium-ion batteries as the power source have the merits of lightweight, long cycle life, high energy, and low self-discharge rate. The State of Charge (SOC) is an essential state of battery parameter. It is defined as the ratio of remaining power to total power. The accurate estimation of the battery status not only helps to provide information about the current and remaining performance of the battery but also provides a guarantee for the reliable and safe operation of the PEV (Ranjbar et al., 2011; Xiong et al., 2017; Xu et al., 2021). Over-discharging and overcharging a battery can seriously affect its condition, as doing so accelerates battery degradation. Achieving a good accuracy of SOC, furthermore, is essential for the battery management system (BMS) controlling and updating data, detecting faults, equalizing battery voltage to avoid any overcharging/over-discharging. The SOC value cannot be measured directly due to its complicated electrochemical reactions and performance degradation over time caused by various internal and external factors. The estimation of SOC can only be obtained indirectly based on the measurement of other parameters. Factors such as estimation methods, battery models, and optimization methods will all have a direct impact on the accuracy of SOC estimation (Zheng et al., 2018). However, some critical parameters will be easily affected when age, environmental temperature changes, and discharges at high rates.
Literature Review
There are many studies on how to improve the accuracy of the SOC estimation. The ways of SOC estimation can be classified into three groups: character-based methods, model-based methods, and data-driven methods.
Character-Based Methods
This method mainly relies on the battery parameters, like the open-circuit voltage (OCV), battery current, or some other characteristic curves. It requires a non-linear relationship between the electromotive force and the SOC when the battery is not loaded. For example, Barai A et al.have proved that a battery OCV is directly related to the discharge capacity by testing and found that the battery capacity can change up to 5.0% (Barai et al., 2015; Ali et al., 2019). S Lee et al.proposed a modified OCV-SOC relationship to solve the problems caused by the extended Kalman filter, which can be easily affected by varying relationships (Lee et al., 2008). The open-circuit voltage can be obtained by OCV testing, but it is a time-consuming period. So this method cannot meet the requirements of real-time measurement. Besides, the non-linear relationship varies from battery to battery. What is more, there exist hysteresis characteristics in Li-ion batteries.
The Ampere-hour Integration method calculates the SOC by integrating the current over time. This method is also be called as coulomb counting method. The researchers take the charging and operating efficiencies into consideration to enhance estimation based on column counting (Ouyang et al., 2014; Meng et al., 2018). Moreover, the intelligent estimation method was demonstrated effective by many experiments. Xu J et al.combined the OCV method with the ampere-hour method to make up for the lack of ampere-hour integration method in real-time estimation (Zhang et al., 2018). As the name showed, The Ampere-hour Integration method needs to know the accurate current at every moment. So an excellent current sensor is required. Especially in high temperature environmental and a large scale of current fluctuations, the current must be captured accurately. Otherwise, the error will be accumulated continuously. Although the difference is not apparent in the short term, the error will get out of control after a long period. So, on the one hand, we can quickly get the accurate SOC without modeling in theory with this method; on the other hand, only having a precise current sensor and testing in a short time can we use this method.
The Model-Based Method
The Kalman filtering algorithm is a standard adaptive filtering algorithm that is used in model-based methods. The typical estimation process commonly found in this type of algorithm includes prediction-measurement-correction. The core is a set of recursive equations, including the SOC estimated value and reflecting the estimated error. The estimated error is given in the covariance matrix (Zhou and Li, 2015; Qiu et al., 2020). However, this method is only suitable for linear systems, but the battery is a nonlinear system. Thus, the Extended Kalman Filter Method, which can be applied in the nonlinear system, occurs. It performs Taylor expansion on the state filter value, omitting the second and above high terms. Only with the higher battery model accuracy and the computing power of the battery management system, it could be applied to the situation where the current fluctuates wildly, and the SOC estimation error could also be improved. Besides, we can obtain some battery model parameters by taking aging and lifetime into consideration with the help of some appropriate tools such as MATLAB Simulink. J Lee et al. introduce a reduced-order EKF so that the calculation time can be decreased a lot (Yang et al., 2021). With the Dual Extended Kalman Filter (DEKF) algorithm, Hu et al. estimated the SOC and capacity by linking the battery OCV with SOC and capacity (Zhang and Xia, 2011; Bai et al., 2014; Shrivastava et al., 2019). However, with the modified EKF, the previous studies only improved the limited accuracy of the SOC estimation in the normal range; it is far from fulfilling the demands for low-range SOC estimation (Xiong et al., 2014; Wang et al., 2019; Fu et al., 2021). In general, filter-based methods can achieve high-precision estimation under certain conditions. For the non-linear scenario of battery SOC estimation, the extended Kalman filter method applies linearization approximation to the non-linear system to solve this problem. However, the stability of linearization error still needs to be improved (Xiong et al., 2014). The unscented Kalman filter method is used to enhance the accuracy of the sampling process and the estimated state, but the convergence speed is still insufficient (Zhang and Xia, 2011).
Data-Driven Methods
The Neural Network method uses a mathematical model composed of interconnected artificial neurons stimulated by a biological neural network to predict the past data output of a nonlinear system. This method has parallel structure and learning ability and can solve the problem in a nonlinear system. According to its form, we can easily know that much reference data is needed to train the system. Proper selection of variables and training methods are also vital to the final estimation accuracy. Thus this method depends too much on the designer’s experience. Based on Neural networks, Neuro-fuzzy prediction makes the neural network fuzzy and uses fuzzy logic to simulate people’s fuzzy thinking. It is also essential to choose the correct number of variables--too few variables will lower the accuracy of the prediction; on the contrary, too many variables will make the prediction process more complicated. Compared with the Neural Network, this method is more convenient for dealing with qualitative issues, but it can not offer a pretty exact solution. O’Gorman et al.pioneering proposed the Neural Network method, which makes the models difficult to describe using mathematical models (Lipu et al., 2018; Yang et al., 2019; Hannan et al., 2020). Gerard O et al.establish a battery neural network performance model, using neuron weights to replace difficult-to-measure state variables (He et al., 2014).The shortcoming of this kind of approach is time-consuming and the low efficiency in the estimation process (Kang et al., 2014; Tian et al., 2017). Overall, the data-driven method is not sensitive to the performance of the model and external environmental factors. In the case of sufficient training data samples, its estimation accuracy can achieve relatively ideal results.
The above-mentioned various battery SOC estimation methods require more battery dynamic and steady-state information in electric vehicle applications (Hannan et al., 2018). Furthermore, character-based methods, model-based methods, and data-driven methods provide a higher accuracy SOC estimation for LIBs in the normal range, but there is still room for improvement. A good balance between the current state of the battery, the estimation accuracy, and the calculation cost has always been a significant problem that researchers are trying to solve. However, few researches have been found on batteries at low-capacity range with the fact that the estimation of SOC cannot get accurate for its non-linearity (Ouyang et al., 2014). Also, with the capacity-induced error, initial SOC error, current measurement error, and voltage measurement error, the error in the model estimation intensifies the difficulty of SOC estimation in the low-capacity range, leading to a more conservative SOC range. Accurate SOC estimation in the low-capacity range can improve the efficiency of battery capacity, which is of great significance for reducing mileage anxiety.
Motivation and Original Contribution
When the battery SOC is close to 0%, the discharge would be stopped to protect the battery from over-discharging. The estimation is quite crucial for the low-SOC range (Xing et al., 2014; Lee et al., 2017; Yang et al., 2017). In EV applications, the battery management system is conservative if the battery SOC estimation is inaccurate at the low-SOC range, which makes it challenging to bring accurate mileage information to the driver and lead to usage anxiety and troublesome, to name a few, the EVs may stop working in advance, change the trip plan for extra charging behaviors, or break down en route, etc. Therefore, accurate estimation of the low capacity area not only helps to prolong the driving range but also gives assurances of safe and reliable vehicular operation.
There are indeed many estimation methods for SOC, and good estimation results have been achieved. However, from the conclusion, the overall low-capacity range is the interval with a more significant estimation error. Whether Lithium iron phosphate (LiFePO4) or Nickel Manganese Cobalt Oxide (NCM) cells have a significant drop in voltage at the end of discharge, and much attention has been paid to the fact that low capacity SOC estimates have an obvious error (Hannan et al., 2020; Yang et al., 2021). And the influencing factors are also various (such as the continuous reduction of the capacity, the accuracy of the battery model parameters with the voltage and current changes, etc.). Moreover, many studies are based on the laboratory conditions of the battery (such as constant current and constant voltage (CCCV) and dynamic stress test (DST)). The estimation effect is still to be tested under the actual driving cycle. Based on the above reasons, it is recommended to delineate a more conservative SOC use range and a few studies to further optimize the SOC estimation in the low-capacity range. To fill the above gap, this paper proposes an estimation method countering the low capacity situation. The presented process explores the relationship between battery parameters and SOC and,accordingly, establishes the appropriate model and estimation algorithm. The experiments on the low-capacity area of lithium batteries are carried out and analyzed.Then we use a fusion-based method based on neural network and EKF to conduct the SOC online estimation in the low-SOC area.
Configuration of This Paper
The remainder of this paper is organized as follows: Modeling Study introduces the primary methods for this study, illustrates the setup of the experiment, the battery model used, and parameter identification, and SOC Estimation algorithm discusses the methodology for SOC estimations. Results and discussion presents the estimation results of the low capacity range SOC based on the proposed method with necessary discussions. Finally, the conclusion of our approach is given in Conclusion.
Modeling Study
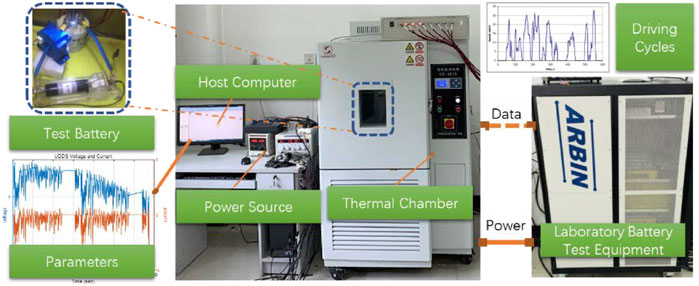
The experiment setup is shown in Figure 1. Based on the three driving cycles which are the Urban Dynamometer Driving Schedule (UDDS), Extra Urban Driving Cycle (EUDC), and New York City Cycle (NYCC), the Arbin LBT is used to collect the charging/discharging data of the battery to construct the training and verifying data set for the follow-up steps. The ambient temperature is set to 20°C when the battery is placed in the temperature chamber. Different driving cycles represent the battery responsiveness to different working conditions, and further characterize the adaptability of SOC estimation to different environments. To avoid the difference in battery operation cycles caused by the selected driving cycle duration, the battery parameters are normalized to ensure a basis for comparison and provide a more reliable guarantee for future SOC estimations applications.
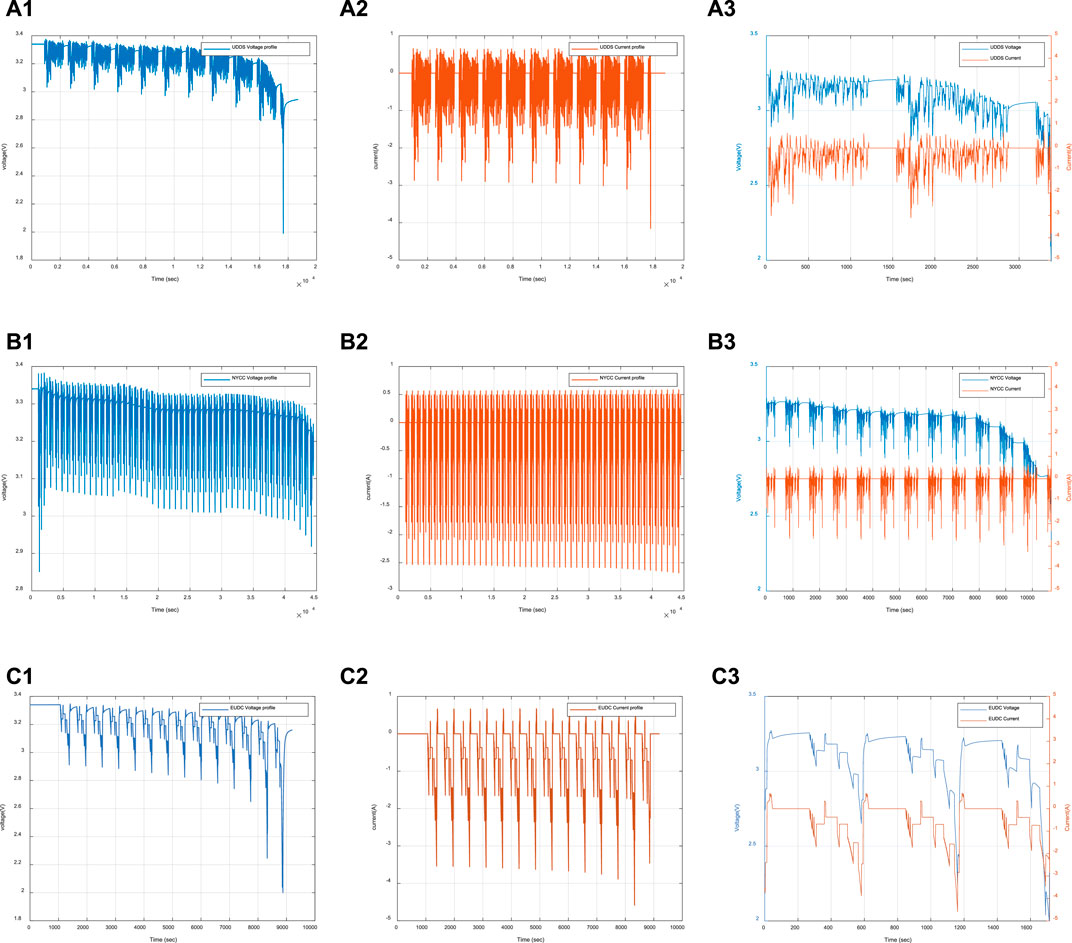
Figure 2 shows the whole battery voltage and current variation trend against the three driving cycles (UDDS, EUDC, and NYCC. Different from the traditional laboratory battery test cycles, for example, the UDDS driving cycle corresponds to variable road requirements, and the output of the battery is more close to the actual vehicle operation states of the battery voltage and current changes, without considering the temperature fluctuation. According to the battery voltage and current state, it is the purpose of this study to improve the accuracy of the NCM (Nickel Manganese Cobalt Oxide) battery SOC estimation when the battery voltage drops from the low-capacity range state to the cut-off voltage. Figure 2A1,A2,B1,B2, and C1,C2 are the variation curves of voltage and current in the three driving cycles, respectively. This article defines the low-capacity range as the SOC variation range between 0.2–0. Based on this, further reconstructed voltage and current change curves of the selected area are shown in Figures 2A3,B3, and C3, which are the data set of this research.
Among them, the reference value of SOC is obtained using the coulomb counting method given later. In the training process of the neural network, the initial state unit is set as zero, and the weight is randomly selected. The amount of data in the research is about 22,000. To verify the effectiveness of the algorithm, 50–80% of the data is used to train the network, and the remaining data is used to test the network. After weighing, representative data in the low-capacity interval are selected as training samples, and the rest data are used for verification (for example, some data in the data segment of 1000 ∼ 4000 s, 5000-8000 s,9000 ∼ 10000 s in Figure 2B3 are used for training, and the rest are used for verification). In actual application scenarios, voltage, current signals, and SOC values recorded in real-time by selecting a suitable time window can meet the requirements of training samples. Therefore, combined with the actual data volume, this paper establishes 30% for testing.
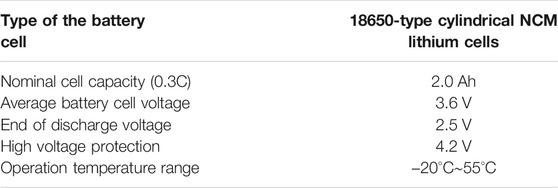
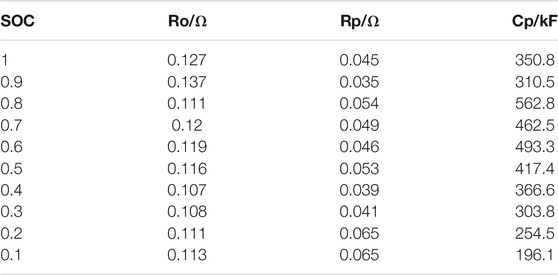
The equivalent circuit model with one RC item (Lu et al., 2018) is used in this study, as shown in Figure 3, where IL is the load current with a positive value when discharging and a negative value when charging, Uoc is the open-circuit voltage (OCV), UL is the terminal voltage, Up is the polarisation voltage, Ro is the equivalent ohmic resistance, Rp is the equivalent polarisation resistance, and Cp is the equivalent polarisation capacitance. The battery cell characteristics are shown in Table 1.
To evite the estimation errors caused by the operating environment and aging arising in the traditional offline identification method, online model parameters identification has been put forward. The electrical behavior of the Thevenin model can be expressed as follow by Eq. 1.
where s is the frequency operator.
By combining the adaptive techniques, the model can automatically adjust to changing systems. The influence of temperature is neglected and then the Eq. 1 can be rewritten as
where k = 1,2,3…, a1, a2, and a3 are coefficients that are defined by
where T is the constant sample time.
According to Eq. 2, we can define three new vectors as follow:
then the Eq. 2 can be expressed by
The terminal voltage UL(k) and current IL(k) are sampled at a constant period, and according to Eq. 5, the vector θ can be identified by the recursive least squares algorithm with an optimal forgetting factor, described as
where
According to the identified vector θ, the model parameters of the battery, Ro, Rp, and Cp, can be solved by the expressing of a1, a2, and a3, which is shown as
SOC Estimation Algorithm
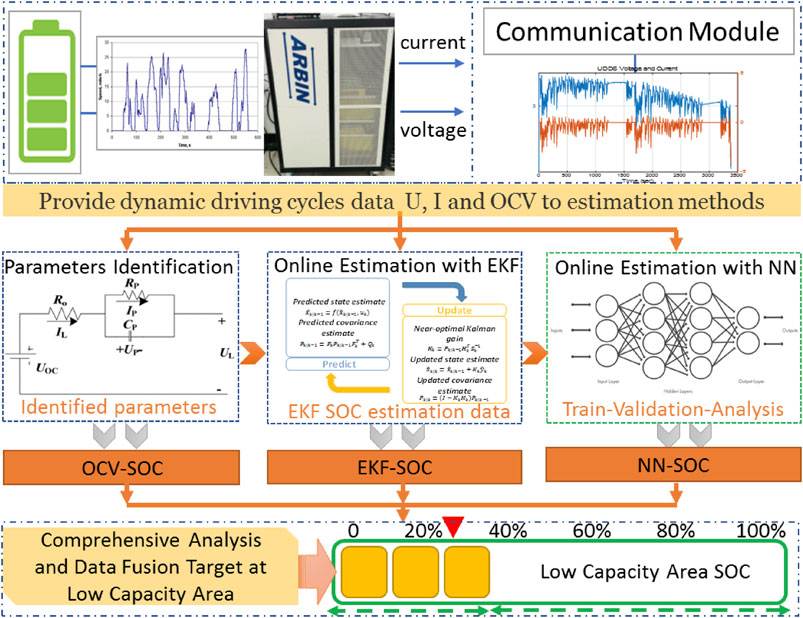
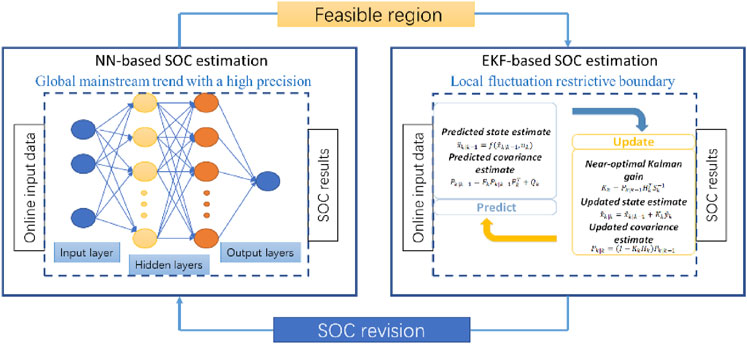
The presented method is to obtain the precise estimation for the battery with low capacity. Concerning the extreme non-linear characteristics of the battery in the low SOC range, the EKF and NN are combined to improve the estimation accuracy. The algorithm contains two steps: in the first step, the EKF is conducted to achieve a preliminary estimation; then, the NN is used for the correction based on the EKF results. The overall framework of the presented method is shown in Figure 4. The voltage and current parameters of the lithium-ion battery are collected when the battery is in the low SOC capacity, rather than the data in the full SOC range. The RC model is used to predict the response characteristics of the battery. Then, the characteristic parameters of the battery model are provided to the EKF algorithm for estimation and correction of the battery SOC. The EKF based estimation algorithms in the low capacity SOC estimation are not satisfactory in most situations. When the SOC is lower than 0.3, the SOC error seems to be higher, which indicates that the non-linear behavior of the battery under low SOC becomes more complicated, making it more challenging to estimate the SOC. So, we use the EKF SOC estimation data set in the low SOC range as a training parameter to train the NN network to improve the SOC estimation accuracy, especially in the low capacity area of the battery. At the same time, the SOC result identified by the model, by the EKF, and by NN algorithms are appraised the effect of the estimation after comprehensive analysis and data fusion.
Step 1: Coulomb counting method
Although it is generally believed that Coulomb counting is regarded as a more traditional SOC estimation method, it is still widely used in actual implications, especially in the initial stage of battery use. The initial SOC of the battery has been with high accuracy. After the battery is fully rested, excluding the influence of hysteresis and relaxation effects, and accurately obtaining battery capacity information, the estimation effect of its SOC is trustworthy. For this current-based method, the SOC can be calculated as the ratio between the remaining coulombs and the assumed battery capacity. The Coulomb counting method for SOC estimation can be approximated as follows:
Where ηbat is the Coulomb efficiency of the battery and can be further expressed as:
In the above equation, t is the unit of time (seconds), i (t) is the current through the battery at time t, soc (t0) is the SOC at the instant t = 0, and soc (t) is the interval SOC at t, Cbat is the battery capacity.
Step 2: initial estimation based on EKF
Here EKF is used as an optimum state estimator for nonlinear systems and works by recursion. A nonlinear discrete system can be defined by
where xk is the estimated state of the nonlinear system at time k; uk-1 is the external input variable at time k-1; yk is the output of the nonlinear system at time k; wk and vk are respectively the system process noise array and the measurement noise array, which are uncorrelated zero-mean white Gaussian noise with covariance matrixes Qk and Rk.
To apply the EKF algorithm to battery SOC estimation, we express the electrical behavior of the Thevenin model in the discrete form, which is shown as
where Δt equals sampling time.
SOC can be updated by
where: Δt equals sampling time; Ca is the usable capacity of the battery.
Thus, the state space equation and the measurement equation can be described by
where xk is the state variable, which is consist of Up and SOC; yk is the observable variable including UL; vector xk, yk, and matrix Ak, Bk, Ck, and Dk is expressed as
The iterative formulas of the algorithm are shown as
The use of the EKF method needs to meet certain assumptions, the OCV characterization that represents the battery voltage as a function of SOC, and the functional relationship for the voltage drop due to impedance and hysteresis within the battery could be a nonlinear relationship. Battery model parameters and noise-related statistics need to be known.The process and measurement noise need to have a clear distribution law (such as normal distribution) with the mean and variance available.
However, there are more or less aspects in our previous research that lead to violations of general model assumptions, such as the initial SOC error, the OCV-SOC modeling error, parameter estimation error, statistical parameters of the process noise. The source of these inaccuracies is incorrect parameter values or model structure.
Furthermore, in most practical applications, the battery capacity will change a lot with the battery aging process, and it is not easy to re-calibrate the battery capacity in time. The initial SOC error accumulation is an essential factor that cannot be ignored.The noise matrixes of the system and measurement in the method of EKF are not the same for the whole SOC estimation process, and its assumptions about the EKF application conditions are difficult to meet in actual operation. These all have generated the need for a more flexible estimation algorithm to make a reasonable and accurate estimation of the battery state. So the next introduction of NN-based algorithms meets the above requirements.
Step 3: Neural network and fusion frameworks
The inputs of the neural network are battery current and voltage, while the output is the battery SOC. The nodes between two adjacent layers are interconnected with weights. On the premise of meeting the error allowance, feedforward neural networks are selected in this paper from the perspective of simplicity of network architecture, real-time performance of future vehicle applications and reduction of computing requirements, but it is not limited to this method. Other neural network algorithms are also applicable to the SOC estimation scenarios with sufficient training data samples. The structure process of the network used in this article is divided into four steps.
1) Initialization: set the weight and bias value of the network as random variables and ensure that the selected value is within the feasible range. At the same time, set an appropriate number of iterations.
2) Selection of the transfer function: activate the network according to the input and expected output of the network, and select the appropriate transfer function to calculate the output of the corresponding neuron in the hidden layer and the output layer.
The hidden layers and output layers are processing layers with the activation function at each node. The hyperbolic tangent sigmoid function is often used in the hidden layer as an activation function. It is defined as:
In the choice of activation function, a linear transfer function is selected in the output layer to deal with regression and fitting problems. The output of a processing node in the first hidden layer is written as:
where I and U are the inputs of the network,
The output of a processing node j in the hidden or output layer is given by:
where
3) Error calculation: Calculate the error in the output layer and the hidden layer, and the error will be passed back to the previous network layer. The output error is calculated as,
4) Update: According to the error situation, adjust the corresponding weight and biases value within the threshold range.
In this study, the input of the neural network is the current and voltage measurements, and the output is the SOC. The sample number of the input parameter K refers to data before the present moment as input, which is [I(t), I(t-1), I(t-2), …, I(t-k), U(t), U (t-1), U(t-2), …, U(t-k)], the output is the present SOC(t), k is the parameter that needs to be determined before training.
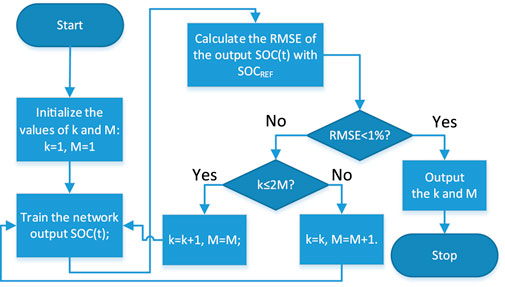
In the choice of NN network, this research follows some empirical rules to determine the appropriate neural network structure. First of all, according to the literature (He et al., 2014; Lipu et al., 2018; Hannan et al., 2020), the two-layer neural network can meet the demand. In the subsequent analysis of the results, the comparison of the impact of the two-layer and multi-layer neural networks on the accuracy is selected. Second, the number of suitable neurons (M in Eq. 18) will cause the overfitting and underfitting of the data. Therefore, the parameter selection process is determined through the appropriate NN network selection, that is, the values of k and M. The principle of selecting network parameters is to acquire the smallest values of k and M under an acceptable degree of error. If the error is unacceptable, increase the values of k and M accordingly, the final selected result is K = 25, M = 15. The flowchart is in Figure 5, and the specific selection process is as follows:
1) Initialize the values of k and M: k = 1, M = 1, which respectively determine the dimension of the input vector and the value of the hidden layer neuron.
2) Train the network based on the current k and M values, and output SOC(t);
3) Calculate the RMSE of the output SOC(t) and the reference SOC value;
4) Determine whether the RMSE is less than 1%. If RMSE<1%, the value of k and M ends; otherwise, such as k ≤ 2M, k = k+1, M = M; otherwise, k = k, M = M+1.
According to the test results, the nonlinearity of battery model parameters is quite evident in the low SOC range, so a neural network is used to obtain the implicit association between battery parameters and SOC. Considering the local outlier fluctuations that may occur in the NN method and the relative stability of EKF, according to the actual situation, the results of the two estimations are fused to obtain better estimation accuracy. The NN is trained based on the test data of the lithium-ion battery at a low SOC range. The inputs of the neural network are the battery current and voltage, while the output is battery SOC. In the local low capacity area, the abnormal value based on the NN-based SOC estimation is corrected by EKF which is as the boundary reference value, and the NN that realizes the global trend is guaranteed to be supplemented by EKF calibration to achieve the integration of the advantages of the two estimations and improve algorithm’s effectiveness. The scheme of the fusion algorithm is illustrated in Figure 6. In this step, the SOC estimation from EKF is firstly used to train the NN and also as the fluctuant boundary to improve the local algorithm’s effectiveness.
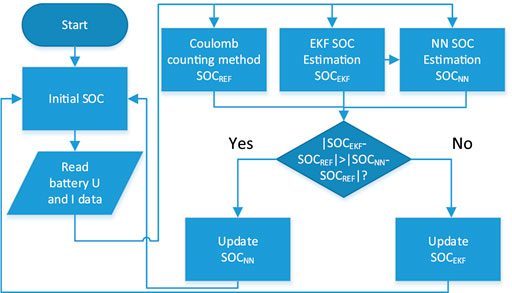
In Figure 7, the flowchart briefly describes the fusion process of the two estimation methods, and
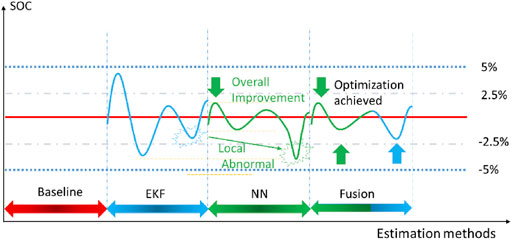
When the battery is in the low-capacity range, the voltage and current changes bring many challenges to the estimation of SOC. The basic idea of battery SOC estimation is to assume that the effect of NN estimation is a more accurate output choice. Still, EKF and NN are estimated in parallel during constant competition. When NN outputs appear local abnormal value, the fusion algorithm optimizes the final output estimation result according to the current EKF and the NN estimation result to achieve the overall estimation accuracy. Figure 8, shows the fusion process in the form of a schematic diagram. Although the Coulomb counting method has an inevitable accumulated error, its value in a single period could still be regarded as a reference. In the previous training, the error of the NN estimation result regarding the reference value is relatively low, so the abnormal data here refers to the absolute value of the NN estimated relative to the reference value is greater than the EKF estimated relative to the reference value, as shown in Figures 6, 7. Here, the deviation of the positive and negative two-way error from the reference value is considered.
Results and Discussion
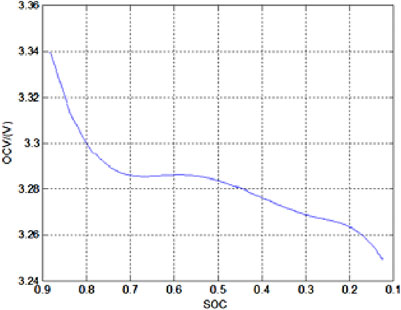
According to the aforementioned battery model-based estimation method, a fully charged battery is recorded as SOC 1. The open-circuit voltage data is recorded after the battery is fully static. Discharge the battery with a current of 0.2C and take breaks to re-record the open-circuit voltage again when the SOC is 0.9. Repeat the above process until the SOC is 0.1 to obtain the functional relationship between SOC and OCV, as shown in Figure 9. The results of other parameters identified in the battery model are shown in Table 2.
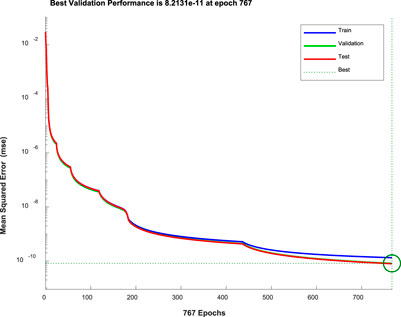
As mentioned earlier, this study selected 70% of the data volume as the training basis of the neural network, the temperature remains constant, and the actual changing voltage and current in the low-capacity range corresponding to the driving cycle have been used as input. Considering the voltage and current unit and variation range differences, the input parameters are all normalized, and the output is the corresponding SOC change. The neural network training method is Levenberg-Marquardt, and the maximum number of iterations is set to 1000. Figure 10 shows the training result, which contains two hidden layers, and each hidden layer contains 15 neurons. The training program stops at 767 epochs. At this time, the MSE value drops to 8.213×10⁻⁵, indicating that the error between the estimated value and the true value is minimal, which proves the effectiveness and reliability of the training.
Generally speaking, the root mean square error (RMSE) and mean absolute error (MAE) are selected to evaluate the accuracy of the battery SOC estimation method, and the calculation expression is as follows:
Where n is the number of SOC data,
To evaluate the effect of the presented method, the experiments are carried out. Figure 11A illustrates the voltage and current variations under the UDDS driving cycle and the estimation analysis. In this study, we are mainly concerned with the situation when the battery pack is short of energy. Therefore, we only discuss the results in the low battery capacity area. Through literature review, some EKF methods could obtain relatively good SOC estimation accuracy for laboratory conditions (such as constant current and Constant Voltage (CCCV)), and the MAE is about 3%. When the test condition changes to the Dynamic Stress Test (DST), the MAE is about 6% (Ranjbar et al., 2011). The actual working conditions used in our case are equivalent to or more complex than DST, and the MAE estimated by EKF is about 3%, depending on the different test cycles. Therefore, the estimated level of EKF can be considered as reaching the mainstream level, and having reference value.
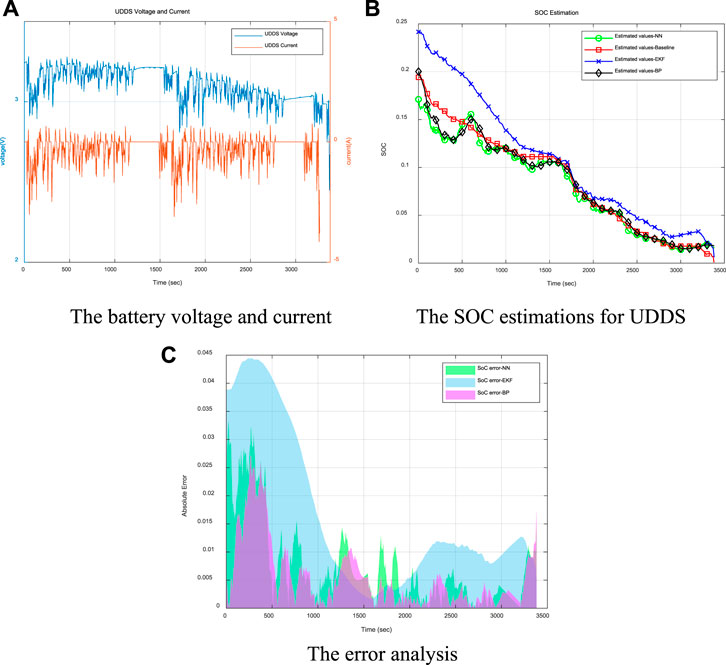
FIGURE 11. The evaluation results for low battery capacity area under UDDS driving cycle. (A) The battery voltage and current (B) The SOC estimations for UDDS. (C) The error analysis.
The SOC obtained from the coulomb counting method is used as the benchmark for estimation analysis, as shown in Figure 11B. From the results, we can notice that the presented NN-based SOC estimation can achieve more approaching values compared with only using the EKF. To better observe the estimation precision, the error distributions are illustrated in Figure 11C, where indicates that the NN-revised SOC estimation is lower in the entire range. The RMSE and MAE of the NN estimation in this range are 0.0162 and 0.008, respectively, reduced by 45.7 and 77.7% compared with EKF. That is of great significance for fully exploring the potential of battery driving range, reasonable specification of battery charging strategy, ultimately improving the accuracy of battery SOC estimation, and expanding the acceptance of electric vehicles. It can be noticed that the SOC estimation values of the NN-based algorithm is always lower than EKF for UDDS driving cycle and fluctuates around the baseline (of course, this does not exist in the real-time situation), and there is no NN-based SOC estimation that is higher than the EKF estimation situation. Compared with the results of the literature (He et al., 2014; Kang et al., 2014; Xu et al., 2021), when the NN method is used for the same or similar actual driving cycle conditions, the SOC estimation results are improved by about 3%. At the same time, for the UDDS driving cycle, the SOC estimation based on the BP neural network algorithm is carried out for low-capacity area. The accuracy of the estimation is basically similar to the feedforward neural networks as shown in Figures 11B,C. Several local areas SOC estimations are better than the method selected in this article. However, the simulation time is 34.75s, which is slightly increased compared to the corresponding situation in Table 3. After comprehensive consideration, this paper selects feedforward neural networks.
In Figure 12A, for the EUDC driving cycle, the current discharge range is deep, and the voltage drop is pronounced compared to UDDS. We found the same problem in the low-capacity SOC estimation; that is, the EKF estimation method generally has a higher error. Also, the estimated results of the trained NN in the low SOC range for the EUDC driving cycle are shown in Figure 12B.
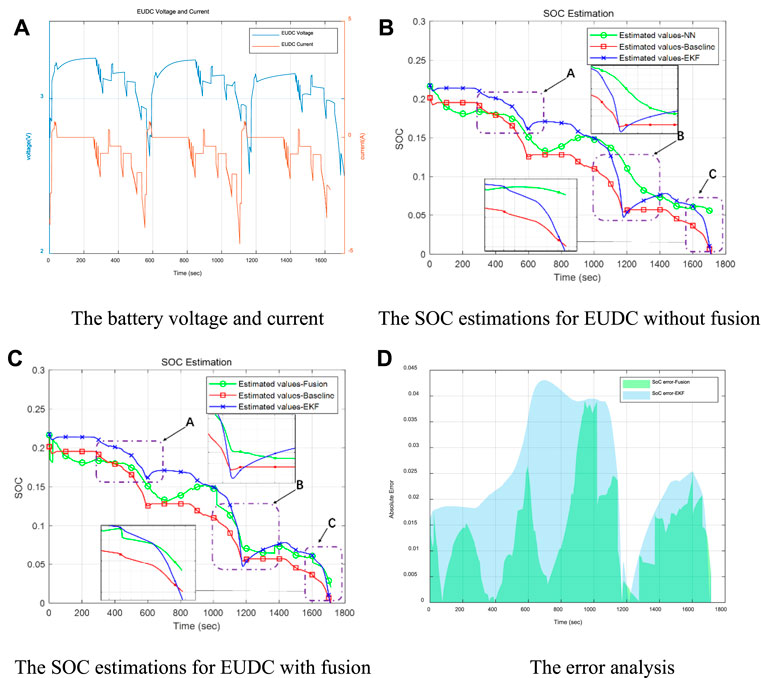
FIGURE 12. The evaluation results for low battery capacity area under EUDC driving cycle. (A) The battery voltage and current (B) The SOC estimations for EUDC without fusion. (C) The SOC estimations for EUDC with fusion (D) The error analysis.
The solid red SOC line is the comparison benchmark for the estimated effect calculated by coulomb counting. In Figure 12B, there are three SOC observation windows as A, B, and C. A better reflects the accuracy of the NN algorithm. In the two observation windows B and C, the EKF algorithm has obvious advantages. Therefore, the fusion estimation based on the above two methods is based on the NN algorithm with better global accuracy, but there will inevitably be local data abnormalities. Therefore, the boundary effect of EKF is used to improve the local SOC estimation accuracy. As shown in Figure 12C, after the improvement, the SOC estimation curve in the two observation windows of B and C refers to the tendency of the EKF estimation value with a more minor error, which overcomes the abnormal value fluctuation of the NN algorithm and achieves the fusion of the two estimation methods. For the fusion-based estimation, the absolute error is mostly within 2%, but the maximum error of the EKF method at some points is greater than 4%, in Figure 12D. Considering the discharge characteristics of NMC batteries, which do not have a long discharge plateau, the SOC estimation error mainly appears in the low-capacity area at the end of discharge. In this attempt, by using more hidden layers training the neural network, although a lower error can be obtained, it is also accompanied by the potential risk of overfitting. For example, the selected multi-layer neural network already has a lower EMS error. However, the test results are not significantly improved compared to the two-layer results and increase the computational demand. See Table 4 below for a detailed comparison.
Due to the frequent charging and discharging behavior in the driving cycle, the low-capacity area of NYCC runs for a long time, making the battery voltage and current changes show prominent periodic characteristics, shown in Figure 13A In the SOC estimation for the NYCC driving cycle, it can be seen from Figure 13B that the comparison between the EKF-based and NN-based methods in the low SOC range. By analyzing the SOC estimation error by the two estimation methods, it can be seen that comparing with EKF, the estimated value by the NN-based method can be maintained around the baseline in the low SOC range with relatively smaller errors. At the same time, it is also noticed that EKF is not always helpless in the low-range SOC estimation in the face of different driving cycles. The performance in the NYCC driving cycle is acceptable, and it can be considered that there is a particular adaptability problem for EKF. The NN-based method shows a relatively stable ability to estimate the low SOC range of the three operating conditions tested above and has a wide range of adaptability. It could be regarded as a potentially better solution to the low SOC range estimation. By further observation, in the inspection windows A and B in Figure 13B, the estimation results of EKF gain a local advantage over NN. Therefore, under the framework of the fusion algorithm, this situation can further improve the estimation accuracy. It is still based on the NN algorithm, EKF is used as a reference for the fluctuation boundary, and the fusion estimation result obtained by fusing the advantages of the two estimation methods is shown in Figure 13C. The SOC estimation method based on the fusion still achieves high accuracy locally. After zooming in the local area of the low-capacity interval in Figure 13C, it shows that the SOC estimation error based on fusion is ideal. The designed estimation method could obtain an RMSE error value of 0.0097 and an MAE error value of 0.0066, achieving an MAE of 1.34%, while the error distributions are shown in Figure 13D. The results shown above indicate that the proposed method is accurate, robust, and superior to the reference SOC estimation approaches under different operating conditions.
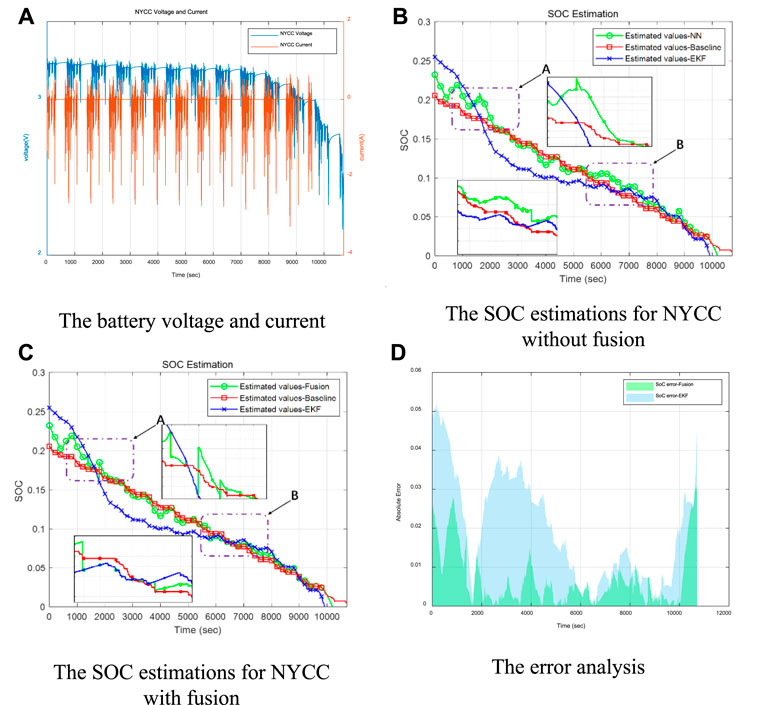
FIGURE 13. The evaluation results for low battery capacity area under NYCC driving cycle. (A) The battery voltage and current (B) The SOC estimations for NYCC without fusion. (C) The SOC estimations for NYCC with fusion (D) The error analysis.
Conclusion
This study investigates the online estimation of SOC for lithium-ion batteries at the low-capacity range. Based on the analysis of battery charge and discharge data under real vehicle cycle conditions, the battery model is established to identify and calibrate battery parameters and then focuses on the low-capacity SOC estimation analysis based on the EKF method. A fusion online estimation method is verified based on NN algorithms, which are the global mainstream trend, and the EKF, which is the local fluctuation boundary. The estimation results are evaluated by using the experiments under the UDDS, EUDC, and NYCC driving cycle, which results show that the proposed method can achieve a precise estimation result and the errors are as low as the RMSE of 0.0097 and the MAE of 0.0066. The method presented in this study could provide the precise information for expanding the driving range of electric vehicles and alleviate driver’s mileage anxiety.
Data Availability Statement
The original contributions presented in the study are included in the article/Supplementary material, further inquiries can be directed to the corresponding author.
Author Contributions
ZC made the contributions to the conception and design of the work. NZ and JC performed the algorithm, experiments, and result analysis. HL and ZF performed the algorithm programming. All authors read and contributed to the manuscript writing and revisions.
Funding
This work has been supported by Vehicle Measurement, Control and Safety Key Laboratory of Sichuan Province (QCCK2021-005), the National Natural Science Foundation of China (51977029), the Fundamental Research Funds for the Central Universities (N2003002), and Liaoning Provincial Science and Technology planned project (2021JH6/10500135).
Conflict of Interest
The authors declare that the research was conducted in the absence of any commercial or financial relationships that could be construed as a potential conflict of interest.
Publisher’s Note
All claims expressed in this article are solely those of the authors and do not necessarily represent those of their affiliated organizations, or those of the publisher, the editors and the reviewers. Any product that may be evaluated in this article, or claim that may be made by its manufacturer, is not guaranteed or endorsed by the publisher.
Abbreviations
BMS, Battery management system; ECM, Equivalent circuit model; EKF, Extended kalman filter; EUDC, Extra Urban Driving Cycle; EVs, Electric vehicles; LiFePO4, Lithium iron phosphate; LSOC, Low-range state of charge; MAE, Mean Absolute Error; MLP, Multi-layered perceptron; MSE, Mean Squared Error; NCM, Nickel Manganese Cobalt Oxide; NN, Neural Network; NYCC, New York City Cycle; PEVs, Pure electric vehicles; RC, Resistor–capacitor; RMSE, Root Mean Squared Error; SOC, State of Charge; UDDS, Urban Dynamometer Driving Schedule.
References
Ali, M. U., Zafar, A., Nengroo, S. H., Hussain, S., Alvi, M. J., and Kim, H.-J. (2019). Towards a Smarter Battery Management System for Electric Vehicle Applications: A Critical Review of Lithium-Ion Battery State of Charge Estimation. Energies 12 (3), 446. doi:10.3390/en12030446
Bai, G., Wang, P., Hu, C., and Pecht, M. (2014). A Generic Model-free Approach for Lithium-Ion Battery Health Management. Appl. Energ. 135, 247–260. doi:10.1016/j.apenergy.2014.08.059
Barai, A., Widanage, W. D., Marco, J., McGordon, A., and Jennings, P. (2015). A Study of the Open Circuit Voltage Characterization Technique and Hysteresis Assessment of Lithium-Ion Cells. J. Power Sourc. 295, 99–107. doi:10.1016/j.jpowsour.2015.06.140
Fu, Y., Xu, J., Shi, M., and Mei, X. (2021). A Fast Impedance Calculation Based Battery State-Of-Health Estimation Method. IEEE Trans. Ind. Electron., 1. doi:10.1109/tie.2021.3097668
Hannan, M. A., Lipu, M. S. H., Hussain, A., Ker, P. J., Mahlia, T. M. I., Mansor, M., et al. (2020). Toward Enhanced State of Charge Estimation of Lithium-Ion Batteries Using Optimized Machine Learning Techniques. Sci. Rep. 10 (1), 1–15. doi:10.1038/s41598-020-61464-7
Hannan, M. A., Hoque, M. M., Hussain, A., Yusof, Y., and Ker, P. J. (2018). State-of-the-art and Energy Management System of Lithium-Ion Batteries in Electric Vehicle Applications: Issues and Recommendations. Ieee Access 6, 19362–19378. doi:10.1109/access.2018.2817655
He, W., Williard, N., Chen, C., and Pecht, M. (2014). State of Charge Estimation for Li-Ion Batteries Using Neural Network Modeling and Unscented Kalman Filter-Based Error Cancellation. Int. J. Electr. Power Energ. Syst. 62, 783–791. doi:10.1016/j.ijepes.2014.04.059
Kang, L., Zhao, X., and Ma, J. (2014). A New Neural Network Model for the State-Of-Charge Estimation in the Battery Degradation Process. Appl. Energ. 121, 20–27. doi:10.1016/j.apenergy.2014.01.066
Lee, K. T., Dai, M. J., and Chuang, C. C. (2017). Temperature-compensated Model for Lithium-Ion Polymer Batteries with Extended Kalman Filter State-Of-Charge Estimation for an Implantable Charger. IEEE Trans. Ind. Electron. 65 (1), 589–596.
Lee, S., Kim, J., Lee, J., and Cho, B. H. (2008). State-of-charge and Capacity Estimation of Lithium-Ion Battery Using a New Open-Circuit Voltage versus State-Of-Charge. J. Power Sourc. 185 (2), 1367–1373. doi:10.1016/j.jpowsour.2008.08.103
Lipu, M. S. H., Hannan, M. A., Hussain, A., Saad, M. H. M., Ayob, A., and Blaabjerg, F. (2018). State of Charge Estimation for Lithium-Ion Battery Using Recurrent NARX Neural Network Model Based Lighting Search Algorithm. IEEE access 6, 28150–28161. doi:10.1109/access.2018.2837156
Lu, J., Chen, Z., Yang, Y., and L.V., M. (2018). Online Estimation of State of Power for Lithium-Ion Batteries in Electric Vehicles Using Genetic Algorithm. Ieee Access 6, 20868–20880. doi:10.1109/access.2018.2824559
Meng, J., Luo, G., Ricco, M., Swierczynski, M., Stroe, D.-I., and Teodorescu, R. (2018). Overview of Lithium-Ion Battery Modeling Methods for State-Of-Charge Estimation in Electrical Vehicles. Appl. Sci. 8 (5), 659. doi:10.3390/app8050659
Ouyang, M., Liu, G., Lu, L., Li, J., and Han, X. (2014). Enhancing the Estimation Accuracy in Low State-Of-Charge Area: A Novel Onboard Battery Model through Surface State of Charge Determination. J. Power Sourc. 270, 221–237. doi:10.1016/j.jpowsour.2014.07.090
Qiu, X., Wu, W., and Wang, S. (2020). Remaining Useful Life Prediction of Lithium-Ion Battery Based on Improved Cuckoo Search Particle Filter and a Novel State of Charge Estimation Method. J. Power Sourc. 450, 227700. doi:10.1016/j.jpowsour.2020.227700
Ranjbar, A. H., Banaei, A., Khoobroo, A., and Fahimi, B. (2011). Online Estimation of State of Charge in Li-Ion Batteries Using Impulse Response Concept. IEEE Trans. Smart Grid 3 (1), 360–367. doi:10.1109/TSG.2011.2169818
Shrivastava, P., Soon, T. K., Idris, M. Y. I. B., and Mekhilef, S. (2019). Overview of Model-Based Online State-Of-Charge Estimation Using Kalman Filter Family for Lithium-Ion Batteries. Renew. Sustain. Energ. Rev. 113, 109233. doi:10.1016/j.rser.2019.06.040
Tian, Y., Li, D., Tian, J., and Xia, B. (2017). State of Charge Estimation of Lithium-Ion Batteries Using an Optimal Adaptive Gain Nonlinear Observer. Electrochimica Acta 225, 225–234. doi:10.1016/j.electacta.2016.12.119
Wang, L., Lu, D., Liu, Q., Liu, L., and Zhao, X. (2019). State of Charge Estimation for LiFePO4 Battery via Dual Extended Kalman Filter and Charging Voltage Curve. Electrochimica Acta 296, 1009–1017. doi:10.1016/j.electacta.2018.11.156
Xing, Y., He, W., Pecht, M., and Tsui, K. L. (2014). State of Charge Estimation of Lithium-Ion Batteries Using the Open-Circuit Voltage at Various Ambient Temperatures. Appl. Energ. 113, 106–115. doi:10.1016/j.apenergy.2013.07.008
Xiong, R., Cao, J., Yu, Q., He, H., and Sun, F. (2017). Critical Review on the Battery State of Charge Estimation Methods for Electric Vehicles. Ieee Access 6, 1832–1843. doi:10.1109/ACCESS.2017.2780258
Xiong, R., Sun, F., Chen, Z., and He, H. (2014). A Data-Driven Multi-Scale Extended Kalman Filtering Based Parameter and State Estimation Approach of Lithium-Ion Polymer Battery in Electric Vehicles. Appl. Energ. 113, 463–476. doi:10.1016/j.apenergy.2013.07.061
Xu, J., Mei, X., Wang, X., Fu, Y., Zhao, Y., and Wang, J. (2021). A Relative State of Health Estimation Method Based on Wavelet Analysis for Lithium-Ion Battery Cells. IEEE Trans. Ind. Electron. 68 (8), 6973–6981. doi:10.1109/tie.2020.3001836
Yang, F., Li, W., Li, C., and Miao, Q. (2019). State-of-charge Estimation of Lithium-Ion Batteries Based on Gated Recurrent Neural Network. Energy 175, 66–75. doi:10.1016/j.energy.2019.03.059
Yang, S., Deng, C., Zhang, Y., and He, Y. (2017). State of Charge Estimation for Lithium-Ion Battery with a Temperature-Compensated Model. Energies 10 (10), 1560. doi:10.3390/en10101560
Yang, S., Zhou, S., Hua, Y., Zhou, X., Liu, X., Pan, Y., et al. (2021). A Parameter Adaptive Method for State of Charge Estimation of Lithium-Ion Batteries with an Improved Extended Kalman Filter. Scientific Rep. 11 (1), 1–15. doi:10.1038/s41598-021-84729-1
Zhang, J., and Xia, C. (2011). State-of-charge Estimation of Valve Regulated lead Acid Battery Based on Multi-State Unscented Kalman Filter. Int. J. Electr. Power Energ. Syst. 33 (3), 472–476. doi:10.1016/j.ijepes.2010.10.010
Zhang, R., Xia, B., Li, B., Cao, L., Lai, Y., Zheng, W., et al. (2018). State of the Art of Lithium-Ion Battery SOC Estimation for Electrical Vehicles. Energies 11 (7), 1820. doi:10.3390/en11071820
Zheng, Y., Ouyang, M., Han, X., Lu, L., and Li, J. (2018). Investigating the Error Sources of the Online State of Charge Estimation Methods for Lithium-Ion Batteries in Electric Vehicles. J. Power Sourc. 377, 161–188. doi:10.1016/j.jpowsour.2017.11.094
Keywords: electric vehicle, lithium-ion battery, state of charge estimation, extended kalman filter, neural network
Citation: Zhou N, Liang H, Cui J, Chen Z and Fang Z (2021) A Fusion-Based Method of State-of-Charge Online Estimation for Lithium-Ion Batteries Under Low Capacity Conditions. Front. Energy Res. 9:790295. doi: 10.3389/fenrg.2021.790295
Received: 06 October 2021; Accepted: 05 November 2021;
Published: 07 December 2021.
Edited by:
Xiaopeng Tang, Hong Kong University of Science and Technology, Hong Kong SAR, ChinaReviewed by:
Quan Ouyang, Nanjing University of Aeronautics and Astronautics, ChinaChang Liu, China Electronics Technology Group Corporation, China
Zhongbao Wei, Beijing Institute of Technology, China
Jun Xu, Xi’an Jiaotong University, China
Copyright © 2021 Zhou, Liang, Cui, Chen and Fang. This is an open-access article distributed under the terms of the Creative Commons Attribution License (CC BY). The use, distribution or reproduction in other forums is permitted, provided the original author(s) and the copyright owner(s) are credited and that the original publication in this journal is cited, in accordance with accepted academic practice. No use, distribution or reproduction is permitted which does not comply with these terms.
*Correspondence: Zeyu Chen, Y2hlbnp5QG1haWwubmV1LmVkdS5jbg==
 Nan Zhou
 Hong Liang1
 Zeyu Chen