 Lijuan Li
 Yiwei Zeng
 Jie Chen1
95% of researchers rate our articles as excellent or good
Learn more about the work of our research integrity team to safeguard the quality of each article we publish.
Find out more
METHODS article
Front. Energy Res. , 24 November 2021
Sec. Process and Energy Systems Engineering
Volume 9 - 2021 | https://doi.org/10.3389/fenrg.2021.786439
This article is part of the Research Topic Advanced Technologies for Planning and Operation of Prosumer Energy Systems View all 111 articles
With the increase of complexity of the power system structure and operation mode, the risk of large-scale power outage accidents rises, which urgently need an accuracy algorithm for identifying vulnerabilities and mitigating risks. Aiming at this, the improved DebtRank (DR) algorithm is modified to adapt to the property of the power systems. The overloading state of the transmission lines plays a notable role of stable operation of the power systems. An electrical DR algorithm is proposed to incorporate the overloading state to the identification of vulnerable lines in the power systems in this article. First, a dual model of power system topology is established, the nodes of which represent the lines in the power systems. Then, besides the normal state and failure state having been considered, the definition of the overloading state is also added, and the line load and network topology are considered in the electrical DR algorithm to identify vulnerable lines. Finally, the correctness and reasonability of the vulnerable lines of the power systems identified by the electrical DR algorithm are proved by the comparative analysis of cascade failure simulation, showing its better advantages in vulnerability assessment of power systems.
The security and stability of the power systems have become increasingly challenging as the scale and structural complexity of power systems have been augmented, which results in large-scale power outages and an increased risk with significant social and economic losses (Wang et al., 2017; Li et al., 2020; Zhang et al., 2021). Power outages are typically affected by cascade failures triggered by the failures of critical nodes or critical lines of the power systems (Chopade and Bikdash, 2016). Line interruptions can impact other components and trigger cascading failures (Hui Ren and Dobson, 2008), and they are more sensitive to being induced than node (substation) interruptions (Hines et al., 2016). As a result, identifying critical lines is critical for preventing and controlling major outages.
Critical lines, also known as “vulnerable lines” (Meng, 2018), are lines which change under operating conditions and have a significant impact on the system, are more likely to trigger cascade failure, and increase system vulnerability. Until now, there are mainly two categories of methods for identifying vulnerable lines in power systems. The first method is based on identifying vulnerable lines and system operating states. The identification of the system operation state is realized with the power flow calculation, and the identification of vulnerable lines in the system operation state is realized by simulating the development trend of the system state to assess the vulnerability systems (Abedi et al., 2019; Cai et al., 2021; Li and Qi, 2021). The second method is based on network topology (Armaghani et al., 2020), in which assessment indices derived from the complex network theory are applied, such as degree (Kitsak et al., 2010) and betweenness (Bai and Miao, 2015), either combined with electrical characteristic improvement index or updated indicator weight (Zhu et al., 2021). Evaluating the impact of removing a line or changing the operational state of a line on the network to measure the vulnerability of the line is proposed in the study by Okojie et al. (2015).
Feature vector ranking methods originating from other fields, such as computer, biology, and finance, have been applied to power systems in recent years as the complexity of the power systems has been increasing. The feature vector approach shows the advantage of identifying critical lines in power systems by considering not only the number of node (line) neighbors but also the impact of neighborhood quality on node (line) importance (Ren and L, 2014). The feature vector ranking methods combine electrical characteristics, such as power system flow and transmission capacity of power system lines to identify vulnerable lines in power systems (Hu, 2018). The PageRank algorithm evaluating the impact of web pages in the internet can be modified to identify vulnerable lines or nodes which adapt to the power system’s performance (Ma et al., 2016; Ma et al., 2017). The modified weighted PageRank algorithm was applied to measure the importance of nodes in a multi-energy power system (Shen et al., 2019). Furthermore, the PageRank algorithm is modified for finding vulnerable lines in large-scale power systems by extending the interaction graph to a directed weighted graph (Ma et al., 2017). To improve the identification efficiency, a PSNodeRank algorithm has been proposed, which abstracts the power systems into a complicated directed weighted network (Sun et al., 2020).
As a novel feature vector ranking method, the DebtRank (DR) algorithm is proposed in financial networks reflecting debt relationships, which can be used to assess the impact of debt default or bankruptcy of a financial node on other financial nodes of the financial network. The DR algorithm can effectively avoid the error caused by circular calculations among financial nodes by adding the definition of the node state (Battiston et al., 2012).
Existing methods for identifying vulnerable lines in power systems involve the consequences of both the normal state and failure state of a cascade failure model as well as the impact on the parameters of the line (Kitsak et al., 2010; Bai and Miao, 2015; Okojie et al., 2015; Zhu et al., 2021). However, in power systems, there is a transition process from the normal state to failure state of the transmission lines. The DR algorithm can consider the intermediate state between the normal state and failure state in the vulnerability assessment process, which enables more appropriate amount and control of approaching errors as well as failure recovery.
The remainder of this article is organized as follows: the DR algorithm is introduced in the DR Algorithm section. The electrical DR algorithm is proposed in the Electrical DebtRank Algorithm for Power Systems section for assessing the vulnerability of power systems. The Vulnerable Lines Identification Process Based on the Electrical DR Algorithm section describes the steps and flow of the electrical DR algorithm for power systems. In the Case Studies section, the case studies of the electrical DR algorithm in power systems are analyzed with the IEEE-39 and IEEE-118 bus power systems. Also, the load loss of power systems caused by the vulnerable line fluctuations identified by the electrical DR algorithm is further compared and analyzed. The full article is concluded in the Conclusion section.
The DR algorithm was proposed by Stefano Battiston et al. in 2012 to consider the impact of the initial failure node of the financial network on the system (Battiston et al., 2012), and it is currently widely used in the financial field to effectively assess the debt risk of financial institutions. In the DR algorithm, the financial network is described as a directed network, in which the nodes represent individual financial institutions and the edges represent debt transactions between financial institutions (Thurner and Poledna, 2013). The algorithm that can avoid the impact of initial nodes is overestimated, and some cascade failures are underestimated due to repeated calculations in the system.
The DR algorithm to assess the node impact is shown in (1):
where vi and vj are the economic values of institutions i and j, respectively. Ri is the vulnerability assessment index of institution i, which assesses the systematic impact of node i. A larger value of Ri indicates that the larger the impact caused by node i, the more important the node is.
In (1), Ri assesses the impact of node i on the rest of the system by introducing the second term so that the impact of a node is calculated in the algorithm without the effect caused by a change in the initial state of node i, where t is the period, hj (t) is the continuous variable associated with state variable si of node j at period t, hj (t)∈[0,1], and hi (1) is the value of the continuous variable at the initial state of node i. The DR algorithm used to avoid the impact caused by the accident is being double-counted by introducing the continuous variable hi and the state variable si. The dynamic properties of hi and si are expressed in (2) and (3), respectively,
Wij in (2) is the impact of the undistressed state or inactive state of node i on node j. hj (t−1) is the continuous variable of node j at moment t−1, node j is the node whose sj is in the undistressed state at moment t−1, and the value of hi(t) is equal to the sum of hi(t−1) plus the product of all nodes whose state is inactive at moment t−1 and the impact of node i on it. hi (t) has a maximum value of 1 in dynamic change.
In (3), si is a discrete variable with three states, si = {U, D, I}. U denotes the undistressed (normal) state, that is, the state that node j works is the normal state. D denotes the distressed state, that is, the state that the institution represented by node i can continue to operate but the operating state exceeds a safe or set threshold. I denotes the inactive (failure) state, that is, the state that the institution represented by node i is in the failure state that is not operational at all. The definition of the state variable si can be introduced for adding a definition of a state that involves the overloading state between the normal state and failure state in operation of power systems.
For the state variable si (t), when the continuous variable hi of node i is larger than 0 at time t and si (t−1) is not in the inactive state, the state variable of si (t) is converted to distressed state D. When the state variable si (t−1) of node i is in distressed state D, the state variable of si(t) is converted to inactive state I. In other cases, the state variable of si (t) inherits si, the value of the state variable at moment t−1. The value of the state variable si changes with the value of hi. After a finite period t, the dynamics stops and all nodes in the network are in state U or state I. When a node steps into the distressed state at moment t−1, this node turns to the inactive state at period t.
The DR algorithm can effectively assess the vulnerability of the financial network. Because of the differences between the electrical characteristics of power systems and financial networks, the DR algorithm cannot be applied directly in power systems. Therefore, it is necessary to modify the DR algorithm to adapt to the power systems. The modified algorithm applied to power system line vulnerability assessment is known as the electrical DR algorithm. The improvement ideas are as follows:
1) For critical nodes in the financial network, the DR algorithm is used to transmit fluctuations through debt transactions between financial institutions, whereas in the power systems, fluctuations produced by changes in the state of nodes are transmitted through topologies and connection of power systems (Bardoscia et al., 2016).
2) The DR algorithm has three states: undistressed state U, distressed state D, and inactive state I. The load rate of the line is used as the operation state assessment index in the line operation state of power systems; when the line is in the overloading state, the line is in operation but in the poor operation state because of the increased line load rate. The overloading state of the power systems can be defined by introduced distressed state D in the DR algorithm.
3) The DR algorithm is utilized to identify the important nodes of the financial networks. In the power systems, disruption of line failure is higher than that of nodes. We want to rank the lines in the power systems in order of impact so that the topology power system is modeled to the dual graph, dual the lines into nodes.
The line load factor is related to the failure rate of a power system line. The increase of the load factor of the lines leads to an increase in line heating, which increases the failure probability as well as the probability of line outage (Cheng et al., 2006). Figure 1 depicts the relationship between line failure probability and load factor.
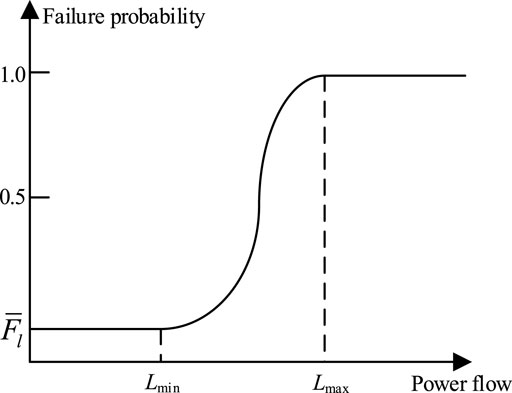
FIGURE 1. Line failure probability curve with power flow.
In Figure 1, Lmin is the lower threshold of the line power flow crossing limit, that is, the maximum power transmitted by the line to maintain normal state operation. Lmax is the higher threshold of the line power flow crossing limit, that is, the maximum power allowed to be transmitted of the line. The chance of a line outage is presented by
The states between the DR algorithm, electrical DR algorithm, and present method in power systems are shown in Table 1. The three states, namely, undistressed state U, distressed state D, and inactive state I defined in the DR algorithm are defined as normal state N, overloading state O, and failure state F in the electrical DR algorithm, respectively. Compared with the present vulnerable line identification methods in power systems, the electrical DR algorithm adds the definition of the overloading state.
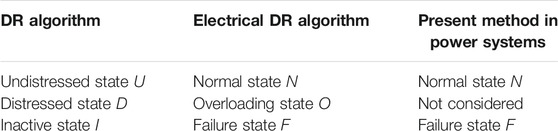
TABLE 1. States between the DR algorithm and electrical DR algorithm and the present method in power systems.
The dual modeling of the power systems is conducted in order to identify the vulnerable lines in the power systems. In the dual model of power systems, each line is represented by a node in the dual topology model. The relationship between transmission lines in the actual power systems is the edge of the dual topology model. To accurately depict the electrical performance of power systems, the direction of the power flow of the line is defined as the direction of the edge in the dual graph.
Both financial network and power systems are topological graphs when modeling based on the complex network theory. From the complex network theory, the comparative relationship between the dual topology model of power systems and the financial network is shown in Table 2. The financial institution nodes correspond to the power system lines, and the debt relationship between the financial institutions corresponds to the power flow relationship between the lines.

TABLE 2. Consistent correspondence between the dual topology of the power system, the power system topology, and the financial network.
The assessment index of vulnerable lines in power systems is developed by applying the principle of ranking the impact of important institutions in the financial network based on the similarities between the power systems and the financial network. Nodes i and j in financial institutions in (1) map lines l and k in power systems, corresponding to nodes l and k in the power system dual topology graph. The comparison of the financial network and power system topology is shown in Table 2. Rl is the impact indicator of line l in power systems, which measures the impact on the power systems due to the fluctuation of line l. A large value of Rl means that the impact caused by line l is greater and the line is more important.
The DR algorithm needs to be modified to adapt to the characteristics of the power systems.
Considering the load capacity of the line, the larger the power flow transmitted by the line, the greater the impact caused. In the power system, there is a connection between line l and line k, defining the impact of line l on line k as Ylk.
where Pl and Pk are the power flow of lines l and k after the line l fluctuations, respectively, and
According to the DR algorithm, two variables hi and si are introduced to prevent the impact from being double-counted, avoiding the overestimation of the effect produced by the original disturbance and an underestimation of the damage generated by cascade failure. In the electrical DR algorithm, hl (t) is defined as the continuous variable of line l at moment t, associated with the line k state variable sk. hl (t) represents the dynamic changes of the power systems represented in the tth period and is related to the value of line l at period t and the previous state of the line and whether other lines are in the overloading state. The power flow of line increase will lead to an increase in the probability of line heating meltdown (Huang et al., 2020). When the cascade failure occurs, the redistribution of power flow will impact the neighboring line state.
The more the line which is connected with line l enters to an overloading state at period t−1, the larger the value of hl (t) in the dynamic change is. The maximum value of hl (t) in the dynamic change is 1. The state variable sl is determined by the continuous variable hl, and sl (t) can be shown in (6):
The state variable sl is determined by the continuous variable hl. The state variable sl represents the three states of line l, where N is the normal state, indicating that line l can operate properly. O represents an overloading state, in which line l can continue to operate but the state surpasses a specified thermal stability area, increasing the likelihood of failure. F represents a failure state, in which line l is unable to operate.
Equation (6) expresses the conversion connection between the three states. When the hl (t) of line l is larger than the average line outage probability
According to equations 4–6, the electrical DR algorithm can be expressed as
where pk and pl represent the power flow of line k and line l, respectively.
To evaluate the vulnerability of power system lines, the process of the modified method is shown as follows:
1) Establishing power system dual topology model. The dual topology model of power systems is established by taking the lines in the actual power systems corresponding to the nodes in the dual topology model. The relationship between lines formed through the nodes as the edges of the dual model.
2) Selecting the initial disturbance line. In the power system dual model, select the line in order and set to an overloading state as the initial disturbance node. Then, the power flow after node fluctuation can be calculated.
3) Assigning variables hl and sl. Initial values to variables hl and sl for each node of the dual topology model are assigned. In order to ensure the independence and accuracy of each calculation, this article assigns hl and sl to each node in the dual model.
4) Calculating the impact matrix Y. Based on the node connection matrix of the dual model, the influence Ylk between each node is calculated and the influence matrix Y is derived.
5) The Rl value of each node of the dual topology model is calculated from the equations 4–9.
6) Sorting of node Rl values. The values of Rl are sorted according to the calculated values; the larger the value, the greater the impact on the performance of the power systems and the more important it is.
This article identifies IEEE-39 and IEEE-118 bus power systems’ vulnerable lines by the electrical DR algorithm. The results are performed to verify the effectiveness of this algorithm.
The overloading state takes the line load factor larger or equal to 0.8 and less than 1. The average statistical value of the line outage probability
The network topology graph of the IEEE-39 bus power system with 46 lines is as shown in Figure 2. The dual topology model of the IEEE-39 bus power system is established, in which the lines of the actual power systems are transformed into nodes.
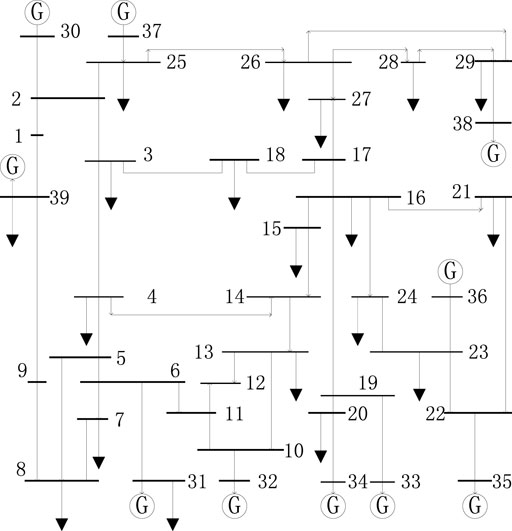
FIGURE 2. IEEE-39 bus power system network topology.
Based on equations (4–9), the Rl values of the 46 lines in the IEEE-39 bus power system (46 nodes in the dual topology graph) are shown in Figure 3. The larger the Rl value, the more influential and important the line is. According to the magnitude of their Rl values, the top 10 vulnerable lines are ranked in Table 3. To verify the effectiveness of the algorithm proposed in this article for identifying vulnerable lines, the identification results of vulnerable lines by the electrical DR algorithm are compared with the top 10 lines identified by the modified PageRank algorithm (Ren and L, 2014), the modified LeaderRank algorithm (Wei et al., 2021), and the electrical betweenness (Wang et al., 2014) method for vulnerable line ranking.
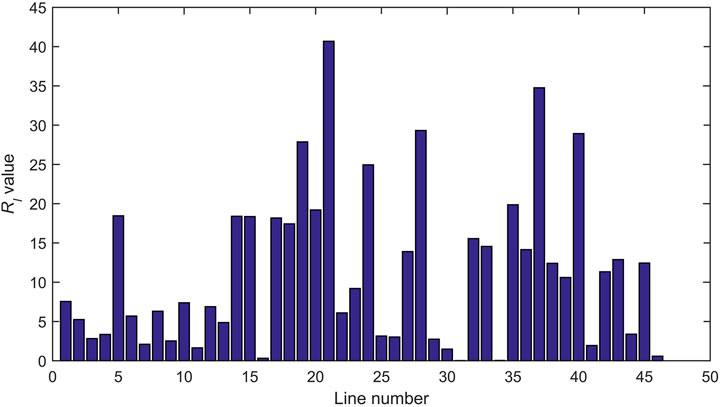
FIGURE 3. Rl value of the IEEE-39 bus power system.
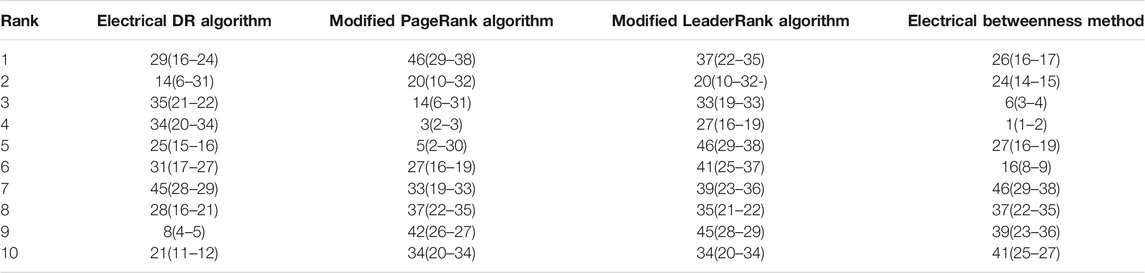
TABLE 3. Result comparison of four identification algorithms for the IEEE-39 bus power system.
According to Table 3, the top 10 lines of the rank of two lines (the second and third ranking of the line) are generator 31 and 35 out of the line, respectively. The failure of the lines will severely affect the system power output shortage, resulting in a major power outage accident. There are three lines for the power system to connect the important load nodes, bearing a heavy power transmission task. These line breaks will reduce the connectivity of the power system, threatening the safe and stable operation of the system and destroying the power balance of the power systems. For example, line 29 in the first order is the connection line between load nodes 16 and 24. Disconnection of load node 16, which connects five nodes in the power systems and is one of the most significant nodes in the system, will split the system into two pieces, creating power flow fluctuations and large system topology changes.
The top 10 vulnerable lines identified by the four algorithms in Table 3 are removed according to the ranking of each algorithm. Cascade failure simulations are performed 500 times, resulting in the changes in the percentage of load loss and the cumulative probability of load loss. The comparison of different algorithms is shown in Figure 4.
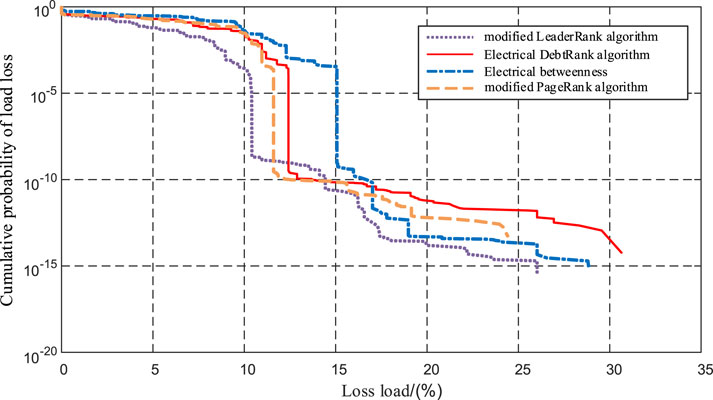
FIGURE 4. IEEE-39 bus power system line fluctuation load loss result comparison; electrical DR algorithm applied to the IEEE-118 bus power system.
Figure 4 shows that removing the 10 vulnerable lines identified by using the electrical DR algorithm results in a maximum load loss of 31%, which is significantly higher than the maximum load loss of 24% for the modified PageRank algorithm and 26% for the modified LeaderRank algorithm. The maximum load loss of the electrical DR algorithm is also higher than the maximum load loss of 29% for the electrical betweenness method. When the system load loss percentage is 0.13%, the cumulative likelihood of load loss for the top 10 line variations indicated by the electrical DR algorithm is slightly higher than that of the modified LeaderRank algorithm and the modified PageRank algorithm. When the load loss is larger than 17%, the cumulative probability of load loss is significantly higher than that of the modified PageRank algorithm, the modified LeaderRank algorithm, and the electrical betweenness method. The electrical DR algorithm shows a significant advantage. It can be seen that the probability of cascade failure that may result from vulnerable lines identified using the electrical DR algorithm is greater.
Based on equations (4–9), the Rl values of the 179 lines in the IEEE-118 bus power system are shown in Figure 5, where the larger the Rl value, the more influential it is in the system and the more important the line is.

FIGURE 5. Rl value of the IEEE-118 bus power system.
According to the simulation results of the IEEE-39 bus power system as well as the variation of load loss percentage and load loss accumulation probability and the comparison graph in the Electrical DR Algorithm Applied to IEEE-39 Bus Power System section, the electrical betweenness method is slightly superior and is more popular among the four algorithms involved in the comparison. As a result, the electrical betweenness method is compared to the electrical DR algorithm in the validation comparison simulation of the IEEE-118 bus power system.
To verify the effectiveness of the identified vulnerable line algorithm proposed in this article, the vulnerable line identification results obtained in this article are compared with those of the top 10 lines in the vulnerable line ranking identified by electrical betweenness (Wang et al., 2014), as shown in Table 4. The lines are ranked according to the magnitude of their Rl values. The transmission lines ranked among the top 10 in the simulation results are shown in Table 4. As shown in Table 4, we can see that the vulnerable lines obtained from the modified electrical DR algorithm have five lines for generator outgoing lines and other five lines connecting important load nodes in the power systems which bear a heavy power transmission task. These lines will bring huge load loss after disconnecting, such as the first ranking of line 33 is the outgoing line between generator 25 and generator 27. Once the disconnection of line 33 severely restricts the power outgoing from generator 27, the disconnection will lead to a wide range of power flow transfers, causing cascade failure.
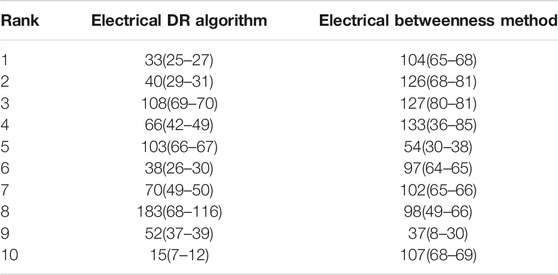
TABLE 4. Rl values of the IEEE-118 network are compared with those of the electrical betweenness method.
The top 10 vulnerable lines identified by the two algorithms in Table 4 are removed and simulated for cascade failure 500 times. Figure 6 shows the change in the percentage of load loss and the cumulative probability of load loss due to the removal of the top 10 vulnerable lines by the two algorithms and the comparison.
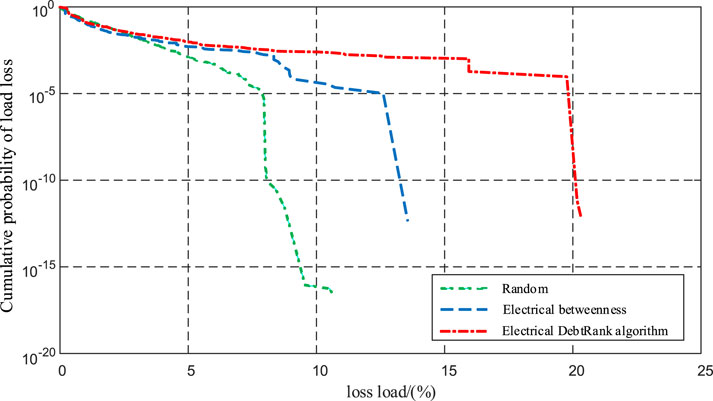
FIGURE 6. IEEE-118 bus power system line fluctuation load loss comparison.
As can be seen in Figure 6, the removal of the 10 vulnerable lines identified using the electrical DR algorithm caused the maximum load loss percentage of 20.5%, which is significantly larger than the maximum load loss of 14% for the electrical betweenness method. The top 10 lines identified by the electrical DR algorithm fluctuate in the system load loss percentage at 0.8%, and the cumulative probability of load loss is slightly higher than that of the electrical betweenness method. The cumulative probabilities after a load loss greater than 8% are consistently higher than those of the electrical betweenness method, and the electrical DR algorithm shows clear advantages. Moreover, removal of the 10 vulnerable lines identified using the electrical DR algorithm resulted in a maximum load loss percentage of 21%, which was significantly better than the maximum load loss percentage of 14% for the electrical betweenness method, showing that the vulnerable lines identified using the electrical DR algorithm are more vulnerable and the potential of line break will cause a greater probability of cascade failure.
The top 10 lines identified by the two algorithms in Table 4 are removed in order of vulnerable line value Rl and electrical dielectric number. Figure 7 shows the variation of load loss due to stepwise removal of the top 10 vulnerable lines sorted by both methods. In Figure 7, the load loss of the electrical DR algorithm is close to that of the electrical betweenness method when the first five vulnerable lines are removed, indicating that the impact on the power systems is almost the same when the first five vulnerable lines are removed. However, when the removal of vulnerable lines continues, the load loss caused by the electrical DR algorithm is significantly higher than that of the electrical betweenness method. It shows that the impact of vulnerable lines identified by the electrical DR algorithm is larger than that of the electrical betweenness method, especially in preventing large-scale power outages.
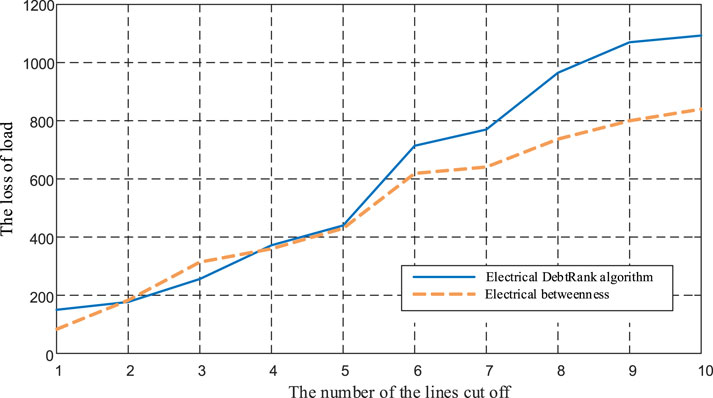
FIGURE 7. IEEE-118 power system removes the first 10 vulnerable lines; load loss comparison diagram.
In large-scale power systems, cascade failure caused by transmission line accidents leads to an occurrence of large outage, which can cause serious economic and social losses. Based on the dual model, this article proposes the electrical DR algorithm for identification of vulnerable lines in power systems. The overloading state is considered to fill the gap between the normal state and failure state, which is more in accordance with the transmission line change of the operation state. From the results of cascade failure simulation, the method performs better in the identification of vulnerable lines, in which the load loss of the vulnerable lines identified by the electrical DR algorithm is relatively higher, and cumulative probability of load loss is higher under the conditions with the same load loss percentage. The electrical DR algorithm can be used not only for identification of vulnerable lines but also for identification of vulnerable nodes. The algorithm proposed in this article enriches and develops the vulnerability assessment for power systems, which shows extensive potential applications for effectively preventing cascade failure caused by weak lines.
The raw data supporting the conclusion of this article will be made available by the authors, without undue reservation.
LL contributed to the conception of the study and significantly to analysis and manuscript preparation; YZ performed the experiment, analyzed the data, and wrote the manuscript; JC perfected the manuscript writing; YL helped perform the analysis with constructive discussions; HL performed writing—review and editing; and GD performed investigation.
The National Natural Science Foundation of China (NSFC) (52077189) and the Natural Science Foundation of Hunan Province of China (NSFHP) (2020JJ4577) provided financial support. The project of Hunan National Center for Applied Mathematics (2020ZYT003).
The authors declare that the research was conducted in the absence of any commercial or financial relationships that could be construed as a potential conflict of interest.
All claims expressed in this article are solely those of the authors and do not necessarily represent those of their affiliated organizations or those of the publisher, the editors, and the reviewers. Any product that may be evaluated in this article or claim that may be made by its manufacturer is not guaranteed or endorsed by the publisher.
Abedi, A., Gaudard, L., and Romerio, F. (2019). Review of Major Approaches to Analyze Vulnerability in Power System. Reliability Eng. Syst. Saf. 183, 153–172. doi:10.1016/j.ress.2018.11.019
Armaghani, S., Hesami Naghshbandy, A., and Shahrtash, S. M. (2020). A Novel Multi-Stage Adaptive Transmission Network Expansion Planning to Countermeasure Cascading Failure Occurrence. Int. J. Electr. Power Energ. Syst. 115, 105415. doi:10.1016/j.ijepes.2019.105415
Bai, H., and Miao, S. (2015). Hybrid Flow Betweenness Approach for Identification of Vulnerable Line in Power System. IET Generation, Transm. Distribution 9 (12), 1324–1331. doi:10.1049/iet-gtd.2014.1016
Bardoscia, M., Caccioli, F., Perotti, J. I., Vivaldo, G., and Caldarelli, G. (2016). Distress Propagation in Complex Networks: the Case of Non-linear DebtRank. PloS one 11 (10), e0163825. doi:10.1371/journal.pone.0163825
Battiston, S., Puliga, M., Kaushik, R., Tasca, P., and Caldarelli, G. (2012). Debtrank: Too central to Fail? Financial Networks, the Fed and Systemic Risk. Sci. Rep. 2 (1), 541–546. doi:10.1038/srep00541
Cai, Y., Liu, Y., Tang, X., Tan, Y., and Cao, Y. (2021). Increasing Renewable Energy Consumption Coordination with the Monthly Interprovincial Transaction Market. Front. Energ. Res. 9. doi:10.3389/fenrg.2021.719419
Cheng, L., He, J., and Sun, Y. (2006). Impact of Transmission Line’s Real-Time Reliability Model Parameter upon Power System Operational Reliability Evaluation. Power Syst. Techn. (13), 8–13. doi:10.13335/j.1000-3673.pst.2006.13.002
Chopade, P., and Bikdash, M. (2016). New Centrality Measures for Assessing Smart Grid Vulnerabilities and Predicting Brownouts and Blackouts. Int. J. Crit. Infrastructure Prot. 12, 29–45. doi:10.1016/j.ijcip.2015.12.001
Hines, P. D., Dobson, I., and Rezaei, P. (2016). Cascading Power Outages Propagate Locally in an Influence Graph that Is Not the Actual Grid Topology. IEEE Trans. Power Syst. 32 (2), 958–967. doi:10.1109/tpwrs.2016.2578259
Hu, J. P. (2018). Automatic Identification and Simulation of Transmission Line Fault in Large Scale Power System Survey on Learning-To-Rank Based Recommendation Algorithms. Computer Simulation 35 (02), 59–62.
Huang, L., Wang, Y., Guo, J., Xu, G., and Di, F. (2020). Economic Dispatch for Disaster Prevention Considering Load Rate Homogeneity of Power Grid and N-1 Security Constraints. Automation Electric Power Syst. 344 (13), 56–63. doi:10.7500/AEPS20190923003
Hui Ren, H., and Dobson, I. (2008). Using Transmission Line Outage Data to Estimate Cascading Failure Propagation in an Electric Power System. IEEE Trans. Circuits Syst.55 (9), 927–931. doi:10.1109/tcsii.2008.924365
Kitsak, M., Gallos, L. K., Havlin, S., Liljeros, F., Muchnik, L., Stanley, H. E., et al. (2010). Identification of Influential Spreaders in Complex Networks. Nat. Phys 6 (11), 888–893. doi:10.1038/nphys1746
Li, L., Li, Y., Zhou, B., Wu, Q., Shen, X., Liu, H., et al. (2020). An Adaptive Time-Resolution Method for Ultra-short-term Wind Power Prediction. Int. J. Electr. Power Energ. Syst. 118, 105814. doi:10.1016/j.ijepes.2019.105814
Li, X., and Qi, Z. (2021). Impact of Cascading Failure Based on Line Vulnerability index on Power Grids. Energy Syst. doi:10.1007/s12667-021-00435-x
Ma, Z., Liu, F., Shen, C., Zhang, J., and Gao, F. (2016). Rapid Identification of Vulnerable Lines in Power Grid Using Modified PageRank Algorithm——Part I: Theoretical Foundation. Proc. CSEE 36 (23), 6363–6370+6601. doi:10.13334/j.0258-8013.pcsee.161352
Ma, Z., Liu, F., Shen, C., Zhang, J., and Gao, F. (2017). Rapid Identification of Vulnerable Lines in Power Grid Using Modified PageRank Algorithm——Part II: Factors Affecting Identification Results. Proceedings of the CSEE. Proc. CSEE 37 (1), 36–45. doi:10.13334/j.0258-8013.pcsee.161353
Ma, Z., Shen, C., Liu, F., and Mei, S. (2017). Fast screening of vulnerable transmission lines in power grids: A pagerank-based approach. IEEE Trans. Smart Grid 10 (2), 1982–1991. doi:10.1109/tsg.2017.2785267
Meng, X. (2018). “Vulnerable Link Identification and Control Study of Power Grid Based on Transient Potential Energy,” [dissertation/doctoral thesis]. Beijing: Beijing jiaotong university.
Okojie, D. E., Jimoh, A. A., Hamam, Y., and Yusuff, A. A. (2015). “Identification of vulnerable transmission lines in power system switching operations,” in 2015 4th International Conference on Electric Power and Energy Conversion Systems (EPECS). doi:10.1109/EPECS.2015.7368506
Ren, X., and L, L. (2014). Review of ranking nodes in complex networks. Sci. china press 59, 1175–1197. doi:10.1360/972013-1280
Shen, Y., Gu, C., and Zhao, P. (2019). Structural vulnerability assessment of multi-energy system using a PageRank algorithm. Energ. Proced. 158, 6466–6471. doi:10.1016/j.egypro.2019.01.132
Sun, Z., Liang, S., and Fu, Y. (2020). Research on identification method of key nodes of power system based on PSNodeRank algorithm. J. Electric Sci. Techn. 35 (02), 157–162. doi:10.19781/j.issn.1673-9140.2020.02.021
Thurner, S., and Poledna, S. (2013). DebtRank-transparency: Controlling systemic risk in financial networks. Sci. Rep. 3 (1), 1888. doi:10.1038/srep01888
Wang, F., Li, L., Li, C., Wu, Q., Cao, Y., Zhou, B., et al. (2017). Fractal characteristics analysis of blackouts in interconnected power grid. IEEE Trans. Power Syst. 33 (1), 1085–1086. doi:10.1109/tpwrs.2017.2704901
Wang, R., Zhang, Y., Yang, Y., and Li, J. (2014). Vulnerable line identification of complex power grid based on electrical betweenness. Power Syst. Prot. Control. 42 (20), 1–6.
Wei, Z., Ju, Q., Yi, G., and Guan, X. (2021). Identification of Critical Lines in Power Grid Based on Modified LeaderRank Algorithm. High Voltage Engineering. Available at: http://kns.cnki.net/kcms/detail/42.1239.TM.20210112.1037.007.html (Accessed January 12, 2021).
Zhang, K., Zhou, B., Or, S. W., Li, C., Chung, C. Y., and Voropai, N. I. (2021). Optimal Coordinated Control of Multi-Renewable-to-Hydrogen Production System for Hydrogen Fueling Stations. IEEE Trans. Ind. Applicat., 1. doi:10.1109/TIA.2021.3093841
Keywords: cascade failure, DebtRank algorithm, overloading state, power system, vulnerability
Citation: Li L, Zeng Y, Chen J, Li Y, Liu H and Ding G (2021) Electrical DebtRank Algorithm–Based Identification of Vulnerable Transmission Lines in Power Systems. Front. Energy Res. 9:786439. doi: 10.3389/fenrg.2021.786439
Received: 30 September 2021; Accepted: 28 October 2021;
Published: 24 November 2021.
Edited by:
Jian Zhao, Shanghai University of Electric Power, ChinaReviewed by:
Ye Cai, Changsha University of Science and Technology, ChinaCopyright © 2021 Li, Zeng, Chen, Li, Liu and Ding. This is an open-access article distributed under the terms of the Creative Commons Attribution License (CC BY). The use, distribution or reproduction in other forums is permitted, provided the original author(s) and the copyright owner(s) are credited and that the original publication in this journal is cited, in accordance with accepted academic practice. No use, distribution or reproduction is permitted which does not comply with these terms.
*Correspondence: Lijuan Li, bGlsakB4dHUuZWR1LmNu
Disclaimer: All claims expressed in this article are solely those of the authors and do not necessarily represent those of their affiliated organizations, or those of the publisher, the editors and the reviewers. Any product that may be evaluated in this article or claim that may be made by its manufacturer is not guaranteed or endorsed by the publisher.
Research integrity at Frontiers
Learn more about the work of our research integrity team to safeguard the quality of each article we publish.