 Haitao Song
 Wentao Huang
- School of Electronic Information and Electrical Engineering, Shanghai Jiao Tong University, Shanghai, China
DC micro-energy system is an effective pattern to integrate high-penetration distribution generators. It has flexible operation modes and complicated fault characteristics, which requires protection with higher selectivity and sensitivity. This paper proposes a DC feeder protection method using the transient high-frequency currents. The fault direction and fault feeder are identified by comparing the amplitude of high-frequency currents of all ends. The amplitude ratio coefficient of DC voltages is introduced to detect the fault pole. The transient high-frequency components will not be affected by the communication delay and fault impedance. The protection scheme realizes the fast detection and clearance of different faults on feeders before the failure of the inverter-interfaced generators and loads, which ensure the reliable and safe operation of the non-fault zone. The model of a DC micro-energy system is established in MATLAB/Simulink and the efficiency of this method is verified by detailed simulations.
Introduction
Recent years, fossil fuels have gradually depleted, and renewable energies have been applied alternatively. As a more effective route to integrate distributed renewable energies, DC micro-energy systems have drawn extensive attention (Sun et al., 2016; Xue et al., 2016; Guo et al., 2017). Compared to AC micro-energy systems, DC micro-energy systems do not have the problems of phase synchronization, frequency stability, and reactive power loss (Jiang and Zheng, 2012; Wu et al., 2012). Moreover, DC micro-energy systems have higher power supply capacity and operation efficiency with fewer convertors (Guo et al., 2010; Dragicevic et al., 2014; Ding et al., 2015). DC micro-energy systems are considered as an effective pattern for the further development of active distribution networks. However, there remains several technical challenges, such as protection, control methods and so on, which needs to be solved before the promotion and implementation of DC micro-energy systems (Park et al., 2013).
DC micro-energy systems include inverter-interfaced distributed generators and loads, short feeders, and energy storages, whose fault characteristics feature variable fault current direction and high current change rate. The fluctuation of distributed generations (DGs) in DC micro-energy systems result in the uncertainty of power flow direction. It challenges the selectivity and reliability of the protection (Wang and Li, 2012; Yang et al., 2012). Due to the low inertia and small impedance of the DC system, fault currents rapidly increase with large peaks when a fault occurs, which will cause high risk to the DC micro-energy system (Liu et al., 2016; Wang et al., 2017; Zhang W. et al., 2020). Fault detection and isolation should be performed as soon as possible, since the fault current withstand rating of typical voltage-source converters (VSCs) is usually only twice the full-load rating of converters (Park et al., 2013). It places demanding speed requirements on the protection system to prevent converter damage. Therefore, it is of great significance to propose a rapid and reliable protection method for the DC micro-energy system to ensure its secure and stable operation.
Up to now, a variety of DC line protection methods have been proposed to realize fast and accurate fault detection. These methods can commonly be classified into three categories: the travelling wave methods, the active injection methods and the fault analysis methods (Jia et al., 2020). The traveling wave method in the work of Zhang C. et al. (2020) configured high-speed protection for DC lines using the index coefficients of the zero-mode fault current initial traveling wave which are related to the location of the faults. Due to the continuous reflections and refractions, it is difficult to obtain a complete analytical expression with the traveling wave method. Therefore, the universal threshold with this method is not easy to determine.
The active injection method employs specific signal injection for fault detection and location. Teng et al. (2020) proposed an improved high-frequency current injection-based protection scheme, which used a two-layer optimum method to eliminate the dead zone of the protection. However, it is easily affected by noise. The fault analysis methods analyze the characteristics of fault electric variables such as overcurrent, differential current and current change rate, to detect faults. Baran and Mahajan (2007) employed over-current and low-voltage criteria to detect faults, which requires more complex setting and appropriate delays to achieve selectivity (Fletcher et al., 2012). In the work of Wang and Li (2012), current differential protection has been applied to the loop DC micro-energy system. The differential protection may mis-trip due to poor synchronization caused by the high change rate of the fault current (Fletcher et al., 2014). It requires a reliable communication system for instantaneous data transfer between the terminals of the protected element, which increases the total cost and scale of the protection system and limits its application in micro-energy systems. Meghwani et al. (2015) proposed a protection scheme for loop DC micro-energy systems using the current change rate. This protection performance relies on the appropriate settings which depend on the cable length, line loading, and fault impedance, making it difficult to calculate.
This paper proposes a feeder protection scheme for DC micro-energy systems using the high-frequency current which is emerged in the initial of faults. The proposed method can operate with a high speed. Due to the used relatively high-frequency fault transient information, it is immune of control strategies of inverter-interfaced distributed generators. Besides, unlike current differential protection, the multipoint amplitude comparison adopted in this paper uses high-frequency currents of all ends to compare with each other, rather than the electrical quantities at both ends of the line, which greatly reduces the requirement for two-terminal data synchronization and avoids complex setting. A DC distribution network model with a multiterminal power supply structure is established and tested to verify the effectiveness of the proposed protection method.
The rest of this paper is organized as follows. The Characteristics of High-Frequency Fault Component in DC Micro-Energy Systems gives a typical topology of the DC micro-energy system and analyzes the fault characteristics. In DC Feeder Protection Method Using High-Frequency components, the DC feeder protection method based on high-frequency current is proposed, including the protection startup criterion, the fault identification criterion, the fault pole selection criterion, and the protection logic. Simulation experiments and detailed analysis are presented in Simulation Results and Analysis. Finally, Conclusion concludes this paper.
The Characteristics of High-Frequency Fault Component in DC Micro-Energy Systems
Typical Structure of DC Micro-Energy Systems
The DC micro-energy system usually adopts the multiterminal power supply structure to improve the power supply reliability. A typical topology of a DC micro-energy system is shown in Figure 1. The DC micro-energy system is composed of photovoltaic (PV) systems, energy storage systems (ESS), electric vehicles (EVs), DC buses (Bus I-Bus III), DC lines, protection devices, and so on. It is connected to the AC main network at both ends through VSC1 and VSC2. There are two operation modes of DC micro-energy systems, i.e., the grid-connected mode and the islanded mode. To ensure the selective removal of the fault feeder, it is necessary to configure protection in each incoming and outgoing line of the DC bus. The orange parts 1–12 in Figure 1 indicate the protection configuration of each line. Each line is named after the protection number, such as Line2_5, Line6_9, Line3, Line7, et al., wherein Line2_5, Line6_9 represents the DC main feeders. Both ends of the main feeder need to be configured with protection devices. Line3 and Line7 are branch feeders. To save circuit breakers, it is only necessary to configure protection at the first end of the branch feeder. The green dashed boxes represent the protection zones, where Bus I and protections one to four together constitute protection zone I (PZ I), Bus II and protections five to eight together constitute protection zone II (PZ II), Bus III and protections 9–12 together constitute protection zone III (PZ III). F1 to F6 represent different fault points.
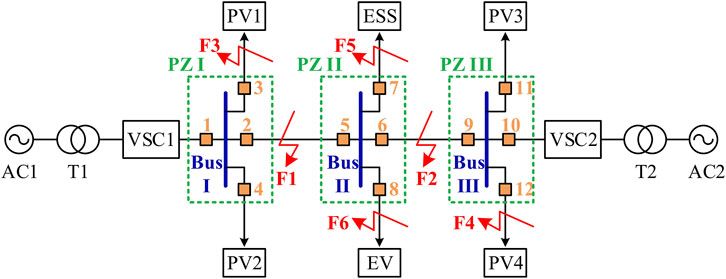
FIGURE 1. Typical structure of a DC micro-energy system.
High-Frequency Characteristics of Faults
Fast Fourier Transform (FFT) algorithm is used to extract high-frequency currents to analyze fault characteristics and distribution of high-frequency currents in this paper. According to the superposition principle, the high-frequency component is equivalent to the superposition of the pre-fault high-frequency component and the additional high-frequency component. introduced by faults (Jia et al., 2018). The voltage and current on the DC line before the fault are dominated by DC components with neglectable high-frequency components (Liu et al., 2017). Therefore, only the additional high-frequency component introduced by faults needs to be considered (Jia et al., 2018). Next, fault characteristics of main feeders and branch feeders will be analyzed to formulate the corresponding protection schemes.
High-Frequency Impedance Equivalent Model of Devices in DC Micro-Energy Systems
PV modules, energy storage equipment, and EVs are all connected to the DC micro-energy system through DC converters. When the fault occurs on the DC system, due to the direct current control strategies of the converter, the short-circuit current provided by these devices to the short-circuit point can always be controlled within the allowable overcurrent range (generally 1.2–1.5 times the rated current) (Liu et al., 2013). The maximum short-circuit current they can provide is approximately equivalent to the current source. Since the capacity of DGs is generally small, the short-circuit current they can provide is also small (Liu et al., 2013). These devices and DC converters can be generally equivalent to the current source and DC capacitor model. The two sources can be analyzed separately based on the superposition principle. In a short time after the fault, only the capacitor discharges rapidly. The discharge current of the capacitor is the main part of the short-circuit current. The short-circuit current provided by the current source is small. We can consider that the output of the current source is constant in a short time after the fault. It does not affect the transient characteristics of the fault at the DC side. According to the substitution theorem in circuit theory, the constant current source can be represented by a constant impedance. Therefore, these devices can be equivalent to a constant impedance model in the high-frequency range, which is no longer affected by the switching state of the converters. The fault component method can be used to analyze the super-imposed network in the frequency domain in the following analysis.
2.1.2 Fault of Main Feeders
Faults F1 and F2 in Figure 1 represent the faults of main feeders. Taking fault F1 to exemplify the fault characteristics, the super-imposed network with fault F1 is shown in Figure 2. Uf(HF) is the high-frequency voltage source at the fault point. If(HF) is the high-frequency current generated by the high-frequency voltage source. ZVSC1, ZPV1, ZESS represent the equivalent high-frequency impedances at the backside of the protection zones.
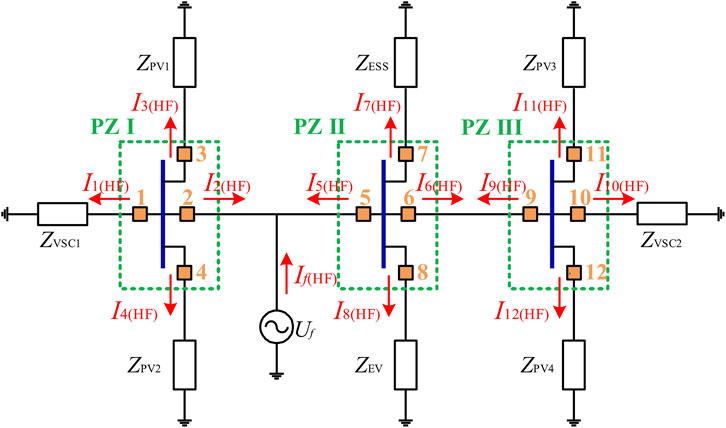
FIGURE 2. Super-imposed network with fault F1.
As shown in Figure 2, according to Kirchhoff’s current law, the phasor relationship of high-frequency currents after the fault is depicted as:
Taking zone PZ I as an example, the relationship of high-frequency currents at each end can be described as:
At high frequencies, the impedance angles of each equivalent high-frequency impedance in the super-imposed network are approximately equal, so the phase angles of
When fault F1 occurs, the amplitude of the high-frequency current at protection 2 is greater than that at other protections (protection 1, 3, 4) in zone PZ I. Similarly, the analysis of zone PZ II shows that the high-frequency current amplitude at protection 5 is greater than that at other protections (protection 6, 7, 8) in zone PZ II. And the high-frequency current amplitude at protection 9 is greater than that at other protections (protection 10, 11, 12) in zone PZ III. That is,
According to (4), the protection with the maximum amplitude of high-frequency currents in each zone can reflect the positive direction of the fault. The reliable protection for the main feeders can be achieved by using the directional pilot principle.
Fault of Branch Feeders
Faults F3 to F6 in Figure 1 represent branch feeder faults. Taking fault F3 as an example to analyze its fault characteristics, the super-imposed network with fault F3 is shown in Figure 3.
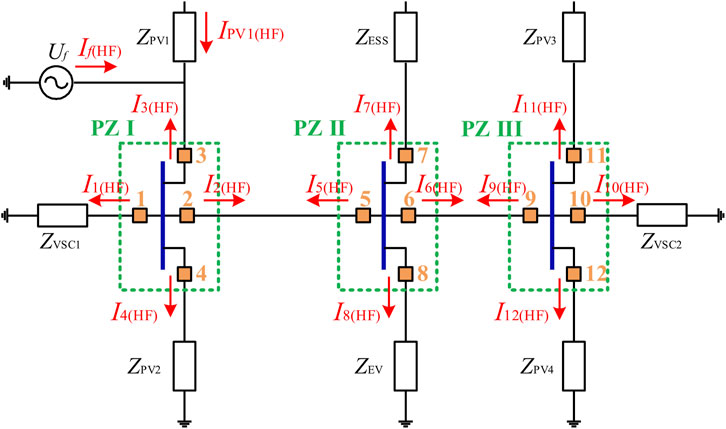
FIGURE 3. Super-imposed network with fault F3.
As shown in Figure 3, according to Kirchhoff’s current law, the phasor relationship of high-frequency currents after the fault is depicted as:
Taking zone PZ I as an example, the relationship of high-frequency currents can be formulated as:
At high frequencies, the impedance angles of each equivalent high-frequency impedance in the super-imposed network are approximately equal, so the phase angles of
When fault F3 occurs, the amplitude of the high-frequency current at protection 3 is greater than that at other protections (protection 1, 2, 4) in zone PZ I. Similarly, the analysis of zone PZ II shows that the high-frequency current amplitude at protection 5 is greater than that at other protections (protection 6, 7, 8) in zone PZ II. And the high-frequency current amplitude at protection 9 is greater than that at other protections (protection 10, 11, 12) in zone PZ III. That is,
From above, the positive direction of fault and the fault line can be identified by using the comparison results of high-frequency current amplitudes in each zone. The protection with the maximum amplitude of high-frequency current reflects the positive direction of the fault.
DC Feeder Protection Method Using High-Frequency Components
Startup Criterion
There is little high-frequency content in the DC system during normal operation. After the fault, the high-frequency content detected at each relay location is abundant [21]. The protection startup is realized by detecting the high-frequency current amplitude at the protection. The protection startup criterion is shown in Eq. 9 as:
where s is the total number of sampling points in the 0.5 ms time window, k is the sampling point serial number in the time window,
The principle of setting the startup threshold is to avoid the maximum amplitude of high-frequency currents detected at the protection during normal operation considering a certain margin. In this paper, the startup threshold is set to 100 times the maximum amplitude of high-frequency currents during normal operation. By simulating the normal operation before the fault, we can know that the maximum amplitude of high-frequency currents during normal operation is about 0.2 A. Thus, the startup threshold is set to 20 A. The high-frequency current after the fault is far greater than the startup threshold. Therefore, the startup threshold is set to 20 A, which can effectively distinguish normal and fault situations.
In practice, the high-frequency current disturbances caused by load mutation, PV output fluctuation, pole open circuit fault et al. also have to be considered in the fixed value setting. These disturbances may exceed the high-frequency current startup threshold. Therefore, this paper adds a low-voltage startup criterion. That is, when the DC bus voltage is less than 0.8 times the rated voltage, the protection algorithm is activated. In the case of a load fluctuation or a PV output fluctuation or some other similar situations, the DC bus voltage fluctuates slightly but is far greater than the low-voltage startup threshold, so the protection will not be initiated. Therefore, the load fluctuation, PV output fluctuation, and pole open circuit fault will not cause maloperation of the protection devices in this paper.
Fault Identification
The average value of the high-frequency current amplitude at protection i within 1 millisecond after the startup criterion is met can be denoted by
where r is the total number of sampling points in the 1 ms time window, and k is the serial number of sampling points in the time window. The count starts after the startup criterion is met, and the average result is obtained after the time window is finished.
The criterion reflecting the positive direction of the fault is formulated as:
where i and j are the protection numbers of the same partition with j ≠i, and Di is the fault direction signal.
When Di is equal to 1, it indicates that the fault happens in the positive direction of protection i and protection i can detect a forward current. When Di is equal to 0, it indicates that the fault happens in the opposite direction of protection i and protection i can detect a reverse current. The branch feeder protection determines whether the fault is on this branch feeder based on the fault direction. The main feeder needs the fault direction at both ends to form the directional pilot protection to determine whether the fault is on this line.
1) The fault identification criterion of branch feeders can be expressed as:
When Di is equal to 1, line i is identified as a fault line due to the positive direction of the fault at protection i. When Di is equal to 0, line i is identified as a non-fault line due to the opposite direction of the fault at protection i.
2) The fault identification criterion of main feeders can be expressed as:
where m is the protection configuration on one side of Linem_n, and n is the protection configuration on the other side of the line. When Fm_n is equal to 1, Linem_n is a fault line; when Fm_n is equal to 0, Linem_n is a non-fault line.
The fault identification criterion of main feeders adopts the pilot protection principle. When the protection devices on both sides of the line detect forward currents, the fault is identified as an internal fault. If the protection device on any side detects a reverse current, the protection will not react. Since it is impossible for the protection devices on both sides to detect the forward current simultaneously in the case of an external fault, the directional pilot principle can effectively prevent the protection devices from false tripping.
Therefore, when the protection devices on both sides of the line detect forward currents and meet the pilot direction criterion, Linem_n can be identified as a fault line. When the protection device on any side of the line detects a reverse current, Linem_n is identified as a non-fault line.
Fault Pole Selection
After selecting the fault line, the fault pole can be identified by the positive voltage and negative voltage of the fault line. When a pole-to-ground fault happens on the DC line, due to the electromagnetic coupling between the positive and negative poles, the non-fault line will also induce certain high-frequency electrical quantities. If the fault pole is identified by comparing the high-frequency electrical quantities of the positive and negative poles, the correctness of the fault pole selection may not be guaranteed. Since the DC component does not produce coupling between bipolar lines, the DC component of positive and negative voltage is used to constitute the pole selection criterion. It can eliminate the influence of electromagnetic coupling on pole selection results.
In the case of a pole-to-ground fault, the DC component voltage amplitude of the fault pole decreases rapidly. Conversely, the DC component voltage amplitude of the non-fault pole increases rapidly. The DC components of the voltage of positive and negative poles remain equal when a pole-to-pole fault happens. This fault feature can be applied to the fault pole selection criterion. Firstly, the amplitude ratio coefficient of DC components of the voltage is defined, as shown in Eq. 14. This coefficient represents the amplitude ratio of DC components of positive and negative voltages on the fault line.
where n is the total number of sampling points in the 1-ms time window, k is the sampling point serial number in the time window, and
According to the fault characteristics, when the positive pole-to-ground fault occurs, the DC component amplitude of the positive voltage is smaller than that of the negative voltage, so ku is a positive number less than 1. When the negative pole-to-ground fault occurs, the DC component amplitude of the positive voltage is greater than that of the negative voltage, so ku is a positive number greater than 1. When the pole-to-pole fault happens, the DC component amplitudes of positive and negative voltages remain equal, so the ku remains near 1. The fault pole selection criterion based on the voltage amplitude ratio coefficient is expressed as:
where h1 and h2 are two set thresholds. In this paper, h1 and h2 can be set to 0.8 and 1.2, respectively.
Protection Logics
The flow chart of the feeder protection method is shown in Figure 4. For a branch feeder fault, when the DC bus voltage and the high-frequency current meet the startup criterion at the same time, the protection is initiated. Then it enters the stages of fault identification and fault pole selection. The fault direction is identified using the maximum value of the high-frequency current at each relay location. The fault line is identified using the criterion shown in Eq. 12. Meanwhile, the amplitude ratio coefficient ku of the fault line is calculated. The fault pole is identified using the fault pole selection criterion shown in Eq. 15. After fault identification and fault pole selection, the DC circuit breakers on both sides of the fault line trip.
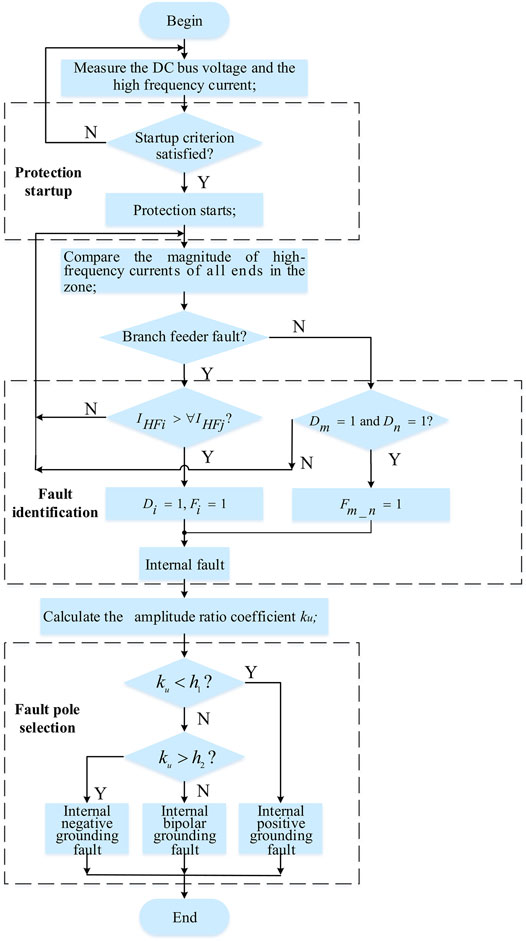
FIGURE 4. Flow chart of the feeder protection method.
For the main feeder fault, only the stage of fault identification needs to be modified to the directional pilot principle, and the processes of protection startup and fault pole selection are the same as the branch feeder fault.
Simulation Results and Analysis
The simulation model of the ± 400 V DC micro-energy system shown in Figure 1 is built in MATLAB/Simulink. The sampling frequency is 10 kHz. The fault occurred at t = 1.2 s. The initial light intensity of the four groups of distributed PV arrays is 700, 800, 900, and 1000 W/m2, respectively. The light intensity of the first three groups jumps to 1000W/m2 at t = 1 s, 2 s, and 3 s, respectively. It is assumed that there are 50 groups of EV charging piles, and the rated power of each charging pile is 10 kW. 35 groups are input at the beginning, and 5 groups are added every 1 s. Table 1 shows other parameters. The Fourier algorithm is used to extract the high-frequency current signal of 1,000 Hz at each relay location in the simulation. Besides, the sliding window is used to calculate the amplitude of the high-frequency current in real time. The fault of the main feeder is simulated in detail. Meanwhile, the simulation of the branch feeder fault is given. In the following diagrams, IHFi represents the high-frequency current amplitude at protection i.
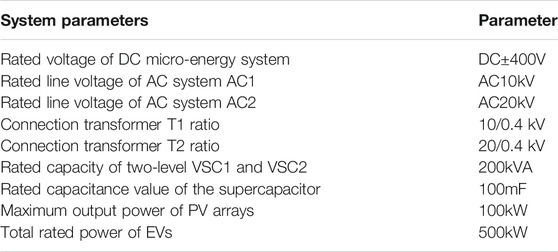
TABLE 1. System parameters.
Performance of the Proposed Protection
Simulation Analysis of Main Feeder Fault
1) Fault Identification Results.
Now we take fault F1 as an example. The high-frequency current waveform for Line2_5 pole-to-pole fault is shown in Figure 5. It can be observed that in zone PZ I, the high-frequency current amplitude of protection 2 is the highest, so protection 2 reflects the positive direction of the fault. Similarly, protection 5 and protection 9 reflect the positive direction of the fault. Other protections except protections 2, 5, and 9 reflect the opposite direction of the fault. Protections 2 and 5 at both ends of Line2_5 meet the directional pilot criterion, and Line 2_5 is identified as the fault line. The left protection 6 of Line6_9 reflects the opposite direction of the fault and does not meet the directional pilot criterion. Therefore, Line6_9 is a non-fault line although the right protection 9 of Line6_9 reflects the positive direction of the fault. Other lines (Line3, Line4 et al.) are non-fault lines because their protection reflects the opposite direction of the fault.
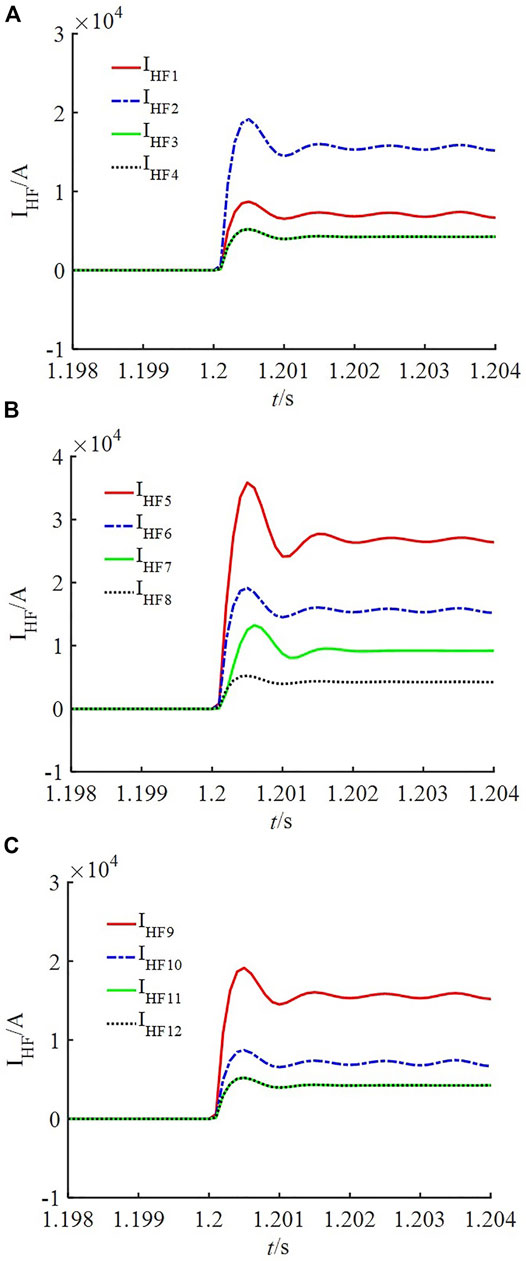
FIGURE 5. High-frequency current waveforms for Line2_5 pole-to-pole fault (A) PZ I (B) PZ II (C) PZ III.
When a pole-to-ground fault happens on Line2_5, the fault identification results of the pole-to-ground fault are consistent with the pole-to-pole fault.
2) Fault Pole Selection Results.
Taking the Line2_5 fault as an example, the positive pole-to-ground fault is set to verify the effectiveness of the pole selection criterion in this paper. Figure 6 shows the result of fault pole selection. The amplitude waveforms of DC components of the positive and negative voltages are shown in Figure 6A. The waveform of DC component voltage amplitude ratio coefficient ku is shown in Figure 6B. In the case of a positive pole-to-ground fault, UHFN increases rapidly meanwhile UHFP and ku decreases rapidly to 0. The fault pole is judged to be positive by the fault pole selection criterion.
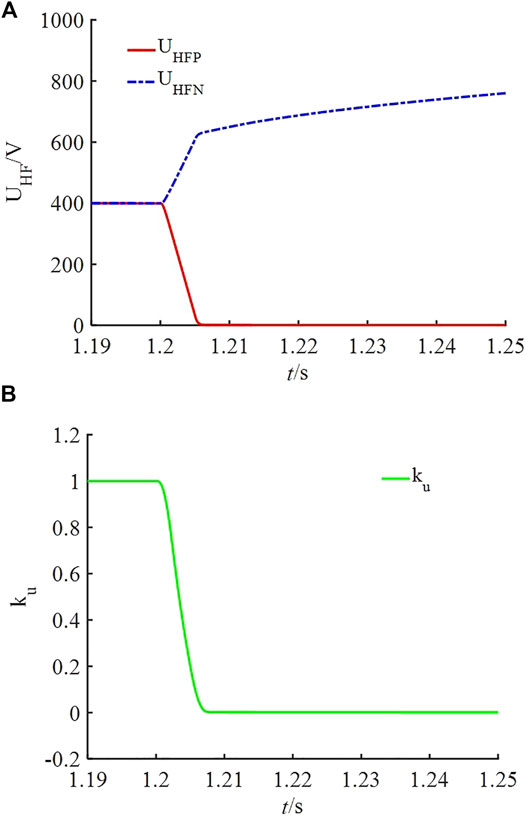
FIGURE 6. Waveforms for Line2_5 positive pole-to-ground fault (A) UHFP and UHFN (B) ku.
From above, it can be obviously concluded that the protection can identify the fault accurately in a short time.
Simulation Analysis of Branch Feeder Fault
Taking fault F3 as an example, when the fault happened on Line3, the high-frequency current waveform of each relay location in zone PZ I is shown in Figure 7. We can observe that the high-frequency current amplitudes in zone PZ I rise rapidly from zero to different positive values after the fault. Comparing the high-frequency current amplitudes at each relay location in zone PZ I, IHF3 is the largest. Therefore, only protection 3 in zone PZ I reflects the positive direction of the fault. Then the Line3 fault can be identified. The circuit breakers of protection 3 are quickly broken. Since protection 2 reflects the opposite direction of the fault, the right zones PZ II and PZ III are both non-fault zones. In this case, the proposed protection can also operate reliably.

FIGURE 7. High-frequency current waveforms for Line3 fault.
Influence of Transition Resistance on Protection Performance
The capability to withstand transition resistance of the amplitude-comparison protection is verified below. For different transition resistances, the fault identification results of Line2_5 are shown in Table 2. It can be observed that the amplitude-comparison protection has a strong capability to withstand the transition resistance. Even under the condition of large transition resistance of 10,000 mΩ, the positive direction of fault and the fault line can be accurately identified by comparing the amplitude of high-frequency currents in each zone.
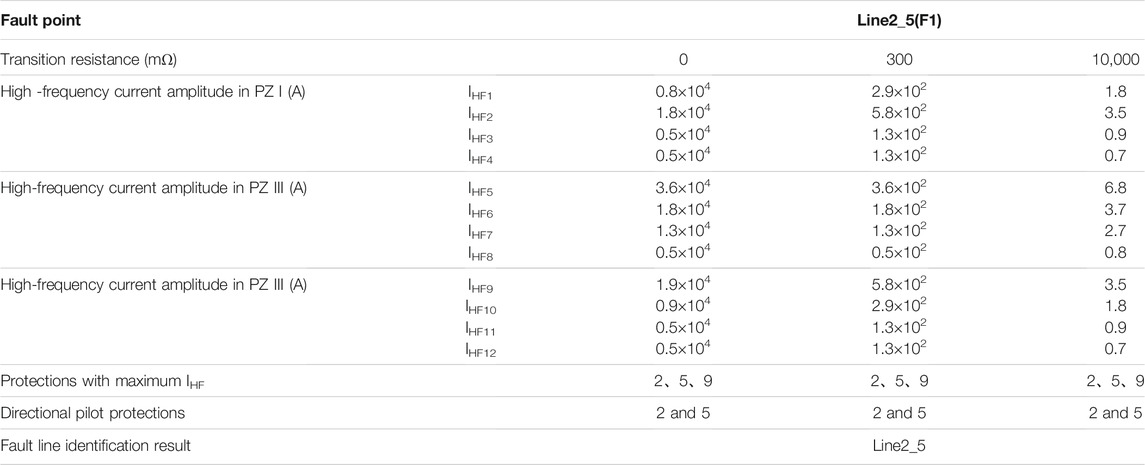
TABLE 2. Fault simulation results of Line2_5.
Influence of High-Frequency Current Characteristic Frequency Selection on Protection Performance
The characteristic frequency of high-frequency currents is selected as 1,000 Hz in this paper. The high-frequency current protection method is based on the superposition principle, which uses the characteristics that the high-frequency current is very low during normal operation and increases significantly after the fault. The simulation results of high-frequency current before and after the fault are shown in Table 3. The rationality of selecting the characteristic frequency of high-frequency currents as 1,000 Hz is explained as follows:
1) During normal operation, the main component of the DC line current is the DC component, and the high-frequency component is little. According to the average value of high-frequency currents within 1 ms before the fault in Table 3, the lower the characteristic frequency, the greater the pre-fault high-frequency current is. When the frequency is less than 600 Hz, the pre-fault high-frequency current will be greater than 0.228 A. When the frequency is 1,000 Hz and above, the pre-fault high-frequency current will be less than 0.14 A. According to the superposition principle, the fault high-frequency component is equivalent to the superposition of the pre-fault high-frequency component and the additional high-frequency component introduced by fault. When the frequency is low, it is inevitable to consider the pre-fault high-frequency component. Higher frequency selection is conducive to completely ignoring the pre-fault high-frequency component.
2) According to the average value of high-frequency currents within 1 ms after the fault in Table 3, the higher the characteristic frequency, the smaller the high-frequency current after the fault is. Therefore, the selected frequency cannot be too high. Otherwise, the high-frequency current amplitude is low when the fault happens, which is not conducive to fault detection. In addition, according to Shannon’s theorem, the sampling frequency should be more than twice the high-frequency frequency. The overhigh frequency selected requires a higher sampling frequency of the device.
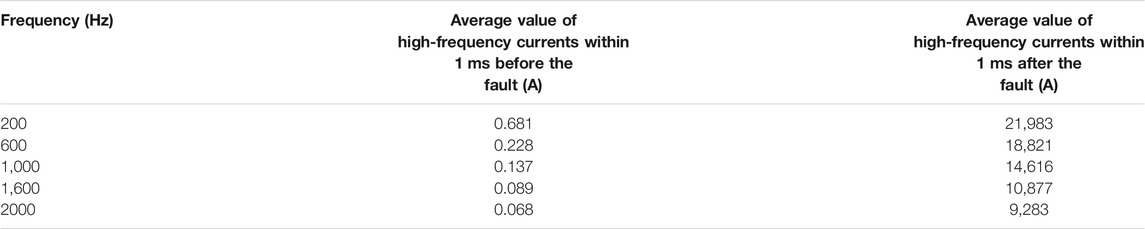
TABLE 3. Simulation results of high-frequency current before and after fault with different characteristic frequencies of high- frequency currents.
In this paper, the system is required to meet the following conditions: 1) The high-frequency current is almost zero during normal operation; 2) The high-frequency current with high amplitude will be produced after the fault, which is conducive to fault detection; 3) The engineering requirements of the sampling frequency are met. Therefore, the frequency selection of 1000 Hz is more reasonable.
Influence of Load Mutation on Protection Performance
The load mutation can be simulated by a sudden increase of the EV load. After 1.2 s, the EV load is suddenly increased by 150 kW. Figure 8 shows the high-frequency current amplitude at the relay location of each zone.
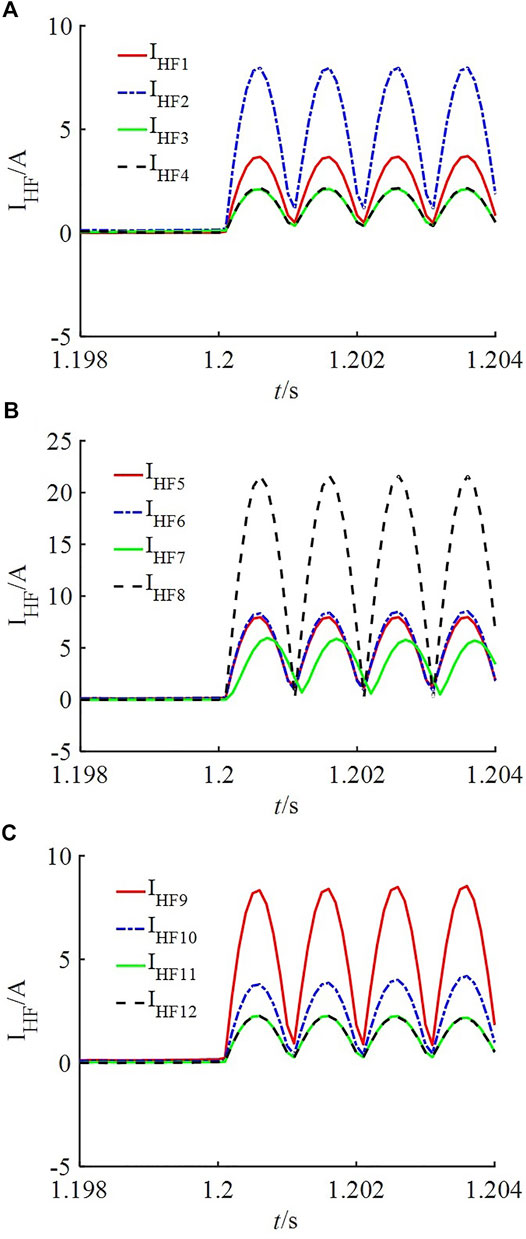
FIGURE 8. High-frequency current waveforms when the load changes suddenly (A) PZ I (B) PZ II (C) PZ III.
Although the load mutation will produce high-frequency current disturbances, the low-voltage startup criterion is added in this paper. The load mutation will not cause a significant drop in DC voltages and the protection will not be initiated. Therefore, the load mutation does not affect the performance of protection.
Influence of Data Synchronization Error on Protection Performance
The existing protection methods of DC micro-energy systems include conventional overcurrent protection, distance protection, and current differential protection. Among them, overcurrent protection has poor selectivity due to small differences in the characteristics of internal and external faults. Besides, the threshold of overcurrent protection is difficult to set and easily affected by the transition resistance. As for distance protection, it is difficult to measure impedances accurately in a short time, and the measurement error is large and vulnerable to transition resistance. Current differential protection has strict requirements for data synchronization, and a small time difference in synchronization of external faults will also produce a differential current with a high peak value, leading to maloperation of current differential protection. The high-frequency current protection proposed in this paper can address these issues above effectively. To demonstrate the validity of the proposed scheme, an experiment is built and tested.
The data at both ends of Line2_5 are set to be asynchronous. The time difference in synchronization is set to 1 ms. The differential current, braking current, and high-frequency current waveforms are simulated to compare the performance of current differential protection and high-frequency current protection in this paper.
1) Internal Fault Analysis:
Taking F1 pole-to-pole fault as an example, for Line2_5, F1 is an internal fault. Figure 9A shows the waveforms of the differential current and the braking current of this line without data synchronization. Figure 9B shows the comparison with data synchronization. When data are strictly synchronized, the differential current is much larger than the braking current in the case of an internal fault. However, the difference between the differential current and the braking current is very small when data are not synchronized. Therefore, unsynchronized data will reduce the sensitivity of current differential protection, which may cause protection rejection in the case of an internal fault.
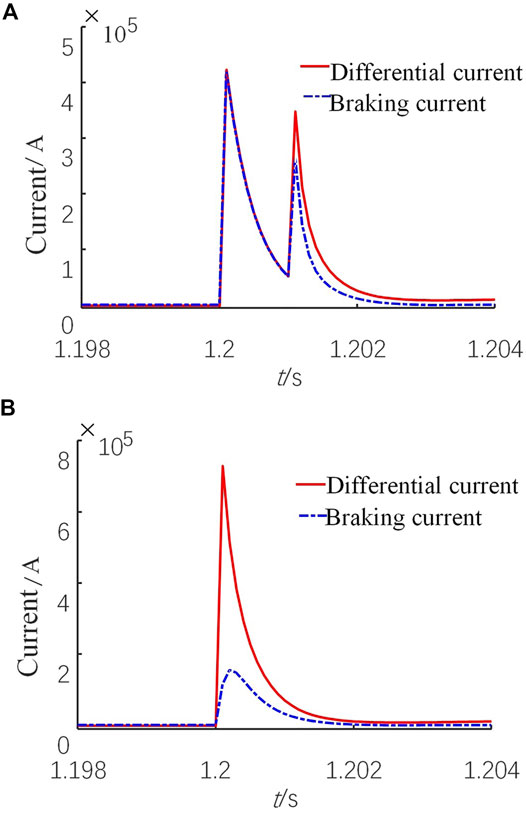
FIGURE 9. Differential current and restraint current waveforms under an internal fault condition (A) Without data synchronization (B) With data synchronization.
When data are not synchronized, the high-frequency current waveforms in zone PZ I and PZ II in the case of the Line 2_5 internal fault are shown in Figure 10. We can observe that unsynchronized data only delay the fault direction identification time of zone PZ I but do not affect the correctness of the fault direction identification. In this paper, the high-frequency current protection can still accurately identify the internal fault.
2) External Fault Analysis:
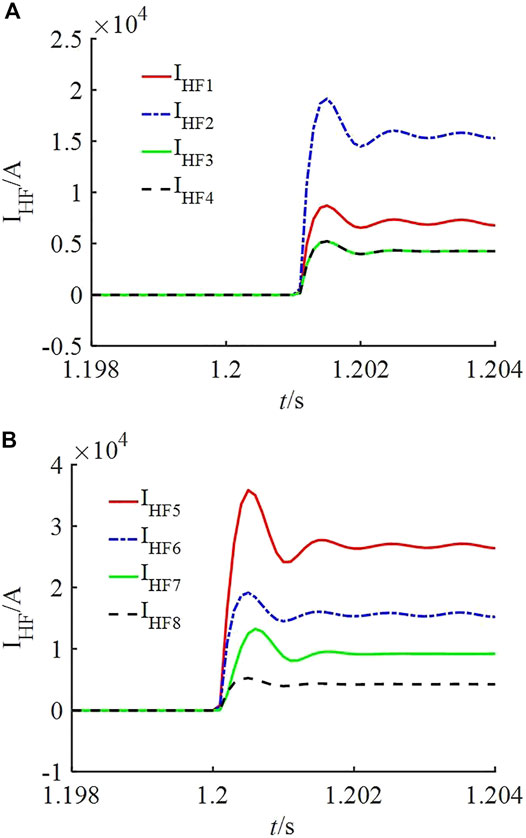
FIGURE 10. High-frequency current amplitude waveforms under an internal fault without data synchronization (A) PZ I (B) PZ II.
Take the three-phase short-circuit fault of the AC system on the left as an example. For Line 2_5, it is an external fault. Figure 11A shows the waveforms of the differential current and the braking current of this line without data synchronization. Figure 11B shows the comparison with data synchronization. The differential current is strictly zero under an external fault condition when data are strictly synchronized. When data are out of synchronization, the differential current is greater than the braking current in a short time after the external fault. Therefore, unsynchronized data will easily cause false tripping of current differential protection devices in the case of an external fault, which greatly affects the performance of current differential protection.
FIGURE 11. Differential current and restraint current waveforms under an external fault (A) Without data synchronization (B) With data synchronization.
When data are not synchronized, the high-frequency current waveforms in zone PZ I and PZ II under the Line 2_5 external fault are shown in Figure 12. Unsynchronized data only delay the time of fault direction identification of zone PZ I but do not affect the correctness of fault direction identification. In this paper, high-frequency current protection can still accurately identify the internal fault. Since the protection in this paper adopts the directional pilot principle, it can ensure that protection devices will not malfunction when an external fault happens.
FIGURE 12. High-frequency current amplitude waveforms under an external fault without data synchronization (A) PZ I (B) PZ II.
Therefore, current differential protection has very strict requirements for data synchronization. It is prone to false tripping under an external fault condition and rejection under an internal fault condition. In this paper, high-frequency current protection adopts the principle of partition comparison and directional pilot connection, which has significant advantages in reducing the requirement for data synchronization and improving selectivity of protection.
Conclusion
DC micro-energy systems provide an efficient way to integrate fast-growing renewable energy sources, energy storage systems, and electronic loads. However, existing protection schemes are difficult to realize fast and accurate fault detection and isolation for DC micro-energy systems. This paper proposed an amplitude-comparison DC feeder protection scheme using high-frequency current, aiming at the problems of protection for DC micro-energy systems in selectivity, speed, and threshold setting. The fault direction can be identified by comparing the amplitudes of high-frequency currents at the relay location in each zone. The fault line can be identified by using the fault direction or the directional pilot criterion. Moreover, the fault pole can be identified using the voltage amplitude ratio coefficient of DC components. The characteristics of the proposed protection method are outlined as follows:
1) The fault identification criterion uses the principle of high-frequency current amplitude comparison without threshold setting. It solves the problem that threshold setting of the existing protection methods needs to consider the high-impedance fault at the end of the line and the low-impedance fault at the first end of the down line.
2) The protection method has absolute selectivity and can accomplish rapid protection of the whole line without a dead zone, which solves the problems of small differences between internal and external faults and poor protection selectivity.
3) The protection can identify the fault of branch feeders and main feeders and has a strong capability to withstand the transition resistance.
Data Availability Statement
The original contributions presented in the study are included in the article/supplementary material, further inquiries can be directed to the corresponding author.
Author Contributions
HS, LY and WH contributed to conception and design of the study. SC organized the database. LY performed the statistical analysis. SC wrote the first draft of the manuscript. HS, LY, WH, and NT wrote sections of the manuscript. All authors contributed to manuscript revision, read, and approved the submitted version.
Conflict of Interest
The authors declare that the research was conducted in the absence of any commercial or financial relationships that could be construed as a potential conflict of interest.
Publisher’s Note
All claims expressed in this article are solely those of the authors and do not necessarily represent those of their affiliated organizations, or those of the publisher, the editors and the reviewers. Any product that may be evaluated in this article, or claim that may be made by its manufacturer, is not guaranteed or endorsed by the publisher.
References
Baran, M. E., and Mahajan, N. R. (2007). Overcurrent Protection on Voltage-Source-Converter-Based Multiterminal DC Distribution Systems. IEEE Trans. Power Deliv. 22 (1), 406–412. doi:10.1109/TPWRD.2006.877086
Ding, M., Tian, L., Pan, H., Zhang, X., and Zhou, J. (2015). Research on Control Strategy of Hybrid AC/DC Microgrid. Power Syst. Prot. Control. 43 (9), 1–8.
Dragicevic, T., Vasquez, J. C., Guerrero, J. M., and Skrlec, D. (2014). Advanced LVDC Electrical Power Architectures and Microgrids: A Step toward a New Generation of Power Distribution Networks. IEEE Electrific. Mag. 2 (1), 54–65. doi:10.1109/MELE.2013.2297033
Fletcher, S. D. A., Norman, P. J., Fong, K., Galloway, S. J., and Burt, G. M. (2014). High-Speed Differential Protection for Smart DC Distribution Systems. IEEE Trans. Smart Grid 5 (5), 2610–2617. doi:10.1109/TSG.2014.2306064
Fletcher, S. D. A., Norman, P. J., Galloway, S. J., Crolla, P., and Burt, G. M. (2012). Optimizing the Roles of Unit and Non-unit Protection Methods within DC Microgrids. IEEE Trans. Smart Grid 3 (4), 2079–2087. doi:10.1109/TSG.2012.2198499
Guo, T. Y., Zhao, G. S., Zhao, Y., Cheng, R. Q., and Qi, C. (2010). Modeling and Simulation of Microgrid System Based on Wind-Solar Hybrid. Power Syst. Prot. Control. 38 (21), 104–108. doi:10.3969/j.issn.1674-3415.2010.21.021
Guo, Y., Chen, J., He, H., Wu, Q., Han, B., and Lee, G. J. (2017). A Review on AC/DC Hybrid Microgrid Key Technology Containing Distributed New Energy. Electric Power Construction 38 (3), 9–18.
Jia, K., Feng, T., Zhao, Q., Wang, C., and Bi, T. (2020). High Frequency Transient Sparse Measurement-Based Fault Location for Complex DC Distribution Networks. IEEE Trans. Smart Grid 11 (1), 312–322. doi:10.1109/TSG.2019.2921301
Jia, K., Xuan, Z., Lee, C., Wang, C., and Lee, M. (2018). A Directional Pilot Protection Based on Phase Angle of Transient High-Frequency Impedance for Flexible DC Distribution Grid. Proc. CSEE 18, 5343.
Jiang, D., and Zheng, H. (2012). Research Status and Developing Prospect of DC Distribution Network. Automation Electric Power Syst. 36 (8), 98–104. doi:10.3969/j.issn.1000-1026.2012.08.018
Liu, J., Tai, N., and Fan, C. (2017). Transient-Voltage-Based Protection Scheme for DC Line Faults in the Multiterminal VSC-HVDC System. IEEE Trans. Power Deliv. 32 (3), 1483–1494. doi:10.1109/TPWRD.2016.2608986
Liu, J., Zhang, X., Tong, X., Zhang, Z., and Chen, Y. (2013). Fault Location for Distribution Systems with Distributed Generations. Automation Electric Power Syst. 37 (2), 36–42. doi:10.7500/AEPS201208181
Liu, X., Xie, Z., Sun, Q., and Wang, Z. (2016). Fault Analysis and Protection for LV Bipolar DC Microgrid. Power Syst. Tech. 40 (3), 749–755. doi:10.13335/j.1000-3673.pst.2016.03.013
Meghwani, A., Srivastava, S. C., and Chakrabarti, S. (2015). A New Protection Scheme for DC Microgrid Using Line Current Derivative. Proc. 2015 IEEE Power Energ. Soc. Gen. Meet., 1–5. doi:10.1109/PESGM.2015.7286041
Park, J.-D., Candelaria, J., Ma, L., and Dunn, K. (2013). DC Ring-Bus Microgrid Fault Protection and Identification of Fault Location. IEEE Trans. Power Deliv. 28 (4), 2574–2584. doi:10.1109/TPWRD.2013.2267750
Sun, P., He, C., Shao, H., and Liu, X. (2016). Research Status and Development of DC Distribution Network. Electric Power Automation Equipment 36 (6), 64–73. doi:10.16081/j.issn.1006-6047.2016.06.010
Teng, Y., Zhang, Z., and Li, X. (2020). Improved Approach to High-Frequency Current Injection-Based Protection for Grounding Electrode Line in High-Voltage Direct Current System. IEEE Trans. Ind. Applicat. 56 (3), 2409–2417. doi:10.1109/TIA.2020.2979960
Wang, H., and Li, G. (2012). Control Strategy of Microgrid with Different DG Types. Electric Power Automation Equipment 32 (5), 19–23.
Wang, Y., Ming, Y. U., and Zhang, L. (2017). Short Circuit Fault Analysis and Protection Scheme for Looped DC Microgrid. Electric Power Automation Equipment 37 (2), 7–14. doi:10.16081/j.issn.1006-6047.2017.02.002
Wu, W., He, Y., Geng, P., Qian, Z., and Wang, Y. (2012). Key Technologies for DC Micro-grids. Trans. China Electrotechnical Soc. 27 (1), 98–113.
Xue, S., Qi, J., and Liu, C. (2016). A Research Review of Protection for DC Microgrid. Proc. CSEE 36 (13), 3404–3412. doi:10.13334/j.0258-8013.pcsee.160148
Yang, J., Fletcher, J. E., and O'Reilly, J. (2012). Short-circuit and Ground Fault Analyses and Location in VSC-Based DC Network Cables. IEEE Trans. Ind. Electron. 59 (10), 3827–3837. doi:10.1109/TIE.2011.2162712
Zhang, C., Song, G., and Dong, X. (2020b). A Novel Traveling Wave Protection Method for DC Transmission Lines Using Current Fitting. IEEE Trans. Power Deliv. 35 (6), 2980–2991. doi:10.1109/TPWRD.2019.2960368
Keywords: DC micro-energy systems, feeder protection, high-frequency currents, amplitude comparison, fault identification
Citation: Song H, Yang L, Chen S, Huang W and Tai N (2021) A Feeder Protection Scheme for DC Micro-Energy System. Front. Energy Res. 9:785147. doi: 10.3389/fenrg.2021.785147
Received: 28 September 2021; Accepted: 18 October 2021;
Published: 03 November 2021.
Edited by:
Bin Zhou, Hunan University, ChinaReviewed by:
Changcheng Li, Guangxi University, ChinaLiang Ji, Shanghai University of Electric Power, China
Copyright © 2021 Song, Yang, Chen, Huang and Tai. This is an open-access article distributed under the terms of the Creative Commons Attribution License (CC BY). The use, distribution or reproduction in other forums is permitted, provided the original author(s) and the copyright owner(s) are credited and that the original publication in this journal is cited, in accordance with accepted academic practice. No use, distribution or reproduction is permitted which does not comply with these terms.
*Correspondence: Wentao Huang, aHd0ODk4OUBzanR1LmVkdS5jbg==