 Xun Zhou
 Runxuan Qin
95% of researchers rate our articles as excellent or good
Learn more about the work of our research integrity team to safeguard the quality of each article we publish.
Find out more
ORIGINAL RESEARCH article
Front. Energy Res. , 16 November 2021
Sec. Advanced Clean Fuel Technologies
Volume 9 - 2021 | https://doi.org/10.3389/fenrg.2021.784654
This article is part of the Research Topic Advanced Technologies in Flow Dynamics and Combustion in Propulsion and Power View all 25 articles
To study the influence of different hole length ratios on the flow structure and film cooling efficiency, a calculation model of fan-shaped hole was constructed and numerically studied. The effect of different hole length ratios on the cooling efficiency under different blowing ratios was compared and analyzed. The results showed that as the blowing ratio increases, the overall average efficiency of most of the hole length ratio cases first increases and then decreases. Only in the case with a cylindrical part length/total length ratio of 0.5 did the efficiency continue to increase. When the blowing ratio is small, the spanwise average efficiency of each hole length ratio case is closer, but the flow structure and efficiency distribution are quite different. For the medium blowing ratio, the overall average efficiency of the small hole length ratio case is higher, and the efficiency decreases as the hole length ratio increases. When the cylindrical part length/total length ratio is further increased to 1, the cooling efficiency region basically converges into a spanwise narrow region. For larger blowing ratio conditions, after 10D after the hole outlet, the case with a cylindrical part length/total length of 0.5 is more efficient.
As the turbine inlet temperature increases, the thermal load of the turbine blades increases accordingly, and therefore, higher requirements are put forward for the cooling of the turbine. Film cooling is an important part of gas turbine external cooling. Using a flat film cooling model is very helpful for studying the flow and heat transfer characteristics of film cooling.
Li et al., 2014 used pressure-sensitive paint and particle image velocimetry technology to measure the flow field and temperature field of film cooling of cylindrical holes with composite angles of 0°, 45°, and 90°. It was found that the flow field structure changes greatly when the compound angle changes. Rogers et al., 2017 conducted an experimental study on cross-flow-supplied full-coverage film cooling for a sparse film cooling hole array and found that the adiabatic film cooling effectiveness generally increased with the streamwise position and generally increased as the blowing ratio increased. Luo et al., 2021 studied the application of film cooling to the cooling system of the leading edge of hypersonic aircraft and found that low-density coolant air has the lowest peak temperature compared with high-density coolant air. El-Gabry et al., 2013 used infrared radiation thermography, liquid crystal thermography, and thermocouples to measure flow field temperature and film cooling efficiency and used hotwire anemometry to measure velocity and turbulence quantities. The velocity vectors and contours at the streamwise planes showed a distinct kidney vortex, and the contours also indicated that the jet was lifted. Johnson et al., 2014 used pressure-sensitive paint technology to measure the adiabatic film cooling efficiency of a row of cylindrical holes and found that, as the density ratio increased, the adiabatic film cooling efficiency also increased. Eberly and Thole, 2014 used time-resolved digital particle image velocimetry technology to measure the flow field of a row of cylindrical film cooling holes and found Kelvin–Helmholtz breakdown in the jet-to-freestream shear layer. Laroche et al., 2021 conducted research on film cooling of flat plates with a 90F0B0 compound angle and used the particle image velocimetry technique to document the velocity field. The temperature field was acquired using the cold wire technique. In the first three rows, the film protection was shown not to be efficient. After four rows, the film builds up, leading gradually to better insulation of the wall. Jeon and Son, 2021 used computational fluid dynamics to study the simplified geometry of an integrated configuration of a ribbed channel, film hole, and mainstream passage and found that the film cooling holes located in the separated flow region of a ribbed channel showed minimum reduction and considerable enhancement in film cooling effectiveness, and internal heat transfer also improved. Tian et al., 2021 conducted a three-dimensional turbine cascade model to analyze particle trajectories at the blade leading edge under film-cooled protection. The deposition mechanism in this research was based on the particle sticking model and the particle detachment model. The numerical results indicated that most of the impact region was located at the leading edge and on the pressure side.
In addition to cylindrical film cooling holes, there are a variety of hole types used in film cooling studies. Wright et al., 2011 used pressure-sensitive paint technology to conduct experimental research on the film cooling efficiency of cylindrical holes, fan-shaped holes, and laidback fan-shaped holes and found that in all hole-type cases, as the freestream turbulence intensity increases, the film effectiveness decreases. As the blowing ratio increases, this effect decreases. Lee and Kim, 2012 carried out a numerical simulation study with a novel film-cooling hole, compared its cooling efficiency with a fan-shaped hole, and found that the novel-shaped hole shows greatly improved lateral spreading of the coolant and cooling performance in terms of the film-cooling effectiveness in comparison with the fan-shaped hole. Issakhanian et al., 2016 proposed a new oval film cooling hole and used magnetic resonance concentration technology to measure the coolant concentration in the 3D test field. The results showed that compared to the round hole, the oval hole reduces the strength of the main counter rotating vortex pair. Ragab and Wang., 2018a, Ragab and Wang., 2018b used infrared cameras and thermocouples to measure the temperature field and found that the newly incorporated fan-shaped film cooling hole had higher film cooling efficiency than cylindrical holes. Lee et al., 2021 experimentally investigated the effect of mainstream velocity on the optimization of a fan-shaped hole on a flat plate and found that the optimized hole showed a 49.3% improvement in the overall averaged film cooling effectiveness compared to the reference hole with DR = 2.0 and M = 2.0. Baek et al., 2021 numerically simulated the film cooling flow with a shaped hole with 15° forward expansion, a 35° inclination angle, and 0° and 30° compound angles with large eddy simulations. The results showed that the turbulence and mixing intensity of the forward expansion hole were weaker and lower than those of the cylindrical hole, respectively. Thus, the film cooling effectiveness of the forward expansion hole was higher. Kim et al., 2021 performed an experimental study to investigate the effects of the arrangement of fan-shaped film cooling holes and the density ratio on the heat transfer coefficient and found that, for the given fan-shaped hole parameters, the effects of the row-to-row distance and hole arrangement were not significant.
Burd et al., 1998 used hot-wire anemometry measurements to measure the average velocity and turbulence intensity of the mixing area of the coolant and free-stream flows in film cooling and found that under low free-stream turbulence conditions, pronounced differences existed in the flow field between L/D = 7.0 and 2.3. These differences became less prominent at high free-stream turbulence intensities. Lutum and Johnson, 1999 conducted an experimental study on the influence of hole length on the cooling efficiency of cylindrical film cooling holes and found that when the hole length is greater than five times the hole diameter, the cooling efficiency is basically not affected. Gritsch et al., 2005 conducted experiments on the film cooling efficiency of three fan-shaped holes with L/D = 7.5, 9.5, and 11.5, and the results showed that the average cooling efficiency of the three cases was not much different. Haydt et al., 2018 used computational fluid dynamics prediction and particle image velocimetry measurement to study the adiabatic film efficiency of 7–7–7 holes with different hole lengths. In this study, the expansion mode was maintained unchanged, and different hole lengths led to different area ratios. The research results show that a larger hole length provides higher effectiveness. Saumweber and Schulz, 2012 conducted an experimental study on the film cooling efficiency of two fan-shaped holes with L/D = 6 and 10 and found that under the small blowing ratio condition, the cooling efficiency of the long hole length case was slightly higher. However, the cooling efficiency of the long hole length case is lower at high blowing ratio conditions.
However, there have been some studies on the hole length of film cooling. In the existing research on the hole length of the fan-shaped hole, the total hole length of the film cooling hole and the area ratio and shape of the hole inlet and outlet were not fixed, which mainly reflects the influence of the change in total hole length and area ratio.
In this paper, a numerical study was carried out on a flat film cooling model, which is shown in Figure 1A. There is only one film cooling hole in the flat model, the hole diameter is 5 mm, and the hole inclination angle is 30°. The width of the plate in the spanwise direction is 12D, and the mainstream inlet is set 10D upstream of the hole. To study the long-distance effect of film cooling, the mainstream outlet is at 60D downstream of the hole. The height of the main flow domain is set to 20D to shield the cooling air from the influence of the upper wall of the main flow. The cooling air is provided by the plenum, which is the coolant inlet at one end and the other closed structure, with a width of 6D and a height of 2D. To comment on the influence of cross-flow, the angle between the cold air flow direction and mainstream flow direction is 90°. Except for the mainstream inlet, the mainstream outlet, and the coolant inlet in the domain, the rest of the walls are nonslip frictionless and adiabatic walls. The total temperature at the mainstream inlet is 540 K, the turbulence intensity is 3.6%, and the static pressure at the outlet is 101,325 Pa, while ensuring that the mainstream Mach number is 0.3. For the coolant, the inlet total temperature is 310 K, and the turbulence intensity is 3.6%, which is consistent with the conditions reported in Saumweber et al., 2003. The blowing ratio of the film cooling hole is controlled by specifying the mass flow at the coolant inlet. The working fluid under study is ideal air.
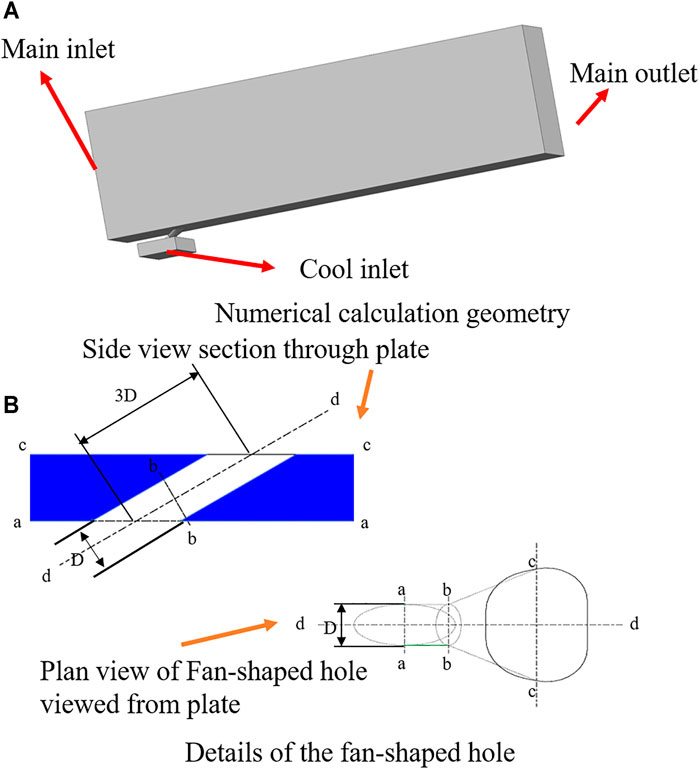
FIGURE 1. Geometry. (A) Numerical calculation geometry and (B) details of the fan-shaped hole.
The film cooling holes studied in this research are fan-shaped holes based on the construction method in Saumweber et al., 2003, as shown in Figure 1B. In the study, the total hole length is 3D. Under the condition of ensuring that the inlet and outlet of the film cooling hole remain unchanged, the ratio of the hole length of the film cooling hole is controlled by adjusting the position of the interface (b–b plane in the figure) between the cylindrical part and the fan-shaped part. To ensure that the overall layout of the air film holes is a cylindrical fan-shaped structure, and considering the hole inclination angle of 30°, the adjustment space of the interface is limited to at least 1D from the wall in the axial direction of the hole. That is, the b–b plane should be located between the e plane and the f plane in the axial direction of the hole. The cylindrical part length refers to the distance between the b–b plane and the e plane in the axial direction of the hole, while the total part length refers to the distance between the e plane and the f plane in the axial direction of the hole. A total of five cases with a C/L of 0, 0.25, 0.5, 0.75, and 1 were set up. The length of the cylinder part refers to its length in the axial direction of the hole and does not include the length of the restriction section. Even if the cylindrical part length/total length ratio reaches 1, the overall structure of the cylinder fan shape and the area ratio of the inlet and outlet remain unchanged. At the same time, to clarify the influence of different blowing ratios, five blowing ratios of 0.5, 1.0, 1.5, 2.0, and 2.5 are set.
The grids used in the calculation are structured grids generated by ANSYS ICEM CFD. To ensure that the value of y+ on the wall is near 1, a surface layer is provided on all the walls. The fluid domain mesh and details are shown in Figure 2A. The original fan-shaped hole is set with three grids of coarse, medium, and fine meshes, with 780,000, 3.27 million, and 5.26 million grids, respectively. The distribution of the spanwise average cooling efficiency in different grid numbers along the flow direction is shown in Figure 2B. The difference between the predicted values of the 3.27 million and 5.26 million grids is very small. The two lines representing 3.27 million and 5.26 million in the figure basically coincide. Therefore, the medium-scale grid was selected in the following research.
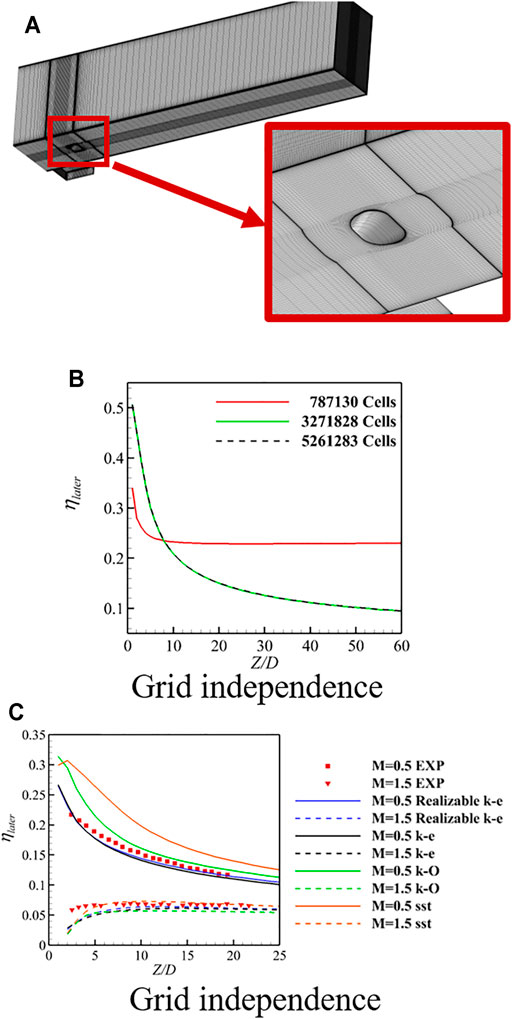
FIGURE 2. Grid and method information. (A) Computational grids, (B) grid independence, and (C) numerical verification.
The overall simulation analysis uses ANSYS Fluent software, the realizable k–e turbulence model to solve the Reynolds averaged Navier–Stokes equations, and selects the enhanced wall treatment to strengthen the simulation of the flow near the wall. The coupled solver is used to enhance the stability and convergence of the solution, and the normalized root mean square convergence criterion of the residuals is <1 F0B4 10−6. In order to verify that the turbulence model selection is reasonable and the simulation method is effective, four turbulence models of standard k–e, k–o, SST, and realizable k–e are selected, and their results are verified with the experimental results in Ref. SAUMWEBER, 2003. Figure 2C shows the distribution of the spanwise average cooling efficiency in different turbulence models along the flow direction. When the blowing ratio is 0.5, the predictions of the adiabatic efficiency of the SST and k–o models are too high, the predicted values of the standard k–e and realizable k–e models are almost the same, but the predicted value of the realizable k–e model is closer to the experimental value. When the blowing ratio is 1.5, the predictions of various models for the vicinity of the hole outlet region are relatively low, but the predicted value of the downstream region is only slightly different from the experimental value. On the whole, the numerical results using the realizable k–e model are the closest to the experimental results, so the realizable k–e model was selected in this study as Liu et al., 2015.
According to Figure 3A, when the blowing ratio is small, the difference between different C/L cases is smaller, but as the C/L increases, the overall cooling efficiency decreases. As the blowing ratio increases, the difference between the various C/L cases increases. When the blowing ratio increases to 2, as the C/L increases, the overall average cooling efficiency does not simply decrease but first slightly increases and then decreases. According to Figure 3B, the two cases with C/L = 0 and 0.25 have similar trends with the blowing ratio. The overall average efficiency continues to rise when the blowing ratio increases from 0.5 to 2 and then decreases slightly when the blowing ratio is larger. For the case with C/L = 0.75, the overall average efficiency still increases first with the increase in the blowing ratio and decreases when the blowing ratio is >2, but the decrease is greater. As C/L = 1, the overall average efficiency first increases and then decreases as the blowing ratio increases, but the inflection point blowing ratio is smaller. The most special one is the case with a C/L of 0.5. In this case, the overall average efficiency continues to increase as the blowing ratio increases. When the blowing ratio is large, the overall average efficiency is higher than the overall average efficiency in the small C/L case.

FIGURE 3. Overall averaged efficiency. (A) Hole length ratio and (B) M.
Take the basic C/L of 0.5 as an example to study the influence of different blowing ratios on the flow structure and film cooling efficiency. As shown in Figure 4, under different blowing ratio conditions, the spanwise average cooling efficiency basically decreases along the flow direction. Near the outlet of the film cooling hole, the spanwise average cooling efficiency of different blowing ratios is relatively small, but the spanwise average cooling efficiency first increases and then decreases as the blowing ratio increases. For the area far away from the outlet of the film cooling hole, the M = 0.5 condition has the lowest spanwise average cooling efficiency at each flow direction position. As the blowing ratio increases, the spanwise average cooling efficiency at each flow direction position increases.
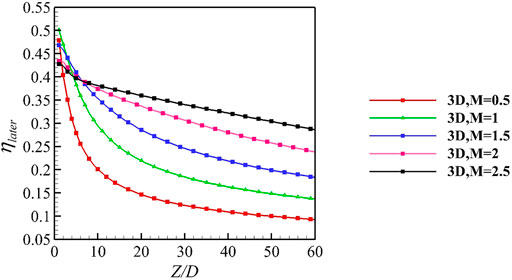
FIGURE 4. Spanwise average efficiency in C/L = 0.5 case.
As shown in Figure 5, when the blowing ratio is 0.5, there is a small area of high cooling efficiency at the outlet of the hole. In the downstream region, which is far away from the hole outlet, the cooling efficiency distribution degenerates to a unimodal distribution. When the blowing ratio increases to 1, the distribution of the high-efficiency zone at the hole outlet becomes a bimodal distribution, and this zone expands significantly in the flow direction. In the downstream region, the cooling efficiency also degrades to a unimodal distribution, but the cooling efficiency is higher than the cooling efficiency at the M = 0.5 condition in the same flow direction, consistent with the trend of cooling efficiency increase in each flow direction position as the blowing ratio increases from 0.5 to 1 in Figure 4. When the blowing ratio increases to 2, the distribution of cooling efficiency at the hole outlet is still bimodal, and the range is further expanded. In the downstream region, the cooling efficiency distribution does not degrade to a unimodal distribution but still maintains a bimodal distribution. However, even if the cooling efficiency distribution becomes a bimodal distribution, the high cooling efficiency area covers a wider area in both the flow direction and the spanwise direction than the M = 1.5 condition, indicating that the spanwise average cooling efficiency at the same flow direction is higher. When the blowing ratio is further increased to 2.5, the cooling efficiency distribution maintains a bimodal distribution, but the asymmetry becomes more obvious. In the downstream region, the cooling efficiency at the centerline decays faster along the flow direction compared to the M = 2 condition, and the green area with medium cooling efficiency appears closer to the upstream, so the cooling efficiency is lower.
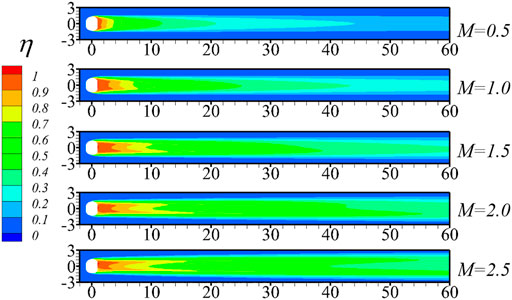
FIGURE 5. Adiabatic cooling effectiveness contour in C/L = 0.5 case.
The details of cooling air flow field are shown in Figure 6. According to the 3D streamline and the streamline of d–d plane in the hole, it is found that the adhesion ability of cooling air becomes worse with the increase in blowing ratio. At the same time, the velocity contour on the streamline shows the velocity of cooling air increase. As shown in Figure 6C, when the blowing ratio is 0.5, there is a small area with a larger X-direction vorticity at Y = ± 1D. The vorticity directions on both sides of the centerline are opposite. The two-dimensional streamline of the 2D behind the hole plane also shows the existence of vortices here, which are a pair of kidney-shaped vortices with opposite turns. For the convenience of description, they are recorded as vortex pair A. When the blowing ratio increases to 1.5, the area with high X-direction vorticity expands in the tangential direction, and the streamline entrainment scale expands in the tangential direction, reflecting the increase in the strength of vortex pair A. At the same time, a new pair of high X-direction vorticity regions are seen to appear on the upper outside of vortex pair A, but according to the distribution of the streamlines on the tangent plane, this new pair of high X-direction vorticity regions can be judged to be only a strong shear region. When the blowing ratio continues to increase, the high X direction vorticity region corresponding to vortex pair A continues to expand, mainly in the tangential direction. When the blowing ratio expands to 2.5, the high flow vorticity region corresponding to vortex pair A shrinks in the spanwise direction, and the X-direction vorticity near the wall region in the center surface decreases. At the same time, according to the two-dimensional streamline, there is a pair of small vortices in the region of Y = ± 0.3D, but on the one hand, the entrainment range is small; on the other hand, the X-direction vorticity is low. This is a pair of vortices induced by antisymmetric vortex pair A, recorded as vortex pair B. The separation of vortex pair B from the wall makes the fluid movement direction near the center surface change from upward to downward, which means that vortex pair B entrains the mainstream hot air toward the wall, which reduces the overall cooling efficiency.
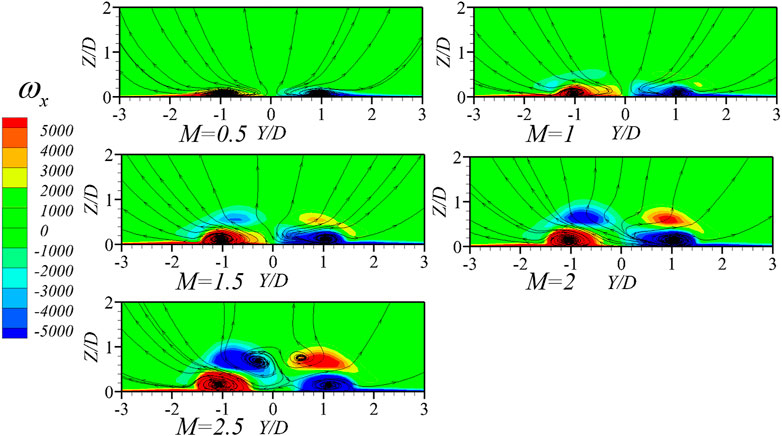
FIGURE 6. Details of cooling air in C/L = 0.5 case. (A) 3D streamlines of cooling air, (B) streamline and adiabatic cooling effectiveness contour at d–d plane, and (C) X-direction vorticity contour and streamline at X/D = 2 plane.
According to the X-direction vorticity contour on the spanwise plane at 30D behind the hole in Figure 7, compared to the M = 2 condition, the strength and range of vortex pair B in the M = 2.5 condition are larger, which makes the film cooling efficiency of the near centerline area in this working condition lower. However, when the blowing ratio is 2.5, vortex pair A not only has a larger range but also has a larger spanwise spacing. It corresponds to the downstream region in Figure 5; compared with M = 2, the two high cooling efficiency zones in the M = 2.5 condition have a larger width and a longer spanwise spacing. As a result, the film cooling efficiency here is higher.
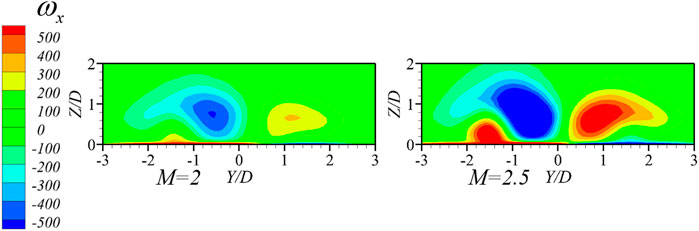
FIGURE 7. X-direction vorticity contour at X/D = 30 plane in C/L = 0.5 case.
When the blowing ratio is small, the overall average temperature difference of different C/L cases is small, but the flow field of cooling air in different C/L cases is quite different. The X-direction vorticity and streamline distribution on the spanwise plane at 2D behind the hole in the M = 0.5 condition are shown in Figure 8. When C/L is 0, there is a high X-direction vorticity area at Y = ± 1.2D, and the entrainment of the two-dimensional streamlines in the spanwise plane also shows that vortex pair A appears in this area. When C/L increases to 0.25, the high X-direction vorticity area at Y = ± 1.2D increases significantly, indicating that the strength and range of vortex pair A increase. At the same time, streamline entrainment is found at Y = ± 0.2D, but the entrainment range and flow direction vorticity are both small, indicating that vortex pair B exists in this area. When C/L is further increased, vortex pair A obviously converges to the center plane, especially when C/L increases to 0.5, and vortex pair A appears at Y = ± 0.9D. Vortex pair B, originally located in the center plane, basically disappears.
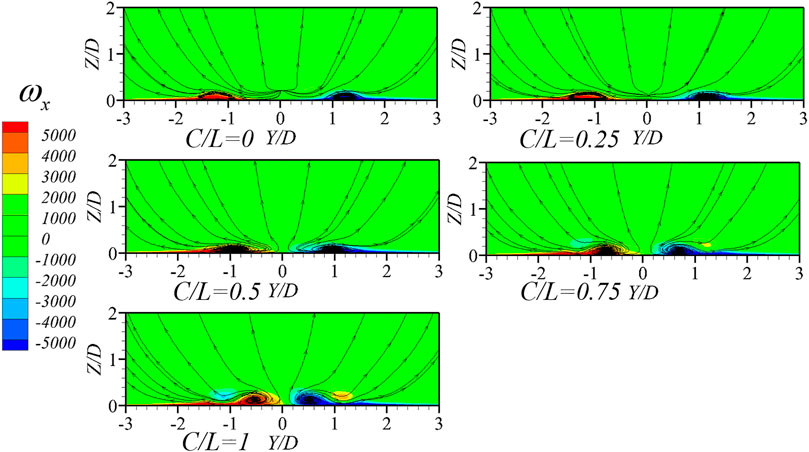
FIGURE 8. X-direction vorticity contour and streamline at X/D = 2 plane in M = 0.5 condition.
Due to the different strengths and positions of the vortex pairs in different C/L cases, the cooling efficiency distributions in different cases are also quite different, as shown in Figure 9. When the C/L is relatively small, the high-efficiency area near the hole outlet region and the medium-efficiency area (light green area) near 15D behind the hole region are both obvious bimodal modes. When the C/L increases to 0.5, a new high cooling efficiency region appears in the middle of the original spanwise-separated high-efficiency bimodal, and the whole presents a spanwise continuous distribution. The medium efficiency area near 15D behind the hole region also degenerates into a unimodal distribution due to the convergence of vortex pair A. When C/L is further increased to 1, the high cooling efficiency area near the hole outlet region also degenerates into a unimodal distribution, in line with the trend in Figure 8 that vortex pair A converges toward the center plane as C/L increases.
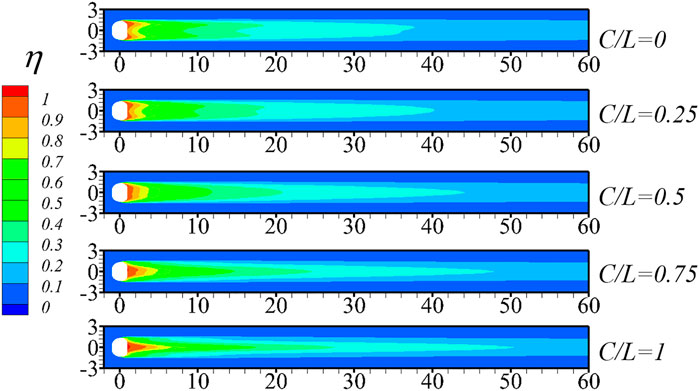
FIGURE 9. Adiabatic cooling effectiveness contour in M = 0.5 condition.
Under the M = 1.5 condition, the flow direction development of the spanwise average efficiency in different C/L cases is shown in Figure 10. On the whole, the spanwise average temperature of the three cases with C/L F0A3 0.5 has a small difference in each flow direction position, and the development trend along the flow direction is also consistent. When C/L is 0.75, the average spanwise efficiency first increases slightly and then decreases with increasing flow distance. The case with a C/L of 1 has the lowest average efficiency at each flow direction position, and the average efficiency drops rapidly from the hole outlet in the flow direction, then rises slightly, and then remains basically unchanged.
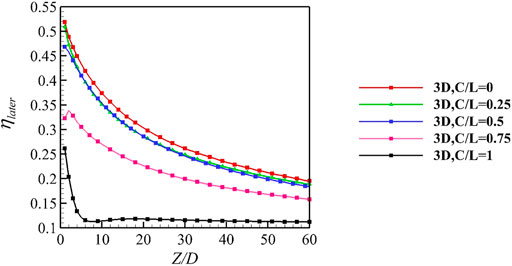
FIGURE 10. Spanwise average efficiency in M = 1.5 condition.
Specifically, when the blowing ratio is 1.5, the cooling efficiency contour for different C/L cases is shown in Figure 11. When C/L = 0, the high-efficiency area near the hole outlet region has an obvious bimodal mode, and the cooling efficiency still presents a bimodal distribution far from the hole outlet region. When the C/L ratio increases to 0.25, the cooling efficiency double peaks converge in the spanwise direction. Clearly, after 50D of the hole outlet, the original low efficiency area existing near the centerline in the C/L = 0 case disappears. However, at the same time, the cooling efficiency near Y = ± 3D is found to be lower than the cooling efficiency in the C/L = 0 case. When the C/L increases to 0.5, although the high-efficiency area near the hole outlet region still presents a bimodal distribution, the two high-efficiency peaks further converge. Especially in the area from the hole outlet to the 3D behind the hole, the two high-efficiency peaks converge into a continuous high cooling efficiency zone in the spanwise direction. In the downstream region, the cooling efficiency distribution degenerates to a unimodal distribution. When the C/L is further increased to 0.75, the overall cooling efficiency distribution is unimodal. The high cooling efficiency area near the hole outlet region covers only a small area close to the centerline in the spanwise direction and does not exist at the hole outlet in the flow direction. Overall, the distribution of high cooling efficiency area conforms to the trend in Figure 13 that the average efficiency increases at the outlet of the hole and then decreases downstream. When the C/L increases to 1, the high cooling efficiency area shrinks rapidly after the hole outlet. The area with an obvious cooling effect occupies only a width of approximately 2.5D in the spanwise direction, which is much smaller than other C/L cases. The width of this area is recovered after a slight contraction near 10D after the hole and is basically unchanged farther downstream, in line with the trend in Figure 10 that the average efficiency of the case is the lowest in all flow directions, and the average efficiency first drops rapidly, then rises slightly, and then remains basically unchanged.

FIGURE 11. Adiabatic cooling effectiveness contour in M = 1.5 condition.
Figure 12 shows the X-direction vorticity and streamline distribution on the spanwise plane at 2D behind the hole in the M = 1.5 condition. When C/L is 0, there is an area of high X-direction vorticity at Y = ± 1.4D, and the entrainment of the two-dimensional streamline in the spanwise plane also shows that vortex pair A appears here. At Y = ± 0.8D, which is closer to the center plane, a pair of high X-direction vorticity areas also appear at approximately 0.5D from the wall, accompanied by the entrainment of two-dimensional streamlines, which is vortex pair B. At the same time, the range of the high X-direction vorticity area and the scale of the streamline entrainment indicate that vortex pair B dominates more. When C/L increases to 0.25, the high X-direction vorticity region corresponding to vortex pair B is significantly reduced, and the streamline entrainment scale is also greatly reduced, indicating that the strength and range of vortex pair B is significantly reduced compared to the C/L = 0 case. This is the trend in the cooling efficiency contour, and the efficiency near the centerline of the case with a C/L of 0 is lower than the efficiency of the case with a C/L of 0.25.
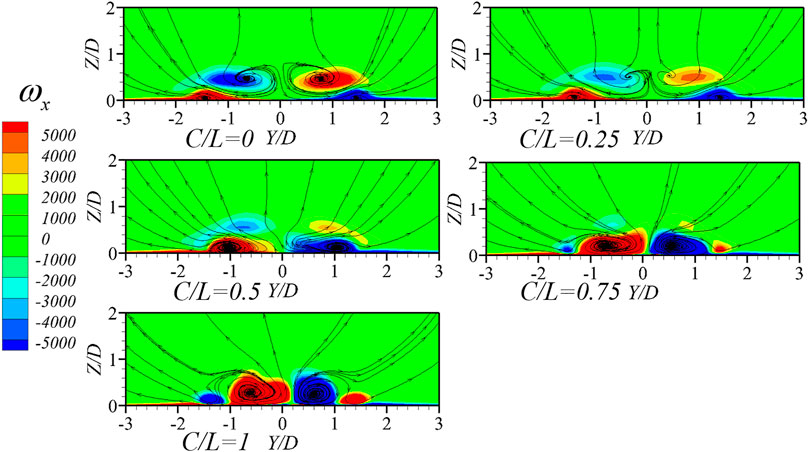
FIGURE 12. X-direction vorticity contour and streamline at X/D = 2 plane in M = 1.5 condition.
When C/L increases to 0.5, vortex pair A converges to Y = ± 1D in the spanwise direction. The direction of the streamlines in the near-wall areas on both sides of the centerline is changed upwards, and the mainstream air here is not entrapped and blown toward the wall, as in the small C/L case. The convergence of vortex pair A and the change in flow direction near the centerline explain the difference in the cooling efficiency contour between this case and the small C/L case. With a further increase in C/L, vortex pair A further converges to the centerline so that the high cooling efficiency at the hole outlet is further reduced in the spanwise direction. The high X direction vorticity area of vortex pair A converges in the spanwise direction and expands to 0.5D in the tangential direction, reflecting the increase in the injection momentum of the cooling air. A new high X-direction vorticity area appears outside the high X direction vorticity area of vortex pair A, which is defined as area C. When C/L further increases to 1, vortex pair A further converges to Y = ± 0.6D in the spanwise direction, and the corresponding high X-direction vorticity area expands to 0.7D in the tangential direction. At the same time, the outer high X-direction vorticity area C also converges, and the range is slightly enlarged, indicating that the entrapment effect to the outer mainstream is further enhanced, and the cooling efficiency is greatly reduced.
When the blowing ratio is 2.5, the flow direction development of the spanwise average efficiency in different C/L cases is shown in Figure 13. On the whole, the difference in spanwise average efficiency between the two cases with C/L = 0 and 0.25 is smaller in each flow direction, and the development trend along the flow direction is also consistent. In the C/L = 0.5 case, the spanwise average efficiency first rises slightly and then decreases with increasing flow direction distance, but the decline is relatively gentle. In contrast, the spanwise efficiency at 10D behind the hole and downstream region exceeds the C/L = 0 and 0.25 cases. In the cases with C/L ratios of 0.75 and 1, the spanwise average efficiency dropped rapidly from the hole outlet along the flow direction and then rebounded slightly, but the overall average efficiency was lower than that in the other cases.
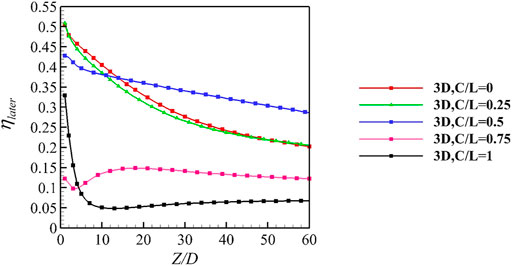
FIGURE 13. Spanwise average efficiency in M = 2.5 condition.
The cooling efficiency contours for different C/L cases at the M = 2.5 condition are shown in Figure 14. When C/L is 0, the cooling efficiency distribution near the hole outlet region and the downstream region are both obvious bimodal modes. When the C/L increases to 0.25, the high cooling efficiency area is still a bimodal distribution with a larger spacing, but the efficiency in the large spanwise width zone between the two cooling peaks in the downstream region is significantly reduced. Overall, cooling efficiency distribution conforms to the trend in Figure 13 that the spanwise averaged cooling efficiency of this case in the downstream region is slightly less than the spanwise averaged cooling efficiency of the C/L = 0 case. When C/L increases to 0.5, the bimodal high-efficiency area at the hole outlet converges into a spanwise continuous zone. In the region far away from the hole outlet, the two high cooling efficiency peaks are still discontinuous in the spanwise direction, but the spanwise separation between the two peaks is much smaller than the case with C/L ratios of 0 and 0.25. Therefore, the low cooling efficiency area between the two high cooling efficiency peaks is also smaller, which makes the spanwise average efficiency higher. When the C/L further increases to 0.75, the area with obvious cooling effect shrinks from the outlet in the spanwise direction and then slightly expands at 10D behind the hole, maintaining a unimodal distribution as a whole farther downstream and only occupying approximately 4D in the spanwise direction, conforming to the trend of average efficiency development along the flow direction in Figure 13. When C/L increases to 1, the high cooling efficiency area at the hole outlet is slightly expanded, but the area with an obvious cooling effect after 10D behind the hole is narrower in the spanwise direction, only occupying approximately 2.5D in the spanwise direction.
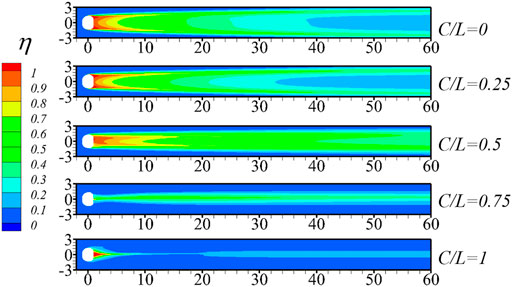
FIGURE 14. Adiabatic cooling effectiveness contour in M = 2.5 condition.
The X-direction vorticity and streamline distribution on the spanwise plane at 2D behind the hole in the M = 2.5 condition are shown in Figure 15. When C/L is 0, vortex pair A appears near the wall at Y = ± 1.6D. There is a vortex pair B at Y = ± 0.8D, which is farther from the wall. The range of the high X-direction vorticity area and the scale of the two-dimensional streamline entrainment indicate that vortex pair B dominates in this case. When C/L increases to 0.25, the high X-direction vorticity area corresponding to vortex pair B is found to be closer to the central plane, and the range is slightly expanded, just as shown in the cooling efficiency contour that the efficiency near the central plane is lower than C/L = 0 case. When C/L increases to 0.5, vortex pair A further converges to Y = ± 1D in the spanwise direction, while the scale of vortex pair B shrinks and is farther away from the wall. On the whole, conforming to the trend in the cooling efficiency contour, the two high cooling efficiency peaks converge into a spanwise continuous high cooling efficiency area. As C/L increases to 0.75, vortex pair A converges near the center plane, thereby changing the flow direction at the center plane so that the mainstream here will not be entrained to the wall. The expansion of the high X-direction vorticity area and the increase in the entrainment area of the streamline indicate that the range and strength of vortex pair A have been further increased so that its entrapment effect on the outer mainstream is also further increased so that the cooling efficiency of the outer region is reduced. When C/L increases to 1, the vortex at area C also further increases, which, in contrast, makes the entrainment range of vortex pair A mainstream decrease, which is in line with the trend of increasing cooling efficiency at this flow position.

FIGURE 15. X-direction vorticity contour and streamline at X/D = 2 plane in M = 2.5 condition.
The effect of different hole length ratios on cooling efficiency under different blowing ratios was studied by numerical methods. The following were observed.
1) As the blowing ratio increased from small (blow ratio = 0.5) to medium (blow ratio = 1.5), the overall average efficiency of most cylindrical part length/total length ratio cases increased; only in the case with a cylindrical part length/total length ratio of 1 did the overall average efficiency first increase and then decrease. When the blowing ratio was further increased to a larger condition (blow ratio = 2.5), the overall average efficiency continued to increase in only the case with a cylindrical part length/total length ratio of 0.5.
2) When the blowing ratio was small, the spanwise average efficiency of each cylindrical part length/total length ratio case was closer, but the flow structure and efficiency distribution were quite different. As the cylindrical part length/total length ratio increased, the antisymmetric kidney-shaped vortices converged toward the center plane, and the two high cooling efficiency regions at the hole outlet also converged toward the center plane. When the cylindrical part length/total length ratio reached 0.75, the kidney-shaped vortex pair basically converged to the center surface, and the high cooling efficiency area also degenerated into a unimodal distribution;
3) For the medium blowing ratio, the overall average efficiency of the small cylindrical part length/total length ratio case was higher, and the cooling efficiency decreased as the cylindrical part length/total length ratio increased. As the cylindrical part length/total length ratio increased to 0.5, the bimodal distribution separated in the spanwise direction near the hole outlet converged into a continuous bimodal distribution in the spanwise direction. When the cylindrical part length/total length ratio was further increased to 1, the cooling efficiency region basically converges into a spanwise narrow region;
4) For larger blowing ratio conditions, near the hole outlet region, the cooling efficiency of the small cylindrical part length/total length ratio case was higher. As the cylindrical part length/total length ratio increased, the efficiency decreased. When the cylindrical part length/total length ratio increased to 0.75, the cooling efficiency region basically converged into a spanwise narrow region. However, when the cylindrical part length/total length ratio increased to 1, the entrainment of the kidney-shaped vortex to the outer mainstream was restricted, and the average efficiency of the expansion rebounded slightly. After 10D after the hole outlet, the case with a cylindrical part length/total length of 0.5 is more efficient.
The raw data supporting the conclusions of this article will be made available by the authors, without undue reservation.
XZ is responsible for the overall guidance, RQ is responsible for the main calculation and analysis, and LC is responsible for the technical guidance.
The authors declare that the research was conducted in the absence of any commercial or financial relationships that could be construed as a potential conflict of interest.
All claims expressed in this article are solely those of the authors and do not necessarily represent those of their affiliated organizations, or those of the publisher, the editors, and the reviewers. Any product that may be evaluated in this article, or claim that may be made by its manufacturer, is not guaranteed or endorsed by the publisher.
The authors acknowledge the financial support provided by the National Science and Technology Major Project of China (2017-III-0009-0035).
C, cylindrical part length (mm); D, hole diameter (mm); L, total part length (mm); Lhole, hole length (mm); M, blowing ratio,
Baek, S. I., Ryu, J., and Ahn, J. (2021). Large Eddy Simulation of Film Cooling with Forward Expansion Hole: Comparative Study with LES and RANS Simulations. Energies 14, 2063. doi:10.3390/en14082063
Burd, S. W., Kaszeta, R. W., and Simon, T. W. (1998). Measurements in Film Cooling Flows: Hole L/D and Turbulence Intensity Effects.
Eberly, M. K., and Thole, K. A. (2014). Time-Resolved Film-Cooling Flows at High and Low Density Ratios. J. Turbomach. 136. doi:10.1115/1.4025574
El-Gabry, L. A., Thurman, D. R., Poinsatte, P. E., and Heidmann, J. D. (2013). Detailed Velocity and Turbulence Measurements in an Inclined Large-Scale Film Cooling Array. J. Turbomach. 135. doi:10.1115/1.4023347
Gritsch, M., Colban, W., Schär, H., and Döbbeling, K. (2005). Effect of Hole Geometry on the Thermal Performance of Fan-Shaped Film Cooling Holes. J. Turbomach. 127, 718–725. doi:10.1115/1.2019315
Haydt, S., Lynch, S., and Lewis, S. (2018). The Effect of Area Ratio Change via Increased Hole Length for Shaped Film Cooling Holes with Constant Expansion Angles. J. Turbomach. 140. doi:10.1115/1.4038871
Issakhanian, E., Elkins, C. J., and Eaton, J. K. (2016). Film Cooling Effectiveness Improvements Using a Nondiffusing Oval Hole. J. Turbomach. 138. doi:10.1115/1.4032045
Jeon, S., and Son, C. (2021). Comparative Numerical Study of the Influence of Film Hole Location of Ribbed Cooling Channel on Internal and External Heat Transfer. Energies 14, 4689. doi:10.3390/en14154689
Johnson, B., Tian, W., Zhang, K., and Hu, H. (2014). An Experimental Study of Density Ratio Effects on the Film Cooling Injection from Discrete Holes by Using PIV and PSP Techniques. Int. J. Heat Mass Transfer 76, 337–349. doi:10.1016/j.ijheatmasstransfer.2014.04.028
Kim, Y. S., Jeong, J. Y., Kwak, J. S., and Chung, H. (2021). The Effects of Hole Arrangement and Density Ratio on the Heat Transfer Coefficient Augmentation of Fan-Shaped Film Cooling Holes. Energies 14, 186. doi:10.3390/en14010186
Laroche, E., Donjat, D., and Reulet, P. (2021). A Combined Experimental and Numerical Characterization of the Flowfield and Heat Transfer Around a Multiperforated Plate with Compound Angle Injection. Energies 14. doi:10.3390/en14030613
Lee, K.-D., and Kim, K.-Y. (2012). Performance Evaluation of a Novel Film-Cooling Hole. J. Heat Transfer 134. doi:10.1115/1.4006752
Lee, S. I., Jung, J. Y., Song, Y. J., and Kwak, J. S. (2021). Effect of Mainstream Velocity on the Optimization of a Fan-Shaped Film-Cooling Hole on a Flat Plate. Energies 14, 3573. doi:10.3390/en14123573
Li, X., Qin, Y., Ren, J., and Jiang, H. (2014). Algebraic Anisotropic Turbulence Modeling of Compound Angled Film Cooling Validated by Particle Image Velocimetry and Pressure Sensitive Paint Measurements. J. Heat Transfer 136. doi:10.1115/1.4025411
Liu, C.-L., Liu, J.-L., Zhu, H.-R., Wu, A.-s., He, Y.-H., and Zhou, Z.-X. (2015). Film Cooling Sensitivity of Laidback Fanshape Holes to Variations in Exit Configuration and Mainstream Turbulence Intensity. Int. J. Heat Mass Transfer 89, 1141–1154. doi:10.1016/j.ijheatmasstransfer.2015.06.019
Luo, S., Miao, Z., Liu, J., Song, J., Xi, W., and Liu, C. (2021). Effects of Coolants of Double Layer Transpiration Cooling System in the Leading Edge of a Hypersonic Vehicle. Front. Energ. Res. 9. doi:10.3389/fenrg.2021.756820
Lutum, E., and Johnson, B. V. (1999). Influence of the Hole Length-To-Diameter Ratio on Film Cooling with Cylindrical Holes.
Ragab, R., and Wang, T. (2018a). An Experimental Study of Mist/Air Film Cooling with Fan-Shaped Holes on an Extended Flat Plate—Part 1: Heat Transfer. J. Heat Transfer 140. doi:10.1115/1.4037641
Ragab, R., and Wang, T. (2018b). An Experimental Study of Mist/Air Film Cooling with Fan-Shaped Holes on an Extended Flat Plate—Part II: Two-phase Flow Measurements and Droplet Dynamics. J. Heat Transfer 140. doi:10.1115/1.4037642
Rogers, N., Ren, Z., Buzzard, W., Sweeney, B., Tinker, N., Ligrani, P., et al. (2017). Effects of Double Wall Cooling Configuration and Conditions on Performance of Full-Coverage Effusion Cooling. J. Turbomach. 139. doi:10.1115/1.4035277
Saumweber, C., and Schulz, A. (2012). Effect of Geometry Variations on the Cooling Performance of Fan-Shaped Cooling Holes. J. Turbomach. 134. doi:10.1115/1.4006290
Saumweber, C., Schulz, A., and Wittig, S. (2003). Free-stream Turbulence Effects on Film Cooling with Shaped Holes. J. Turbomach. 125, 65–73. doi:10.1115/1.1515336
Tian, K., Tang, Z., Wang, J., Vujanović, M., Zeng, M., and Wang, Q. (2021). Numerical Investigations of Film Cooling and Particle Impact on the Blade Leading Edge. Energies 14, 1102. doi:10.3390/en14041102
Keywords: film cooling effectiveness, fan-shaped hole, adiabatic effectiveness, heat transfer characteristics, kidney-type vortices
Citation: Zhou X, Qin R and Cai L (2021) Research on the Hole Length Ratio of Fan-Shaped Holes in Flat Plate Film Cooling. Front. Energy Res. 9:784654. doi: 10.3389/fenrg.2021.784654
Received: 28 September 2021; Accepted: 21 October 2021;
Published: 16 November 2021.
Edited by:
Xiao Liu, Harbin Engineering University, ChinaReviewed by:
Jingjun Zhong, Shanghai Maritime University, ChinaCopyright © 2021 Zhou, Qin and Cai. This is an open-access article distributed under the terms of the Creative Commons Attribution License (CC BY). The use, distribution or reproduction in other forums is permitted, provided the original author(s) and the copyright owner(s) are credited and that the original publication in this journal is cited, in accordance with accepted academic practice. No use, distribution or reproduction is permitted which does not comply with these terms.
*Correspondence: Xun Zhou, emhvdXh1bkBoaXQuZWR1LmNu
Disclaimer: All claims expressed in this article are solely those of the authors and do not necessarily represent those of their affiliated organizations, or those of the publisher, the editors and the reviewers. Any product that may be evaluated in this article or claim that may be made by its manufacturer is not guaranteed or endorsed by the publisher.
Research integrity at Frontiers
Learn more about the work of our research integrity team to safeguard the quality of each article we publish.