 Chengyu Li
 Yanbing Zhang
 Saurabh Pratap2
94% of researchers rate our articles as excellent or good
Learn more about the work of our research integrity team to safeguard the quality of each article we publish.
Find out more
ORIGINAL RESEARCH article
Front. Energy Res. , 12 January 2022
Sec. Smart Grids
Volume 9 - 2021 | https://doi.org/10.3389/fenrg.2021.783786
The 2060 carbon neutral target reflects the long-term equilibrium and stability of production activities and the natural environment. As an important part of Chinese energy structure, the operation and transformation of power enterprises will face higher requirements. Although the rapid development of smart grids provides necessary technical support for power enterprises to build a modern energy system with green power as the core, whether power enterprises can use smart grids to improve their operating performance and environmental performance has yet to be discussed. The differences caused by the heterogeneity of property rights will also have an impact on the green transformation and development of enterprises. This paper selects 25 Chinese power enterprises as the research objects and uses the 2011–2019 enterprise panel data and the data envelopment analysis model to evaluate the operating performance and environmental performance of power enterprises. The results show that the overall fluctuation trend of the total factor productivity index and green total factor productivity index of power enterprises are W-shaped, and technological progress is the main driving force for the improvement of power operating performance and environmental performance; Compared with enterprises with a single power generation method, enterprises with diversified power generation methods performed better in their overall total factor productivity index. After that, text mining and machine learning methods are used to classify the text of the enterprise’s annual report to determine whether the enterprise applies smart grid technology for production and operation activities. Finally, using feasible generalized least squares method (FLGS) and dynamic panel system generalized moment estimation (SYS-GMM) to analyze the impact of smart grid on the operating performance and environmental performance of power enterprises, and the nature of corporate property rights in this process. It is found that smart grids can improve the operating performance and environmental performance of power enterprises; compared with state-owned enterprises, non-state-owned enterprises can achieve better performance in the application of smart grids to improve operating performance and environmental performance. Finally, this study provides corresponding policy recommendations for power enterprises to achieve performance improvement and green transformation development.
The 2021 Chinese government work report first proposed the goal of “carbon peak and carbon neutrality”. In November of the same year, China and the United States issued the “The Glasgow Joint Declaration of the U.S. and China on Strengthening Climate Action in the 2020s”, series of events marked that China is entering a critical period of green transformation and development. However, China's energy structure has always been highly dependent on coal. The power sector accounts for a relatively high proportion of thermal power generation, and clean energy power generation methods have problems of indirectness and instability. If China wants to realize the energy transition, it is by no means simply expanding the scale of renewable energy production or paying too much attention to renewable energy and pursuing a “crippled” energy transition. Instead, it should improve the efficiency of existing installed equipment, equip new energy power generation facilities with appropriate flexible power reserve capacity, and rely on advanced digital technology to improve the overall operating efficiency of the power system. The smart grid integrates big data, Internet of Things, 5G and other digital technologies, and realizes high-quality development of China's energy through the application of scientific and technological achievements such as advanced sensor technology and measurement technology. It not only has strong self-healing ability and reliability, but also can realize the efficient use of power system equipment resources through digital technology and the coordination and cooperation among the power generation, transmission, distribution, and use parties to improve the power system energy utilization efficiency and power supply stability.
However, there are currently three main reasons why Chinese power enterprises have failed to widely apply smart grids: First, the technological level is backward. Compared with European countries, China's smart grid-related technology research started relatively late, and it is difficult for power enterprises to effectively deal with the “information explosion” caused by smart grids, resulting in a reduction in the overall operating efficiency of the power system; second, the cost of transformation is higher. The power generation method of Chinese power enterprises is mainly thermal power generation. In 2021, China's total installed coal power capacity will account for more than 50% of the world. Power enterprises need to upgrade and replace the original equipment to apply smart grids; third, infrastructure and supervision system and policy incentives were not in place. The government mainly adjusts the production and operation methods of electric power enterprises through the introduction of corresponding policies, and lacks the necessary government investment to create a good external environment for enterprises and help them to carry out green transformation and development. These reasons have increased the investment risk of smart grid projects of power enterprises, making their green transformation and development process full of uncertainty.
As the Chinese market system is not mature enough, making enterprise operations vulnerable to government intervention. To achieve carbon neutrality target as soon as possible, China not only actively advocates green transformation and development of enterprises but also introduces relevant policies to adjust the business model of enterprises. There is monopolistic competition in the power industry, and enterprises with “leader” status in the industry have the ability to build smart grid basic networks, tackle core technical problems, and maintain market share in traditional power generation models. “Leader” power enterprises, mainly state-owned enterprises, have played a key role in the promotion of smart grids. Compared with non-state-owned enterprises, state-owned enterprises need to undertake more social and environmental protection responsibilities. Although they can obtain government subsidies and financing from financial institutions, state-owned enterprises have low marketization, low decision-making efficiency, and poor operating efficiency. Compared with state-owned enterprises, non-state-owned enterprises have better resource allocation capabilities and stronger market sensitivity, but they also face greater market pressure and environmental protection regulatory pressure. The vast majority of non-state-owned enterprises are small in scale and short in development cycles, and are prone to problems such as financing difficulties and weak corporate culture. The adjustment mechanism of the smart grid for the green transformation of power enterprises can be roughly divided into three realistic paths: emission reduction mechanism, market mechanism, and property rights mechanism.
It can be seen from Figure 1 that “Leader” electric enterprises can improve energy efficiency by building smart grids and adjust the proportion of power production capacity to achieve energy-conservation and emission-reduction. However, the impact of these on electricity market prices is still uncertain (indicated by the dotted line). Therefore, the government needs to provide appropriate subsidies to the “leader” of power enterprises. Regardless of whether it is a “leader” electric enterprise or an ordinary electric enterprise, they are faced with the uncertainty challenge of corporate shareholders to change the current profit situation and large-scale investment risks. Therefore, it will trigger the adjustment of the corporate property structure. In the process of green transformation of enterprises applying smart grids, different types of enterprises have different advantages and disadvantages. These will have an impact on the green transformation and upgrading of electric power enterprises, especially the “leader” electric enterprises in the smart grid. “Leader” electricity enterprises have the first advantage in the construction of smart grids, and may benefit themselves through technical standards and market advantages. In addition, the “leader” electricity enterprises may make their own optimal choice between energy conservation and emission reduction and corporate benefits based on the consideration of maximizing their own benefits, rather than the overall optimal choice. Therefore, it is necessary to strengthen the role of policy tools to avoid the “leader” trap.
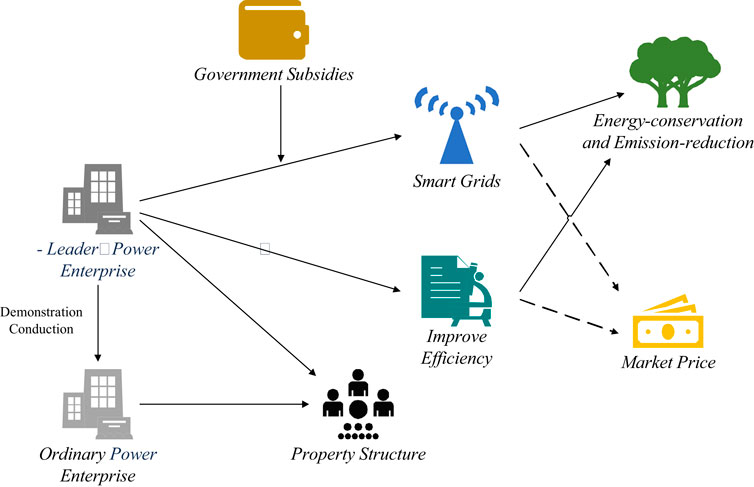
FIGURE 1. Green transformation path mechanism of power enterprises considering smart grid.
The possible marginal contributions of this paper are as follows: First, including the enterprise’s power generation and sales in the evaluation process, comprehensively evaluate its total factor productivity and green total factor productivity, and decompose these to further analyze the driving force for the improvement of operating performance and environmental performance; second, using text analysis methods to analyze the annual reports of electric power enterprises to determine whether enterprises use smart grids and use machine learning methods to test the accuracy of the text analysis results; third, using feasible generalized least squares (FLGS) and dynamic panel systems Generalized Moment Estimation (SYS-GMM) analyzes in detail the feasibility of enterprises using smart grids to achieve green transformation; fourth, considering the role of corporate property rights in the process of improving operating performance and environmental performance of smart grids. The following chapters are arranged as follows: The second part is the mechanism discussion and theoretical assumptions; the third part uses the Malmquist index model and the Malmquist-Luenberger index model to evaluate the total factor productivity and green total factor productivity of power enterprises; the fourth part is based on the text analysis results Construct relevant variables, use feasible Generalized Least Squares (FLGS) and Dynamic Panel System Generalized Moment Estimation (SYS-GMM) to analyze the impact of smart grids on power enterprises’ total factor productivity and green total factor productivity, and the nature of corporate property rights in the process of green transformation; the fifth part is the conclusions; the sixth part is the policy recommendations; the seventh part is limitations and future research opportunities.
Although urbanization can promote the rapid development of the regional economy, it will also stimulate the continuous increase of electricity consumption in the region (Ali et al., 2020). Especially for those regions that rely heavily on energy-intensive industries, when they are in a stage of rapid development, the contradiction between their ever-increasing power demand and limited power supply becomes more prominent (Mehmet et al., 2019). Technological innovation is seen as the key to alleviating the conflict between the two and achieving sustainable and high-quality development. From a macro perspective, technological innovation can promote clean energy development, improve regional energy efficiency and environmental performance, and have a positive impact on the improvement of energy efficiency in surrounding areas (Sun et al., 2021). From a micro perspective, the government can optimize the regional industrial structure by formulating technology-intensive policies, vigorously develop innovative and environmentally-friendly industries (Sun et al., 2020). In order to achieve the goal of carbon neutrality, enterprises can reduce environmental pollution through green innovation activities, and at the same time rely on innovation results to improve their energy production and operating performance. The traditional school-based on strict cost-benefit analysis believes that corporate green innovation activities not only cannot offset their internalized costs but also occupy limited financial resources of the enterprise (Preston and O’Bannon, 1997). The purpose of green innovation activities carried out by enterprises is to fulfill their social responsibilities and improve their social image, but their operating performance cannot be significantly improved (King and Lenox, 2002). However, the revisionist school believes that green innovation activities can improve its competitive advantage and operating performance (Guo et al., 2017). The research-based on the basic view of natural resources and the view of capability believes that the green innovation activities can not only obtain the three key strategic capabilities of pollution prevention, product management, and sustainable development but also improve their innovation capabilities, Staff learning ability and practical ability (Triguero-Cano and Córcoles, 2014). According to the stakeholder theory, green innovation activities can meet the requirements of stakeholders for environmental governance, maintain long-term cooperative relationships between enterprises, investors and customers, and reduce market risks and financing costs (Hu et al., 2017).
As an important result of corporate green innovation activities, smart grids are widely discussed by scholars as to whether they can promote power enterprises to improve their operating performance. Related research can be divided into two categories. The first type of research mainly analyzes the optimization effect of smart grid real-time pricing on the traditional power system from the perspective of the supply side and the demand side. From the perspective of the supply side, the application of smart grids can reduce battery consumption, reduce battery usage costs and improve the overall operating efficiency of the power system (Anees et al., 2021). From a demand-side perspective, compared with traditional fixed pricing, smart grid real-time pricing can stimulate consumers’ demand for electricity purchases (Yd and Pei, 2020). An effective time-of-use electricity pricing plan can also reduce the price and the difference between real-time prices reduces consumer terminal consumption costs (Aditya et al., 2018).
The second type of research mainly explores the role of smart grids in promoting the development of the electric vehicle industry from a micro and macro perspective. From a micro perspective, the contractual agreement between electric vehicle owners and smart grids can bring benefits to operators and owners based on reducing expected costs (Wolinetz et al., 2018). From a macro perspective, photovoltaic and hydropower grid-connected smart microgrids can not only stabilize electric vehicle power demand while reducing grid power loss, but also alleviate the impact of electricity demand on the construction and dispatch of regional power grids caused by the rapid development of the electric vehicle market (Kong et al., 2017; Mem et al., 2021).
With the continuous development of research on the impact of green innovation on operating performance, more and more scholars have begun to affirm the positive role of corporate green innovation activities in improving operating performance. The application of the smart grid by electric power enterprises can not only improve their operating performance by saving costs and stimulating consumption but also can drive the rapid development of related industries such as the electric vehicle industry. Scholars have verified the role of smart grids in improving the operating performance of power enterprises Positive effect.
Green transformation and development are the general trend, but the strategy and profitability of “leader” electric enterprises and ordinary electric enterprises on whether to adopt smart grids are different. Table 1 shows a simple income matrix of different types of power enterprises’ choice of power generation methods.
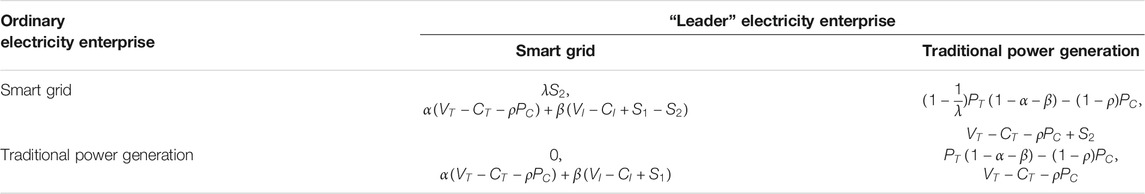
TABLE 1. “Leader” power enterprises and general power enterprises’ strategic choices.
When the “leader” electric enterprise chooses not to build the smart grid strategy, its revenue is composed of revenue
Hypothesis 1: Smart grid and operating performance are positively correlated.
Excessive dependence on fossil energy will cause the carbon emissions of the economy to continue to rise during the rapid development of the economy, and its economic development will also be significantly affected by energy price fluctuations (Samu et al., 2019; Bekun and Agboola, 2019). Although globalization can inhibit carbon dioxide emissions, from a long-term perspective, the government needs to adjust the production and operation modes of enterprises by formulating energy and environmental policies to ease the pressure on the environment caused by fossil energy consumption and economic growth (Saint Akadiri et al., 2020). Green innovation activities can help enterprises improve their environmental performance, and the research on their impact on environmental performance can be discussed from two aspects: green product innovation and green process innovation. As enterprises pay more and more attention to sustainable development and innovation capabilities, green product innovation has occupied an important position in the enterprise’s long-term development strategy (Dangelico and Puari, 2010). It can improve product performance by adjusting product production materials, changing product design schemes, etc., and reduce the negative impact of enterprise production activities on the environment (Rave, Goetzke and Larch, 2011). Green process innovation can be subdivided into cleaner production technology and end treatment technology (Xie et al., 2016). Cleaner production technology refers to the control of pollutant production and discharges from the source, while end treatment technology focuses on the conversion of existing pollutants into other substances that are easy to handle, and the recycling of existing products. Through green process innovation, enterprises can not only reduce pollutant emissions to meet government environmental protection requirements, but also reduce production costs, improve production efficiency and resource utilization (Xie et al., 2016; Huang and Li, 2017).
Smart grid, as an important result of green process innovation, can help power enterprises widely apply clean energy power generation to promote China's energy structure adjustment and reduce the negative impact of power production activities on the environment. The research on smart grids on the environmental performance of enterprises is mainly divided into two categories. The first type of scholars mainly focuses on the positive impact of smart grids on the environmental performance of enterprises. The demand response mechanism existing in the smart distribution network can achieve low-carbon benefits on the generation side, the distribution side and the demand side, (Zhou et al., 2013). This mechanism can help enterprises learn more about users’ energy consumption and improve the operating efficiency of the power system (Yan et al., 2015). The society and government departments combine environmental protection concepts with digital technology and are committed to the development of smart grids by adjusting energy policies to promote the construction of “smart energy cities” (Cominola et al., 2021).
The second type of research analyzes the difficulties faced by enterprises in the process of applying smart grids. From the perspective of internal operation, due to the shortcomings of the traditional power system in energy distribution, transaction and management, it is difficult for the new energy supply model of smart grid to operate normally. From the external environment, low coverage of digital infrastructure, shortage of high-tech talents, and imperfect rules and regulations will hinder the advancement of smart grid projects (Onyei-Nwogu et al., 2020). Moreover, Chinese resource endowment of “rich coal, poor oil, and less gas” will reduce the impact of emerging technologies such as smart grids and clean energy power generation on the coal industry, making it difficult for China to reduce its dependence on coal resources in the short term (Zhang and Duan, 2020).
The green innovation activities of enterprises can improve their environmental performance, help them better fulfill their social responsibilities, and establish a good external image. Although limitations in technology, management methods, and the external environment have hindered power enterprises from adopting smart grids extensively, scholars still affirmed the positive role of smart grids in helping enterprises improve their environmental performance.
Taking into account the different income functions of electric power enterprises,
Let
Because
Hypothesis 2: Smart grid and environmental performance are positively correlated.
The impact of the nature of corporate property rights on the development of green transformation can be discussed from two perspectives. From the perspective of the resource base, the high internal value, scarcity, and inimitable resources of enterprises can give them stronger competitive advantages. State-owned enterprises not only have resource advantages such as technology and capital, but can also obtain support from local governments, and can achieve green transformation and upgrading in a short period (Qu and Richard, 2018). However, some scholars believe that the resource advantages of state-owned enterprises, such as resource endowments and credit preferences, will provide them with a loose market environment, leading to strategic rent-seeking of state-owned enterprises and reducing their enthusiasm for green transformation and development (Jiang et al., 2020). As non-state-owned enterprises do not have resource advantages, they will actively carry out green innovations to get rid of financial difficulties during performance deficits. Non-state-owned enterprises have efficient internal incentives and competition mechanisms, which can better reflect the cost-reduction and efficiency-increasing effects of green management on innovation activities.
From the perspective of stakeholders, the government, as the main leader of state-owned enterprises, can influence the development strategy of enterprises. According to the theory of political championships, local officials and state-owned enterprise executives will pay more attention to environmental performance to achieve political promotion, and the political connection between state-owned enterprises and local governments can also help them achieve good green performance (Min et al., 2015). Some scholars believe that the relationship between state-owned enterprises and the government will lead them to make larger-scale environmental protection investments, the purpose of which is to bear external burdens rather than to improve the efficiency of enterprise input and output (Zhenbing et al., 2021). Due to the weak political connection between non-state-owned enterprises and the government, they will be under greater pressure when facing environmental protection supervision, which will strengthen the positive relationship between corporate green transformation and innovation performance (Hoffmann and Pfeil, 2018). In addition, the issue of entrusting non-state-owned enterprises is relatively simple. The self-interest of executives is closely related to the operating conditions of the enterprise, and executives are more sensitive to changes in performance caused by innovation premiums and innovation risks (Cl et al., 2020).
The resource advantages of state-owned enterprises may reduce the sensitivity of corporate executives to performance changes, while the internal conditions and external environment of non-state-owned enterprises will stimulate them to be more enthusiastic about green transformation and upgrading. There are complex principal-agent and operational management issues in state-owned enterprises, which are not conducive to the effective application of smart grid technology. The efficient internal incentive and competition mechanism of non-state-owned enterprises will improve their production efficiency and market performance. Therefore, this paper assumes:
Hypothesis 3: Compared with non-state-owned enterprises, state-owned enterprises have poorer operating performance when applying smart grids.
Hypothesis 4: Compared with non-state-owned enterprises, state-owned enterprises have poorer environmental performance when applying smart grids.
In order to evaluate the green transformation of electric power enterprises, this paper uses the Malmquist index model and the Malmquist-Luenberger index model to evaluate the operating performance and environmental performance of power enterprises. Since power generation is used not only for sales, but also for its own production and operation, the amount of electricity generated is usually greater than the amount of electricity sold. In order to more accurately measure the operating performance and environmental performance of power enterprises, this paper incorporates both power generation and sales into the evaluation system. This paper selects power generation, net fixed assets, and electricity business operating cost as input variables selects electricity sales and electricity business operating income as expected output variables and selects the carbon emissions generated in the power production process as undesired variables for evaluation. Although there are 76 power enterprises in China, several enterprises are in ST status, and 15 power enterprises have data missing and purchased electricity. If considering the purchase of electricity, the research content will be too complicated and the research standards cannot be unified. Therefore, it was removed during the research process. This paper selects 25 electric power enterprises with qualified data as the research objects and evaluates their performance changes by using relevant data from 2010 to 2019. The relevant data come from the annual reports published by various enterprises.
Since power enterprises have not announced the carbon emissions generated during their power production process, this paper is based on the standards required by power enterprises for power generation in the “National Electricity Statistics” published by the National Energy Administration every year. The coal is estimated, and then the standard coal is converted into raw coal according to the conversion factor of 0.7143 between raw coal and standard coal. Estimating the carbon emissions of electric power enterprises through the reference methods and parameters provided in the “2006 IPCC National Greenhouse Gas Inventory Guidelines 2019 Revised Edition”, combined with relevant parameters that have been published in China. The specific formula is:
Where C represents carbon emissions, in units of billion tons; E represents raw coal consumption, in units of billion tons; NCV is the average low calorific value, that is the conversion factor, in units of kilooules/billion tons; CC is carbon content, which represents unit heat The carbon content of the unit is billion tons/106 kilooules; COF represents the carbon oxidation factor, that is, the carbon oxidation rate when energy is burned, and the value is 100% when the ideal state is completely oxidized; 44 and 12 are the molecular weights of CO2 and C, respectively. Defined
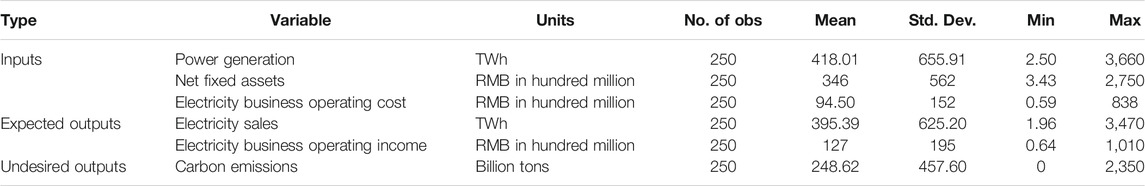
TABLE 2. Description statistics of the variables.
In this paper, 25 electric power enterprises are used as decision-making units (DMU) to evaluate operating performance and environmental performance. Based on the relevant input-output panel data from 2010 to 2019, the Malmquist index model and the Malmquist-Luenberger index model with variable returns to scale are used. MAXDEA software measures the total factor productivity index (M), comprehensive technical efficiency index (EC), technological progress efficiency index (TC), green total factor productivity index (GML), green comprehensive technical efficiency index (GMLEC), and green technical progress efficiency Index (GMLTC). Experimental results of the Malmquist index model and the Malmquist-Luenberger index model reflect that the decision-making unit’s performance evaluation total factor productivity and its decomposition represent a dynamic process. For the convenience of expression in the following table, the last year of the adjacent year indicates the adjacent period, such as 2010–2011 abbreviated as 2011. The specific calculation results of the total factor productivity index (M) and the green total factor productivity index (GML) are shown in Table 3.
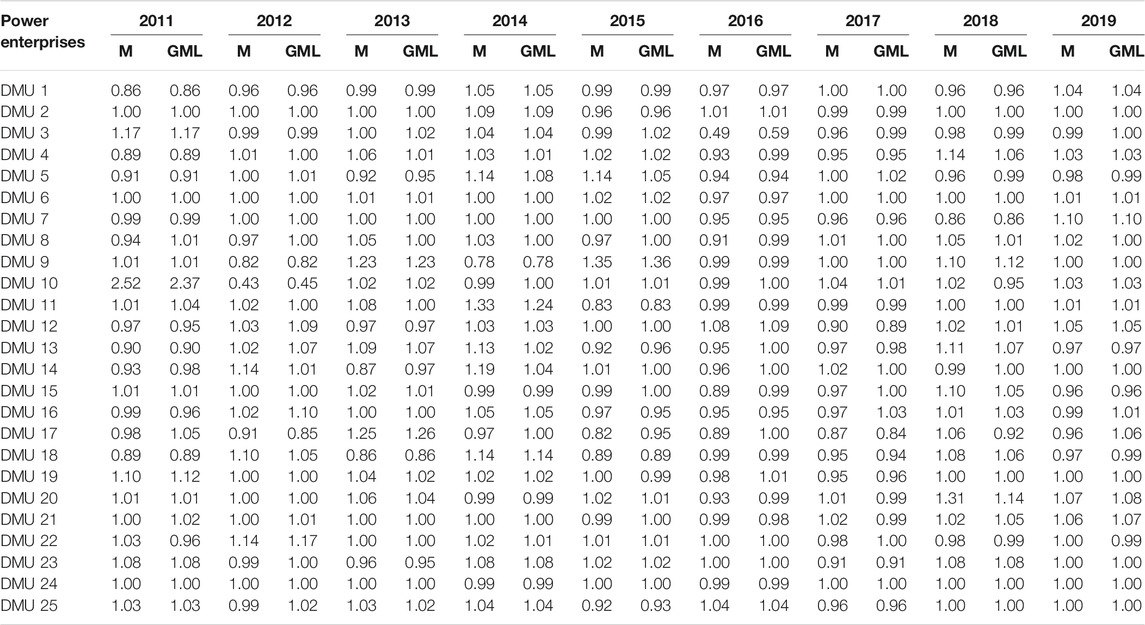
TABLE 3. 2011–2019 Evolvement trend of M index and GML index.
As can be seen from Table 3, the overall fluctuation trend of the total factor productivity index and the green total factor productivity index of the 25 power enterprises from 2011 to 2019 was W-shaped. The index declined from 2011 to 2012, and then began to rise, reached its highest in 2014; from 2014 to 2017, the index showed a cliff-like decline, then began to rise and stabilized at about 1, the average total factor productivity index and the green total factor productivity index was close to 1. Figure 2 shows the overall experimental results of the operating performance and environmental performance of 25 power enterprises. It can be seen from the figure that the comprehensive technical efficiency index and the green comprehensive technical efficiency index did not fluctuate significantly during the inspection period. In contrast, the technical progress efficiency index and the green technology progress efficiency index fluctuate significantly, and the fluctuation trend is close to the fluctuation trend of the total factor productivity index and the green total factor productivity index. This indicates that the changes in the total factor productivity index and the green total factor productivity index during the inspection period are mainly dominated by the technological progress efficiency index and the green technological progress efficiency index. It can also be found from Table 3 and Figure 2 that the green total factor productivity index obtained by incorporating the undesired output into the input-output model is significantly lower than the total factor productivity index, indicating that the gap between the efficiency values of each decision-making unit has been reduced after considering the undesired output.
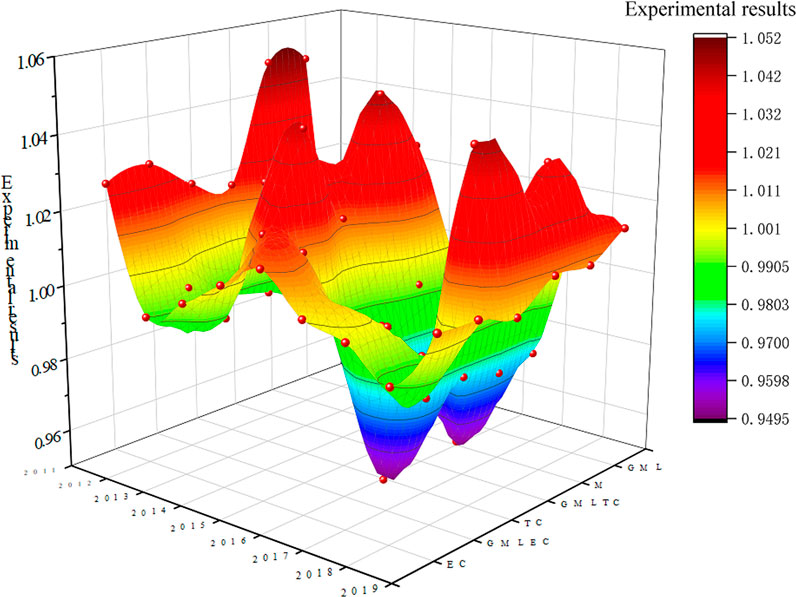
FIGURE 2. Overall experimental results of the total factor productivity index and the green total factor productivity index.
Figure 3 shows the power generation of 25 power enterprises in 2019. It can be seen that the amount of electricity generated by thermal power generation is the highest, accounting for 73.88%, followed by hydropower, wind power, and photovoltaic power generation. Although there are 11 enterprises with diversified power generation structures, their power generation structures all include thermal power generation, and the amount of power generated by thermal power generation accounts for a relatively high proportion. This shows that although power enterprises adopt multiple power generation methods, their electricity sales revenue mainly comes from thermal power generation. According to Figure 3, 25 power enterprises can be divided into four groups, namely thermal power generation group, wind power generation group, hydroelectric power generation group, and hybrid power generation group. It can be seen from Table 3 and Figure 3 that the performance of all indexes of the hybrid power generation group is better than the other three groups. This indicats that the thermal power generation enterprise not only fails to achieve the best performance but also causes damage to the environment during the production process; although hydropower and wind power generation enterprises will not cause damage to the environment, their limited technical level prevents them from achieving stable performance. It can be seen from Table 3 and Figure 3 that compared with the other three groups, the performance of wind power generation has the most significant fluctuations, while hybrid power generation is the most stable; by comparing the performance of wind power generation, hydropower generation, thermal power generation, and hybrid power generation, it can be seen that the fluctuation trends of thermal power generation and hybrid power generation are relatively close. In addition, the operating performance of the thermal power generation group and the hybrid power generation group has a little gap with the environmental performance, while the environmental performance of the wind power generation group and the hydropower generation group is higher than the operating performance. It shows that after considering undesired output, the performance gap between power enterprises that focus on clean energy power generation and power enterprises that focus on fossil energy power generation is gradually decreasing.
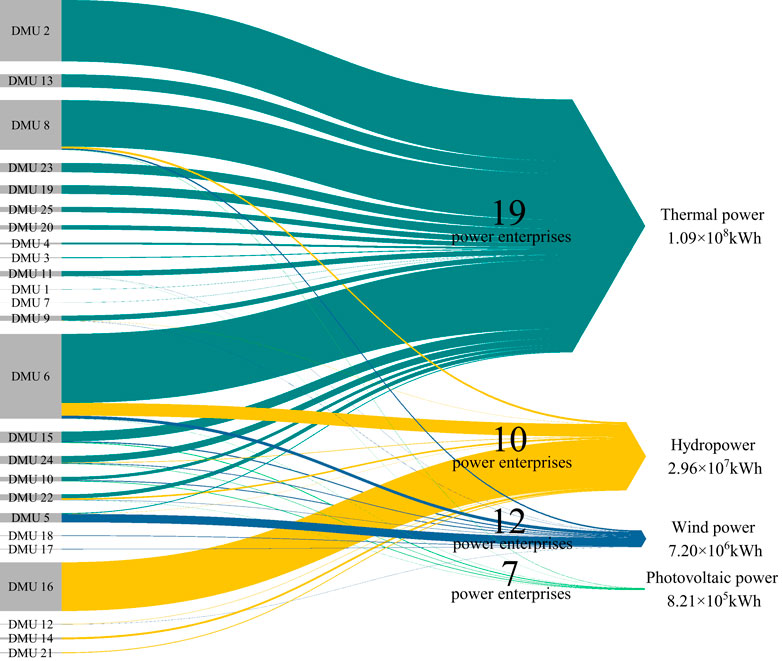
FIGURE 3. Power generation capacity of power enterprises in 2019.
This paper uses qualitative analysis methods to explore the impact of smart grid R&D and application on the environmental performance and operating performance of power enterprises, and the role of corporate property rights in the green transformation process. Many scholars used text analysis methods to qualitatively analyze the production and operation activities of enterprises. The types of texts they rely on being mainly two types. The first type of research mainly analyzes information contained in corporate announcements. The corporate announcement not only covers important information such as the research direction, research and development efforts, and innovation results of the enterprise’s technological innovation activities (Palmer and Truong, 2017), but also contains details of the enterprise’s application of advanced digital technology for production and operation activities (Pan et al., 2020). The second type of research mainly analyzes the information contained in the enterprise’s annual report and sustainable development report. Li et al. (2018) in order to judge whether enterprises implement sustainable public procurement (SSP) in the process of participating in the global supply chain, they sorted out the use of supplier code of conduct contained in the enterprise’s annual report and sustainability report. D’Amato et al. (2019) started from the three perspectives of circular economy (CE), green economy (GE) and bioeconomy (BE), and evaluated the enterprise’s green transformation based on annual reports and sustainability reports. This paper refers to the research methods of Li et al. (2018) and D’Amato et al. (2019) and uses text mining methods to analyze the text of the annual reports of 25 power enterprises.
In order to accurately determine whether power enterprises are developing and applying smart grids, this paper first extracts 15 keywords that are highly relevant to smart grids based on the information provided in the Baidu index, Google index, and Alibaba big data analysis platform. The specific conditions are shown in Table 4. After that, using KNIME to conduct text mining on power enterprise annual reports and count the frequency of keywords appearing in the enterprise’s annual reports based on the text mining results. Using manual inspection methods to filter the information and classify the enterprise’s annual reports based on the frequency of smart grid related keywords. Finally, the classification method in machine learning is used, that is, under the premise of given relevant input indicators, supervised learning is used to judge whether the classification results of this paper are accurate.
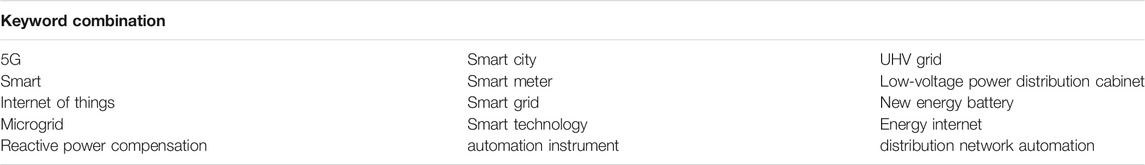
TABLE 4. Keyword combinations related to smart grid of power enterprises.
Note: In the actual index, the case of English abbreviations is also included to avoid missing key text information due to formatting issues.
This paper downloaded the 2011–2019 annual reports of 25 electric power enterprises from Sina Finance (finance.sina.com.cn) and converted them into EXCEL documents, and organized the data as follows: Firstly, remove the numbers and punctuation that exist in the document. Secondly, use the stop words list of Harbin Institute of Technology to segment the content of the annual report and remove the stop words. After that, a bag of words is created and the text mining results are stored. Finally, count the frequency of smart grid-related keywords in the company’s annual reports. Based on the results, the enterprise’s annual reports are classified and a word cloud diagram is made. The diagram shows the frequency of occurrence of keywords related to the smart grid. The specific results are shown in Figure 4.

FIGURE 4. Smart grid word cloud diagram.
According to the binary classification method, enterprise annual reports are divided into two categories. The frequency of smart grid related keywords in the first type of enterprise annual report is greater than or equal to one, and the frequency of smart grid related keywords in the second type of enterprise annual report is less than one. After that, the unstructured text data in the text mining results are converted into vector data X, and the quality of the classification results of the electric power enterprise’s annual report is tested by using Logistic Regression (LR), Random Forest (RF), and Support Vector Machine (SVM).
By establishing a logistic regression model, the functional relationship between the probability of an event and other variables can be found. This paper assumes that the annual reports of electric power enterprises belong to the first category, with C = 1, otherwise C = 0. P is the probability of a certain event. P can be expressed as a linear function explaining the vector data X. The logistic regression model is as follows:
The logistic regression model returns the probability of event occurrence as:
When using the random forest model to analyze the sample, first use the bootstrap method to randomly select multiple sub-samples from the vector data, and model the decision tree, and then use the voting method to combine the prediction results of multiple decision trees to determine the analysis of the random forest Result. The random forest model is as follows:
Among them,
Support vector machines can find support vectors with better classification performance through self-learning methods, map them to a high-dimensional space, and establish a hyperplane in the space that correctly classifies samples and has the largest interval. Generally speaking, any function that satisfies the Mercer condition can be used as a kernel function. In this paper, a common radial basis function (RBF) is selected to analyze the results of model classification. This function can be expressed as:
Among them,
The text-mining results are divided into a training set (80%) and test set (20%) and analyzed using logistic regression, random forest, and support vector machine. The specific results are shown in Table 5. It can be seen that the results of logistic regression and random forest are higher than support vector machines, and the results of the two are relatively close. The poor evaluation result of the support vector machine is because the sample size selected in this paper is large, and the number of matrix elements will increase squarely with the increase of the data size, which will have a negative impact on the calculation results of the support vector machine. According to the evaluation results of the machine learning model, the classification results of the annual reports of electric power enterprises can effectively describe the specific conditions of the enterprise’s R&D and application of smart grids.
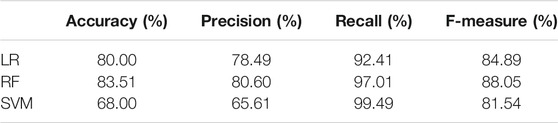
TABLE 5. Machine learning model evaluation results.
Although many scholars have found that the application of smart grid by power enterprises can improve corporate performance, the monetary funds held by enterprises usually do not change much. When they conduct smart grid R&D applications, they need to obtain cash through financing and invest them in the R&D and application of smart grids, this will lead to a decline in its return on equity (
Among them, the dependent variable
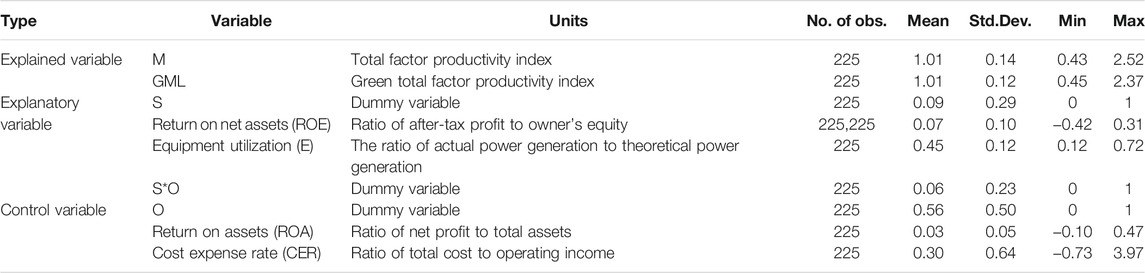
TABLE 6. Description of the main variables and their descriptive statistical analysis.
First, using the LM test to determine whether there is an individual effect in the model. The result shows that there is an individual effect, so a mixed model should not be used. After the Hausman test of the model, the results show that the fixed-effect model is more suitable, so this paper chooses the fixed-effect model for estimation. Setting time dummy variables and testing their oint significance, the result accepts the null hypothesis that no fixed time effects are required in the model. In this paper, the Wald test of between-group heteroscedasticity, the Wald test of intra-group autocorrelation, and the intra-group synchrony correlation test were performed on Model 9 to Model 16, respectively. The results show that the model has problems with heteroscedasticity between groups, autocorrelation within groups, and contemporaneous related problems. In order to solve the above problems, this paper makes assumptions on the specific forms of heteroscedasticity and autocorrelation and uses a comprehensive feasible generalized least squares (FLGS) method to perform regression analysis on Model 9 to Model 16. The regression results are shown in the first and second columns of Table 7.
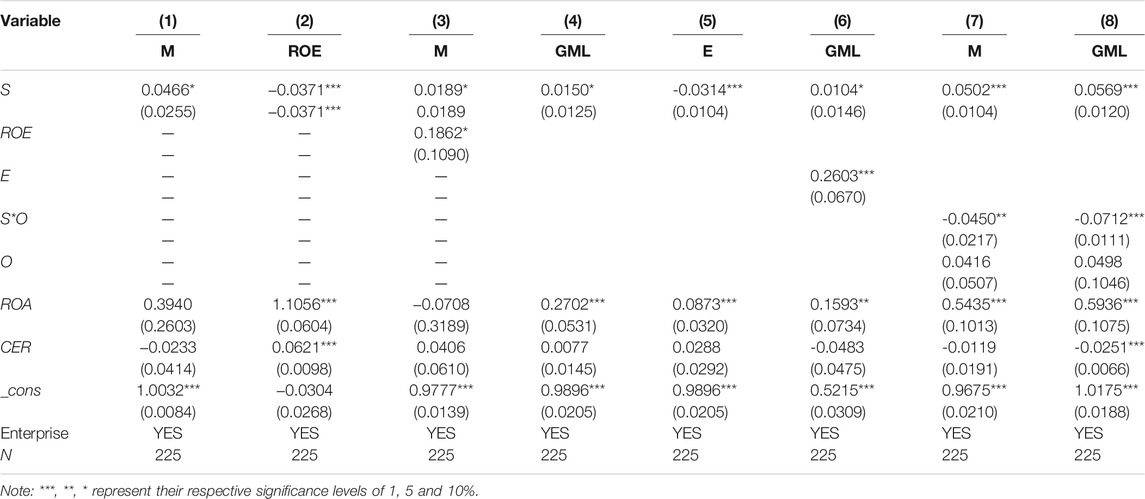
TABLE 7. Regression results.
It can be seen from the first and third columns in Table 7 that the smart grid dummy variable (
In the seventh column of Table 7, test Hypothesis 1 by analyzing the influence of the smart grid on the total factor productivity index (
The results of the seventh column shows that the smart grid dummy variable (
It can also be seen from the results in the seventh column that the interaction term (
The results of the eighth column shows that the smart grid dummy variable (
It can also be seen from the results in the eighth column that the interaction term (
This paper uses the sub-sample regression method and supplementary variable method to test the robustness of the model. According to the power generation structure of power enterprises, 25 enterprises are divided into two groups. The first group of power enterprises has a single power generation structure, and the second group of power enterprises has a diversified power generation structure. This paper uses the second group of power enterprises as the research object to perform regression analysis, and the results are shown in the first to fourth columns of Table 8. It can be seen that the masking effect of return on net assets (
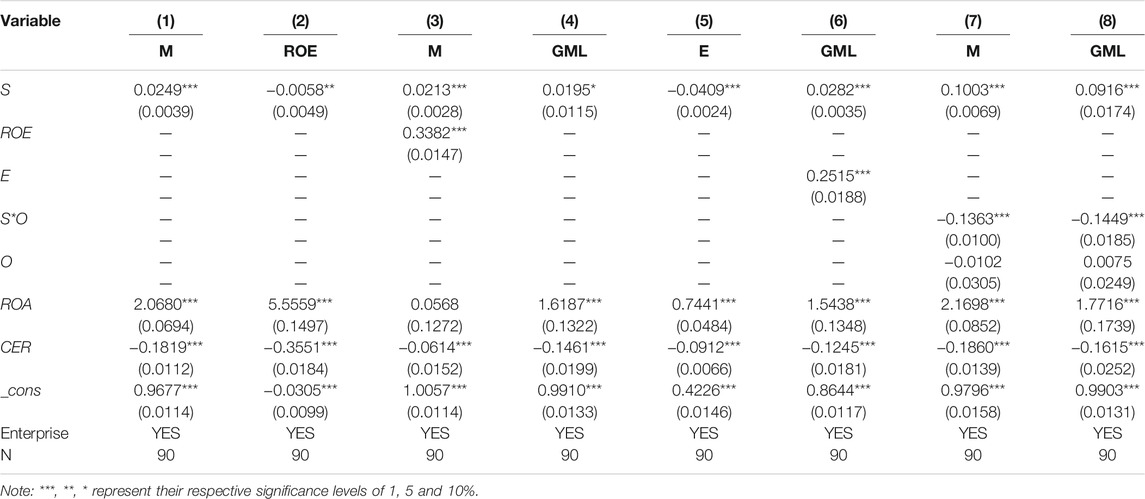
TABLE 8. Robustness test (1).
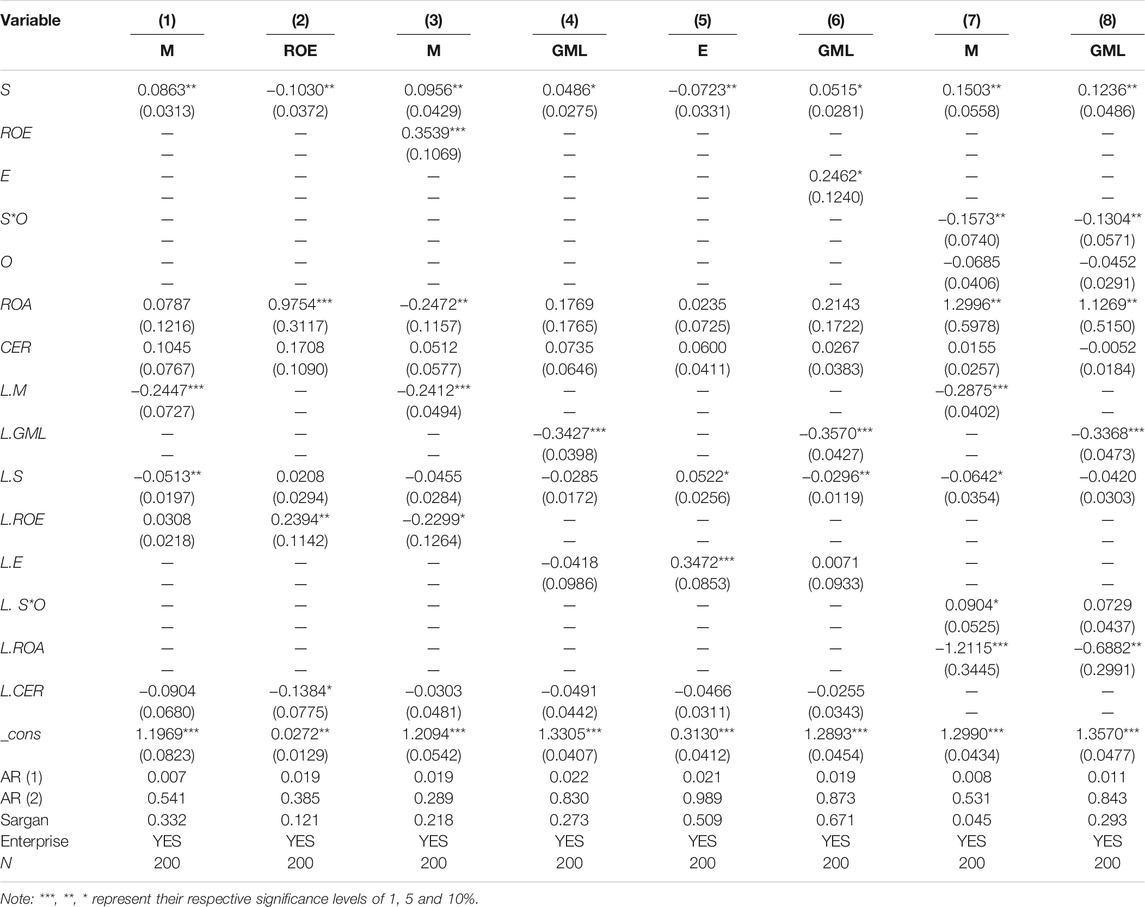
TABLE 9. Robustness test (2).
Existing articles mainly focus on the analysis of the impact of green innovation activities on operating performance and environmental performance, and seldom pay attention to the optimization effect of enterprise application of advanced technology on operating performance and environmental performance, and the moderating effect of the heterogeneity of property rights on this process. This paper uses the panel data of 25 domestic power enterprises from 2010 to 2019, uses the Malmquist index model and the Malmquist-Luenberger index model to evaluate the operating performance and environmental performance of power enterprises, and then conducts text mining of the power enterprise’s annual report and compares them based on keyword combinations. The annual report is classified. Logistic Regression (LR), Random forest (RF), and Support Vector Machine (SVM) are used to test the classification results. Finally, dummy variables are set according to the classification results of the annual report and the feasible generalized least squares method (FLGS) and Dynamic Panel System Generalized Moment Estimation (SYS-GMM) analyzes the impact of enterprise application of the smart grid on green transformation and the moderating role played by the heterogeneity of property rights in this process. The results show that the overall fluctuation trend of the total factor productivity index (M) of power enterprises and the green total factor productivity index (GML) is W-shaped; the technological progress efficiency index (TC) plays a leading role in the total factor productivity index (M), the green technical progress efficiency Index (GMLTC) plays a leading role in the green total factor productivity index (GML); the coefficient of the smart grid dummy variable (
Based on the above research conclusions, we should explore the transformation and development path of Chinese power enterprises from the perspective of corporate green innovation activities. First of all, power enterprises should pay attention to the role of digital technologies such as smart grids in improving their business performance and environmental performance. Through the application of 5G, artificial intelligence and big data analysis and other cutting-edge technologies to build an intelligent management and control system and information sharing platform, strengthen the exchange and communication between all participants in the power system. This can effectively solve the problems of resource waste caused by information asymmetry and the difficulty of grid connection of distributed photovoltaic power stations. Second, state-owned power enterprises should make full use of their resource advantages and “leadership” status to actively apply smart grid and other digital technologies to achieve green transformation and upgrading while taking on more social and environmental responsibilities. At present, many state-owned power enterprises are actively undergoing transformation. For example, Guodian Holdings has incorporated “three types and five modernizations” into its development strategy, Yuneng Holdings has adopted “building a new smart energy enterprise” as its new corporate vision, and Mindong Holdings plans to follow “Internet + technical services” requires the construction of smart hydropower stations. Furthermore, Although non-state-owned power enterprises have a relatively high level of internal management and sensitivity to performance changes, their lack of resource advantages leads to higher risks of transformation. Non-state-owned power enterprises should strengthen cooperation with state-owned power enterprises, exchange and share experience in transformation and development, and avoid falling into the “digital transformation trap”. Finally, the Chinese government should help power enterprises achieve green transformation and development as soon as possible. It not only needs to introduce policies to adjust the production and operation methods of enterprises, but also strengthens the investment and construction of new energy supporting facilities to stimulate clean energy production and consumption activities. In 2021, the National Energy Administration of China plans to promote the investment and construction of power source network load storage integration and multi-energy complementary projects, and is committed to using advanced digital technologies such as virtual power plants to create an integrated intelligent joint control system. By releasing the potential of energy regulation on the production and consumption sides and realizing the mutual complementation of various energy sources, China's energy structure will be accelerated to a clean and low-carbon direction.
This article analyzes the role of smart grids in improving the operating performance and environmental performance of Chinese power enterprises, as well as the active role of the nature of corporate property rights in this process, but there are also the following shortcomings. First of all, this article mainly studies the impact of smart grids on the power generation sector of the power system, without considering the impact of the technology on the transmission, distribution and use of electricity, as well as the interaction between various sectors. Secondly, due to the limitations of research data and research methods, it is impossible to quantitatively analyze the specific impact of smart grids on the production and operation activities of enterprises. Finally, although power enterprises can achieve transformation and development through the application of digital technologies such as smart grids, there may be potential risks in the transformation process. Therefore, the future can be studied from two aspects. The first is to analyze the impact of smart grids on other sectors of the power system and the possible synergies between various sectors. The second is to evaluate the bankruptcy risks that may exist in the transformation process by combining the numerical data of power enterprises (Aziz et al., 2021) to help power enterprises avoid the “digital transformation trap” and successfully achieve green transformation and development(Cominola et al., 2021Hu et al., 2017Pan et al., 2020).
The original contributions presented in the study are included in the article/Supplementary Material, further inquiries can be directed to the corresponding author.
CL: Methodology, software, validation, formal analysis, writing—review and editing, visualization. YZ, LZ: Methodology, investigation, data curation, writing—original draft. LZ: Conceptualization, resources, project administration, supervision. BL: Data curation, resources, visualization. All authors contributed to the article and approved the submitted version.
This work was supported by the National Natural Science Foundation of China (71803181, 71663040); National Office for Philosophy and Social Sciences of China (19FGLB062); Science and Technology Innovative Talents (Humanities and Social Sciences) Program of Henan (2021-CX-019); Philosophy and Social Science Program of Henan (2020BJJ067, 2020JC17); Research project of the Chinese Society of Academic Degrees and Graduate Education (2020MSA396); Key R & D and Promotion Project of Henan (Soft Science Research) (222400410123); Key Project of Philosophy and Social Science Research in Colleges and Universities of Henan (2019-YYZD-18, 2021-JCZD-25); Open Research Fund of Key Laboratory of Applied Brain and Cognitive Sciences, Shanghai International Studies University, China (2021KFKT007).
The authors declare that the research was conducted in the absence of any commercial or financial relationships that could be construed as a potential conflict of interest.
All claims expressed in this article are solely those of the authors and do not necessarily represent those of their affiliated organizations, or those of the publisher, the editors and the reviewers. Any product that may be evaluated in this article, or claim that may be made by its manufacturer, is not guaranteed or endorsed by the publisher.
Aditya, P. V. P., Ahmad, W., Anand, S., Swapnil, S., Raawat, K., and Anand, S. (2018). Online Algorithms for Storage Utilization under Real-Time Pricing in the Smart Grid. Int. J. Electr. Power Energ. Syst. 101, 50–59. doi:10.1016/j.ijepes.2018.02.034
Ali, H. S., Nathaniel, S. P., Uzuner, G., Bekun, F. V., and Sarkodie, S. A. (2020). Trivariate Modelling of the Nexus between Electricity Consumption, Urbanization and Economic Growth in Nigeria: Fresh Insights from Maki Cointegration and Causality Tests. Heliyon 6 (2), e03400. doi:10.1016/j.heliyon.2020.e03400
Anees, A., Dillon, T., Wallis, S., and Chen, Y.-P. P. (2021). Optimization of Day-Ahead and Real-Time Prices for Smart home Community. Int. J. Electr. Power Energ. Syst. 124, 106403. doi:10.1016/j.ijepes.2020.106403
Aziz, S., Rahman, M., Hussain, D., and Nguyen, D. K. (2021). Does Corporate Environmentalism Affect Corporate Insolvency Risk? the Role of Market Power and Competitive Intensity. Ecol. Econ. 189, 107182. doi:10.1016/j.ecolecon.2021.107182
Balcilar, M., Bekun, F. V., and Uzuner, G. (2019). Revisiting the Economic Growth and Electricity Consumption Nexus in Pakistan. Environ. Sci. Pollut. Res. 26 (12), 12158–12170. doi:10.1007/s11356-019-04598-0
Bekun, F. V., and Agboola, M. O. (2019). Electricity Consumption and Economic Growth Nexus: Evidence from Maki Cointegration. Eng. Econ. 30 (1), 14–23. doi:10.5755/j01.ee.30.1.20748
Cominola, A., Giuliani, M., Castelletti, A., Fraternali, P., and Rizzoli, A. E. (2021). Long-term Water Conservation Is Fostered by Smart Meter-Based Feedback and Digital User Engagement. Np Clean. Water 4 (1), 1–10. doi:10.1038/s41545-021-00119-0
D'Amato, D., Korhonen, J., and Toppinen, A. (2019). Circular, green, and Bio Economy: How Do Enterprises in Land-Use Intensive Sectors Align with Sustainability Concepts. Ecol. Econ. 158, 116–133. doi:10.1016/j.ecolecon.2018.12.026
Guo, L. l., Qu, Y., and Tseng, M.-L. (2017). The Interaction Effects of Environmental Regulation and Technological Innovation on Regional green Growth Performance. J. Clean. Prod. 162, 894–902. doi:10.1016/j.jclepro.2017.05.210
Hu, D., Wang, Y., Huang, J., and Huang, H., How Do Different Innovation Forms Mediate the Relationship between Environmental Regulation and Performance. J. Clean. Prod., 2017, 161: 466–476.doi:10.1016/j.jclepro.2017.05.152
Huang, J. W., and Li, Y. H. (2017). Green Innovation and Performance: The View of Organizational Capability and Social Reciprocity. J. Business Ethics 145 (2), 1–16. doi:10.1007/s10551-015-2903-y
Jiang, C., Zhang, F. A., and Wu, C. A. (2020). Environmental Information Disclosure, Political Connections and Innovation in High-Polluting Enterprises - ScienceDirect. Sci. Total Environ. 764, 144248. doi:10.1016/j.scitotenv.2020.144248
Kong, L., Han, J., Xiong, W., Wang, H., Shen, Y., and Li, Y. (2017). A Review of Control Strategy of the Large-Scale of Electric Vehicles Charging and Discharging Behavior. Iop Conf. 199, 12039. doi:10.1088/1757-899x/199/1/012039
Lenox, K. M. (2002). Exploring the Locus of Profitable Pollution Reduction. Manag. Sci. 48 (2), 289–299. doi:10.1287/mnsc.48.2.289.258
Li, D., Zhao, Y., Zhang, L., Chen, X., and Cao, C. (2018). Impact of Quality Management on green Innovation. J. Clean. Prod. 170, 462–470. doi:10.1016/j.jclepro.2017.09.158
Liu, C., Fang, J., and Xie, R. (2020). Energy Policy and Corporate Financial Performance: Evidence from China's 11th Five-Year Plan. Energ. Econ. 93, 105030. doi:10.1016/j.eneco.2020.105030
Markard, J. (2018). The Next Phase of the Energy Transition and its Implications for Research and Policy. Nat. Energ. 3 (8), 628–633. doi:10.1038/s41560-018-0171-7
Min, M., Wilson, C., and Tang, X. (2015). Political Connections and Industrial Pollution: Evidence Based on State Ownership and Environmental Levies in China. J. Business Ethics 138. doi:10.1007/s10551-015-2771-5
Mondejar, M. E., Avtar, R., Diaz, H. L. B., Dubey, R. K., Esteban, J., Gómez-Morales, A., et al. (2021). Digitalization to Achieve Sustainable Development Goals: Steps towards a Smart Green Planet. Sci. Total Environ. 794, 148539. doi:10.1016/j.scitotenv.2021.148539
Palmer, M., and Truong, Y. (2017). The Impact of Technological green New Product Introductions on Firm Profitability. Ecol. Econ. 136, 86–93. doi:10.1016/j.ecolecon.2017.01.025
Pan, X., Pan, X., Song, M., Ai, B., and Ming, Y. (2020). Blockchain Technology and enterprise Operational Capabilities: An Empirical Test. Int. J. Inf. Manag. 52, 101946. doi:10.1016/j.ijinfomgt.2019.05.002
Preston, L. E., and O'bannon, D. P. (1997). The Corporate Social-Financial Performance Relationship: A Typology and Analysis. Business Soc. 36 (4), 419–429. doi:10.1177/000765039703600406
Puari, D. D. (2010). Mainstreaming Green Product Innovation: Why and How Enterprises Integrate Environmental Sustainability. J. Business Ethics 95 (3), 471–486. doi:10.1007/s10551-010-0434-0
Qu, T., and Richard, H. (2019). Does Support from Government Help Firms Survive? Evidence on Financial and Political Assistance in China, 1998–2007. Appl. Econ. 51 (5), 528–541. doi:10.1080/00036846.2018.1494816
Saint Akadiri, S., Alola, A. A., Bekun, F. V., and Etokakpan, M. U. (2020). Does Electricity Consumption and Globalization Increase Pollutant Emissions? Implications for Environmental Sustainability Target for China. Environ. Sci. Pollut. Res. 27 (20), 25450–25460. doi:10.1007/s11356-020-08784-3
Samu, R., Bekun, F. V., and Fahrioglu, M. (2019). Electricity Consumption and Economic Growth Nexus in Zimbabwe Revisited: Fresh Evidence from Maki Cointegration. Int. J. Green Energ. 16 (7), 540–550. doi:10.1080/15435075.2019.1598417
Sun, H., Kporsu, A. K., Taghizadeh-Hesary, F., and Edziah, B. K. (2020). Estimating Environmental Efficiency and Convergence: 1980 to 2016. Energy 208, 118224. doi:10.1016/j.energy.2020.118224
Sun, H., Edziah, B. K., Kporsu, A. K., Sarkodie, S. A., and Taghizadeh-Hesary, F. (2021). Energy Efficiency: The Role of Technological Innovation and Knowledge Spillover. Technol. Forecast. Soc. Change 167, 120659. doi:10.1016/j.techfore.2021.120659
Wolinetz, M., Axsen, J., Peters, J., and Crawford, C. (2018). Simulating the Value of Electric-Vehicle–Grid Integration Using a Behaviourally Realistic Model. Nat. Energ. 3 (2), 132–139. doi:10.1038/s41560-017-0077-9
Xie, X., Huo, J., Qi, G., and Zhu, K. X. (2016). Green Process Innovation and Financial Performance in Emerging Economies: Moderating Effects of Absorptive Capacity and Green Subsidies. IEEE Trans. Eng. Manag. 63 (1), 1–12. doi:10.1109/tem.2015.2507585
Xing, Z., Wang, J., Feng, K., and Hubacek, K. (2020). Decline of Net SO2 Emission Intensity in China's thermal Power Generation: Decomposition and Attribution Analysis. Sci. Total Environ. 719, 1373671–1373679. doi:10.1016/j.scitotenv.2020.137367
Yan, H., Li, B., Chen, S., Zhong, M., Li, D., Jiang, L., et al. (2015). Future Evolution of Automated Demand Response System in Smart Grid for Low-Carbon Economy. J. Mod. Power Syst. Clean Energ. 3 (1), 72–81. doi:10.1007/s40565-015-0103-5
Yd, A., and Pei, Z B.. (2020). A Hybrid Load Forecasting Model Based on Support Vector Machine with Intelligent Methods for Feature Selection and Parameter Optimization. Appl. Energ. 279, 115332. doi:10.1016/j.apenergy.2020.115332
Zhang, H., and Duan, M. (2020). China's Pilot Emissions Trading Schemes and Competitiveness: An Empirical Analysis of the Provincial Industrial Sub-sectors. J. Environ. Manage. 258, 1099971–1099978. doi:10.1016/j.jenvman.2019.109997
Zhenbing, Y., Shuai, S., and Lili, Y.. (2021). Unintended Consequences of Carbon Regulation on the Performance of SOEs in China: The Role of Technical Efficiency. Energ. Econ. 94, 105072. 10.1016/j.eneco.2020.105072.
Zhou, T., Kang, C., Chen, X., Wu, Y., and Xin, J. (2013). Evaluating Low-Carbon Effects of Demand Response from Smart Distribution Grid. Proceedings of the IEEE Pes International Conference & Exhibition on Innovative The smart grid Technologies. Berlin, Germany. Oct. 2012.(IEEE). doi:10.1109/ISGTEurope.2012.6465796
Keywords: environmental performance, operating performance, malmquist-DEA, FLGS, system GMM
Citation: Li C, Zhang Y, Pratap S, Zhou L, Liu B and Zhou G (2022) Regulation Effect of Smart Grid on Green Transformation of Electric Power Enterprises: Based on the Investigation of “Leader” Trap. Front. Energy Res. 9:783786. doi: 10.3389/fenrg.2021.783786
Received: 26 September 2021; Accepted: 20 December 2021;
Published: 12 January 2022.
Edited by:
G. M. Shafiullah, Murdoch University, AustraliaReviewed by:
Festus Victor Bekun, Gelişim Üniversitesi, TurkeyCopyright © 2022 Li, Zhang, Pratap, Zhou, Liu and Zhou. This is an open-access article distributed under the terms of the Creative Commons Attribution License (CC BY). The use, distribution or reproduction in other forums is permitted, provided the original author(s) and the copyright owner(s) are credited and that the original publication in this journal is cited, in accordance with accepted academic practice. No use, distribution or reproduction is permitted which does not comply with these terms.
*Correspondence: Baoquan Liu, YmFvcXVhbmxpdWNoaW5hQDE2My5jb20=
Disclaimer: All claims expressed in this article are solely those of the authors and do not necessarily represent those of their affiliated organizations, or those of the publisher, the editors and the reviewers. Any product that may be evaluated in this article or claim that may be made by its manufacturer is not guaranteed or endorsed by the publisher.
Research integrity at Frontiers
Learn more about the work of our research integrity team to safeguard the quality of each article we publish.