 Xin Deng
 Yixin Huang2
 Yuge Chen
 Changming Chen
 Zhenzhi Lin
94% of researchers rate our articles as excellent or good
Learn more about the work of our research integrity team to safeguard the quality of each article we publish.
Find out more
ORIGINAL RESEARCH article
Front. Energy Res. , 14 December 2021
Sec. Process and Energy Systems Engineering
Volume 9 - 2021 | https://doi.org/10.3389/fenrg.2021.783588
This article is part of the Research Topic Advanced Technologies for Planning and Operation of Prosumer Energy Systems View all 111 articles
The configuration of energy storage in the integrated energy system (IES) can effectively improve the consumption rate of renewable energy and the flexibility of system operation. Due to the high cost and long cycle of the physical energy storage construction, the configuration of energy storage is limited. The dynamic characteristics of the heating network and the demand-side response (DR) can realize the space-time transfer of energy. Although there is no actual energy storage equipment construction, it plays a similar role to physical energy storage and can be considered as virtual energy storage in IES planning. In this paper, a multi-scenario physical energy storage planning model of IES considering the dynamic characteristics of the heating network and DR is proposed. To make full use of the energy storage potential of the proposed model, the virtual energy storage features of the dynamic heating characteristics of the heating network and DR are analyzed at first. Next, aiming at the uncertainty of wind turbine (WT) and photovoltaic (PV) output, the scenario analysis method is used to describe the wind and photovoltaic power output with different probabilities. Finally, an electrothermal IES with an IEEE 33-node network and a 26-node heating network serves as an example to verify the effectiveness of the proposed model. The case study shows that the proposed model effectively reduces the physical energy storage configuration and achieves the economic trade-off between the investment cost and the operation cost.
With the increasing concerns on energy consumption and environmental protection, how to improve energy efficiency is becoming one of the most critical and pressing issues around the globe (Aluisio et al., 2017). The traditional single-energy system has a low energy efficiency and has a lot of shortcomings in the aspects of economy and technology. In the context of global energy shortage, the requirement of sustainable development will no longer be satisfied. Thus, the multi-energy complementary and integrated energy system came into being (Hui and Wei, 2020). The integrated energy system (IES) is an effective way for the centralized supply of multiple energy sources and can improve the absorptive capacity of renewable energy (Chen et al., 2020). The vigorous development of renewable energy power generation such as photovoltaic and wind energy can effectively reduce carbon emissions (Liu et al., 2021), which has become an inevitable trend for the development of IES. However, due to the high volatility and obvious reverse peak shaving characteristics of wind, photovoltaic, and other new energies, the further development of this is restricted by bottlenecks such as consumption problems (Jiang and Ai, 2019). The wind and photovoltaic abandonment can be effectively reduced by reasonable energy storage configuration, which is the key to improve the energy efficiency of IES (Beaudin et al., 2010). As a link of “source-network-load-storage”, energy storage has attracted extensive focus and attention in the application of IESs (Li et al., 2019; Paolo et al., 2018). The direct and indirect values of energy storage in power systems are summarized in detail, but only the construction of physical energy storage is considered in the planning objects in current research work.
As a matter of fact, with the coordinated development of the source, network, load, and storage of IES, through the space-time transfer of electrothermal energy, the power of the system in different periods can also be balanced by the dynamic characteristics of the network side (Wei et al., 2017) and flexible resources of the demand side (Zhang et al., 2018a) in addition to physical energy storage equipment such as battery and heat storage tanks. Although there is no actual construction of energy storage equipment, it plays a similar role as physical energy storage, so it is collectively referred to as virtual energy storage (Zhu et al., 2019). On the network side of IES, the water temperature in the heating pipeline has dynamic characteristics. After considering the transmission delay and loss, there is no need to make the real-time balance of the load and source in a simultaneous section, and the effect of space-time transfer of thermal energy can be achieved and the flexibility of the system can be improved.
An optimal scheduling method for an electrical-thermal IES considering heat storage characteristics of the heating network is proposed in (Zhao et al., 2019). The heating network is used as the scheduling resource to participate in the optimal scheduling of electrical-thermal IESs. In (Cao et al., 2019), the thermal characteristics of the heating network are modeled based on transmission delay and temperature loss of pipelines. Simulation results demonstrate that the dispatching model can fully exploit the thermal storage capacity of the heating network and change the profile of heat load and thereby deliver a more economical and practical dispatching solution. The typical structure and key equipment model of the urban integrated heat and power system (UIHPS) with the dynamic characteristics of the UHN is proposed in (Wei et al., 2020), in which a flexibility scheduling model for a UIHPS that considers the dynamic characteristics of a UHN is established. According to the characteristics of transmission delay and user temperature fuzzy, the virtual energy storage characteristics of the heat supply network are studied, and a model of the dynamic transfer of energy in the heat system was built in (Pan et al., 2020).
The demand-side users can change their original power consumption mode according to the market price signals or incentive mechanism (Junhui et al., 2021; Lijesen, 2007). The price-based DR can utilize price signals to guide electrical load users to coordinate the electrical load of the system to realize the time transfer of electrical energy. A dynamic time-of-use price mechanism is proposed in (Zhang et al., 2018b), and an optimal configuration model of the independent microgrid with a price-based demand response to improve the economy of the microgrid is established. Incentive demand response signs up with users in advance, and users will reduce power demand within the contracted capacity to obtain direct compensation. Due to the influence of user consumption psychology, incentive level, and other factors, demand response has obvious uncertainty (Liu et al., 2020). The systematic approach for the joint dispatch of energy and reserves incorporating demand response is proposed in (Zhang et al., 2018a), and the incentive-based demand response model is adopted to improve flexibility by its cooperation with conventional units. The maximum and minimum interruptible load and unit compensation price are considered in (Meng et al., 2018). A bonus-penalty mechanism was designed according to the actual load reduction of the contract customers to optimize the allocation of incentive funds. There has been a lot of research studies on demand response, but most of them focus on two parts. One part is to study the demand response uncertainty caused by users’ psychology, and the other part is to study the impact of demand response on the overall scheduling of IES. Above all, the demand response is not taken into consideration as virtual energy storage and is not incorporated into the planning of IES together with physical energy storage.
In this paper, a multi-scenario physical energy storage planning model of IES considering the dynamic characteristics of heating networks and DR is proposed. The main contributions of this paper are as follows:
1) The dynamic characteristics of the heating network are regarded as a type of virtual energy storage, which can achieve less configuration of physical energy storage when compared with the planning without considering the virtual heat storage characteristics of the heating network.
2) The price-based DR and incentive DR are regarded as another type of virtual energy storage, which can further reduce the physical energy storage configuration when compared with the planning separately considering the price-based DR or incentive DR.
3) Based on the two types of virtual energy storage, the physical energy storage planning model of the electrothermal IES is proposed, which can achieve a lower investment cost and a lower wind and photovoltaic abandonment cost.
The basic structure of the electrothermal IES is shown in Figure 1, which mainly includes renewable energy units such as WT and PV units, combined heat and power units (CHPs), electric heat-transfer equipment such as heat pumps (HPs) and electric boilers (EBs), and physical energy storage equipment such as batteries and heat storage tanks (HSTs). The power system and thermal system are coupled through CHP units and electric heating equipment. Considering the uncertainty of the renewable energy output, the scenario analysis method is used to describe the wind and photovoltaic output.
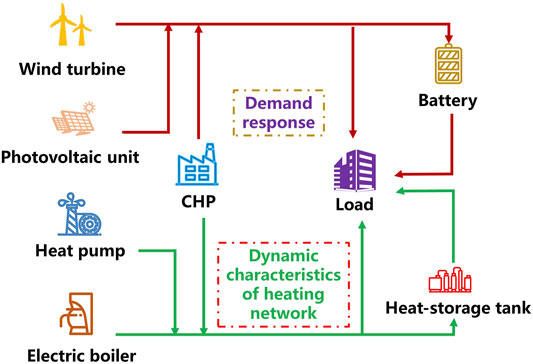
FIGURE 1. Structure of the electrothermal IES.
Through the reasonable configuration and scheduling toward the energy storage system, the load demand can be met in time and more renewable energy can be consumed by the electrothermal IES. However, as an equipment resource, the energy storage system has a long construction cycle and high construction cost and is hard to move once invested and constructed. As a non-equipment resource, the dynamic characteristic of the heating network uses the coupling relationship between the inlet or outlet temperature of hot water in the pipeline and the time to store heat, and there are no extra investment costs required. DR has the characteristic of a low-capacity cost and a short contract cycle. Also, users and power supply companies can be motivated to sign contracts by the price-based incentive method. After the expiration of the contract, if the resource requirement of the planning and operation of the IES toward DR decreases, part of the contract may not be renewed. Therefore, compared with the construction of equipment resources such as physical energy storage, it is more economic to bring the dynamic characteristics of the heating network and DR into the planning of IES.
The balance of the electrical generation and utilization on power systems needs to be satisfied in real time. However, when the thermal energy of the thermal system is transmitted through the heat-supply network, there will be a certain time delay (Lund et al., 2014; Sheng et al., 2020). Thus, the transmission delay characteristics of the heating network make the heating pipe network become a kind of heat storage facility.
As shown in Figure 2, the heat-supply system consists of a heat resource, heat network, heat-exchange station, and heat load, which is divided into the transmission system (primary pipe network) and distribution system (secondary pipe network). Also, the heat-supply system exchanges energy through the heat-exchange station. Because the secondary pipe network is short and close to the load, its pipe dynamic characteristics can be ignored, and the modeling is mainly concentrated on the primary pipe network (Li et al., 2017). Both the heat-exchange station and heat load are considered as load nodes, and the electric heat-transfer equipment, such as CHP, HP, or EB, is considered as a heat source node. The nodes are connected by water supply and water return pipes.
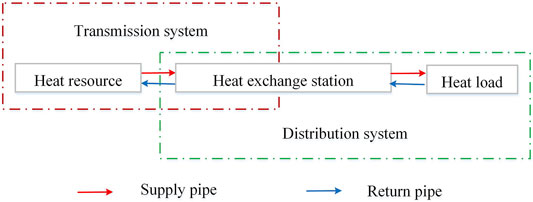
FIGURE 2. Structure of the heat-supply system.
The electric heat-transfer equipment, such as combined heat power units, heat pumps, or EB, is considered to be a heat source node. The heat source nodes are represented as follows:
where
As shown in Eqs 4,5, the permitted value of water supply temperature and water return temperature is limited by the temperature of the pipe.
where
The operation condition consists of the continuity equation of nodal mass flow, the hybrid equation of node temperature, and the water temperature characteristic equation of the heat-supply pipe (Gu et al., 2017).
1) Continuity equation of nodal mass flow
The inflow hot water mass is equal to the outflow hot water mass of each node, which is shown in Eq. 6.
where
2) Hybrid equation of node temperature
At the same node, after mixing the hot water with different temperatures from different pipes, the temperature flowing out to different pipes is the same.
where
3) Water temperature characteristics equation of the heat-supply pipe
The water temperature characteristics refer to the coupling relationship between time and the inlet and outlet temperatures of hot water in the same pipe and are the key to describe the virtual energy storage of the heat-supply pipeline network (Chen et al., 2021). In the pipelines, the water temperature at the inlet will slowly extend to the outlet, and the temperature transmission delay is nearly consistent with the time for hot water to flow through the pipeline, that is, the delay depends on the length of pipelines
where
Besides, due to the difference between the hot water temperature of pipelines and the environment temperature, heat loss is produced, which will lead to the water temperature drop when water flows in the pipelines. According to the coupling relationship between time and the inlet and outlet temperatures of hot water in the same pipe, the dynamic model of the heating network considering time delay and heat loss is established as follows:
where
The heat-exchange station and heat load are both considered load nodes. The load nodes are represented as
where
As an effective regulation method, demand response can achieve resource integration on the user side, and its flexibility and schedulability can achieve the time transmission of energy. Through regulating the load curve, the accommodation rate of renewable energy can be improved. In this paper, the virtual energy storage resources of DR refer to price-based DR and incentive DR.
The relationship between the price of different periods and power demand can be reflected by the real-time price. In the actual process of power consumption, the change of price will impel users to change their power consumption behavior and to allocate the flexible load to achieve the effect of time transmission for energy. The decrease of load refers to the discharge of virtual energy storage, and the increase of load refers to the charge of that.
The change of price in a certain period may lead to the change of power consumption behavior of users in one or several periods. Then, the self-elasticity coefficient is used to describe the relationship between an electricity price change and electricity consumption change in the current period, and the mutual-elasticity coefficient is used to describe the relationship between electricity price change in other periods and electricity consumption change in the current period. The equations of self-elasticity coefficient and mutual-elasticity coefficients are as follows:
where
The power consumption behavior of users will be influenced by the change of price, which may lead to the regulation of power consumption characteristics. Taking T as a cycle to establish a user demand response model, the relationship between the change of electricity consumption and the change of electricity price in each period is represented as
where r is the matrix related to elasticity coefficients of each period, which can be expressed by
According to the price-electricity demand response model of users, the real-time electricity load after implementing price-based demand response is
By signing the demand response contract, the incentive DR can impel users to interrupt part of electricity load during peak load periods to achieve the discharge effect of virtual energy storage. The cost of incentive demand response includes contracted capacity fee and electricity fee (Huang et al., 2021).
When signing the demand response contract, the integrated energy system pays the user the contracted capacity fee for the demand-side response, which can be expressed by
where Csig is the capacity fee for demand-side response; N is the number of planning stages;
When considering the characteristics of demand response and phycology of consumers, the maximum potential coefficient for demand response
where
where
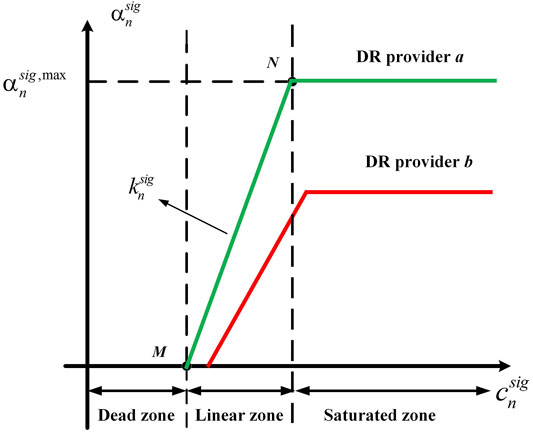
FIGURE 3. Piecewise linear curve of demand response potential.
The economic operation of the IES in every scenario is achieved by demand response resources contracted through scheduling, and the energy fee for demand response
where
In each operation scenario, the real-time power constraint, execution period constraint, and execution duration constraint for demand response are needed. Also, the constraints can be expressed by
where
Affected by the environment, the wind and photovoltaic power outputs have some features such as strong fluctuation and uncertainty. Thus, whether it is the grid-connected or off-grid power generation mode, it has a great challenge to the reliability of load power consumption in power systems. The scenario analysis method can clearly describe the probabilistic characteristic of uncertainty quantities, and the uncertainty of wind and photovoltaic power described by the scenario analysis method can simplify the calculation of the optimization model. Therefore, the scenario analysis method is widely used. It is supposed that the scenario number of wind and photovoltaic power output is s, the number of planning years is N, and the scheduling interval is 1 h. The objective function is the minimum sum of planning cost
The planning cost includes the investment cost of physical energy storage
where
The operation cost includes generation cost of CHP units
where
where
The power flow constraint of the power system is non-linear, and the global optimality of the solution cannot be guaranteed by the traditional numerical method. Thus, the second-order cone programming is used to transform the power flow constraints and node voltage constraints of the AC distribution network, and the resulting constraints are linear and satisfied with the convex programming requirements, which can not only guarantee the accuracy of the algorithm but also promote the convergence of the programming problem.
First, Eq. 32 is used to make equivalent deformation of Eqs 27, 28, and 31:
It can be obtained that
Then, after using the second-order cone relaxation toward Eq. 38, the relaxed constraints are
where || || is the Euclidean norm. Through the above second-order cone transformation, the original problem (non-convex problem) is transformed into a simpler mixed-integer second-order cone programming problem (convex problem), and the global optimal solution can be quickly obtained by the commercial software CPLEX.
1) Allowable maximum wind and photovoltaic abandonment and output constraint
where
2) Operation constraint of CHP units
The CHP units can work in multiple working states. In this paper, the CHP unit is set to operate in the constant thermal-power ratio mode. Eq. 34 is the thermal-power ratio constraint of CHP units, where
3) Electrothermal conversion constraint and output constraint of EB
where
4) The heat pump can convert the low-grade heat energy in nature into high-grade heat energy that can be utilized by consuming electricity. The electrothermal conversion constraints and output constraints are as follows:
where
In this paper, the battery and HST are taken as the physical energy storage equipment to store electricity and heat, where x refers to the type of physical energy storage device. The operation features of the physical energy storage model are similar. With sufficient consideration of loss in the process of charge and discharge, the constraints of the stored energy and charge and discharge power are shown as follows:
where
The charging and discharging state constraints, charging and discharging power constraints, energy storage capacity constraint, and energy conservation constraints are
where
In this paper, the electrothermal IES with an IEEE 33-node network and a 26-node heating network is taken as an example for verifying the effectiveness of the proposed model. The scheduling cycle is 24 h or 1 day, the planning period is 5 years (Kazemi and Ansari, 2022), the annual growth rate of various loads is 12%, and the annual growth rate of distributed power sources such as wind and photovoltaic power is 15%. The relevant parameters such as the price of various energy storage equipment, the operation, and the planning cost of IES are shown in Tables 1, 2, the maximum output curve of WT and PV and the node structure of IES are shown in Figures 4, 5. The planning model of the electrothermal IES established in this paper is a mixed-integer programming model. The optimization tool YALMIP in MATLAB 2019a is used for modeling, and the CPLEX 12.8.0 solver is used to obtain the physical energy storage planning scheme.

TABLE 1. Parameters of unit physical storage.

TABLE 2. Fuel cost coefficient of CHP units.
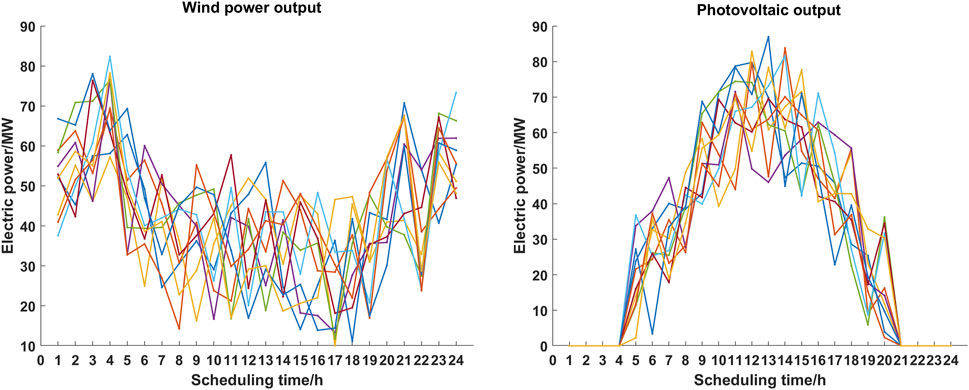
FIGURE 4. Wind power and photovoltaic output scenarios.
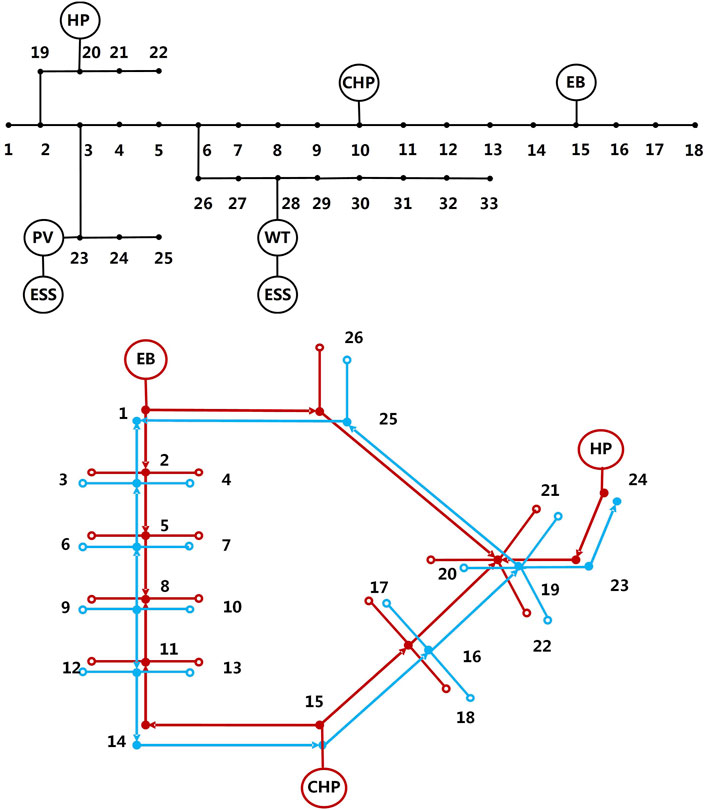
FIGURE 5. Diagram of the electric heating IES.
The physical energy storage planning results of the electrothermal IES are shown in Table 3, and the results of investment cost with different virtual energy storage characteristics are shown in Table 4.
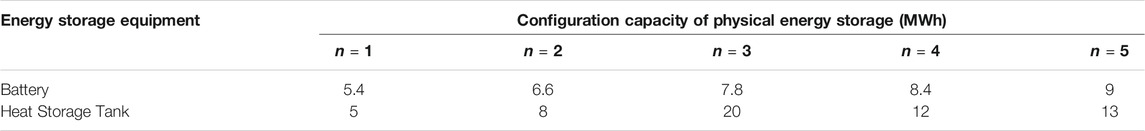
TABLE 3. Results of physical energy storage capacity planning.
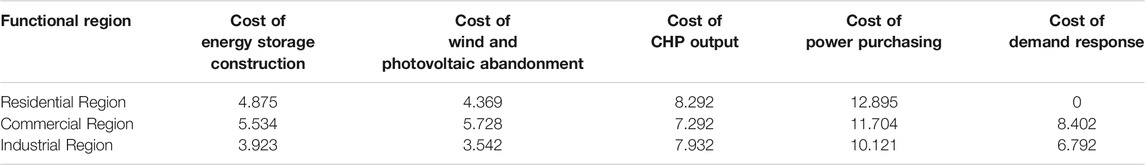
TABLE 4. Investment cost with different virtual energy storage characteristics (unit: 106 CNY).
The cost of energy storage construction decreases from 4,875,000 CNY to 3,923,000 CNY after considering the virtual energy storage characteristics of demand response. Meanwhile, the cost of wind and photovoltaic abandonment decreases from 4,369,000 CNY to 3.542 CNY, and the cost of power purchasing decreases from 12,895,000 CNY to 10,121,000 CNY. It is because that the price-based DR will increase the consumption of renewable energy at a high wind power output but low load demand to reduce the cost of wind and photovoltaic abandonment. Also, the peak load is reduced to make the cost of power purchasing lower at the same time. The virtual energy storage of incentive DR can further reduce the load in high price periods to decrease the cost of power purchasing. The charging and discharging demands of physical energy storage are reduced by the decreased peak load and decreased wind and photovoltaic abandonment, so the configuration number of the battery and HST gets reduced, and the cost of energy storage investment can be saved.
The heat load does not need to meet the real-time balance after considering the dynamic virtual energy storage characteristics of the heating network, and the peak heat load can be supplied by the heat energy previously stored in the heating network. Therefore, the output of the heat pump and electric boiler at night increases, which reduces the cost of wind and photovoltaic abandonment and then reduces the physical energy storage configuration. Finally, the construction cost of energy storage is reduced by 1,611,000 CNY.
It is noteworthy that the configuration of renewable energy generation such as wind and photovoltaic power and electrothermal load increases when the planning year n = 4, which exceeds the maximum limits of pipe transmission. Under these conditions, the wind and photovoltaic consumption can no longer be solved by simply increasing the energy storage configuration, so it is necessary to build new lines and expand pipeline flow at the same time.
To verify the influence of virtual energy storage in the heating network on physical energy storage configuration, the following four kinds of scenarios are set. Model 1: Both the heat loss and time delay are considered by the system; Model 2: Only the heat loss is considered by the system; Model 3: Only the time delay is considered by the system; Model 4: Neither the heat loss nor the time delay is considered by the system. The configuration results of physical energy storage planning with different virtual energy storage characteristics of the heating network are shown in Table 5.
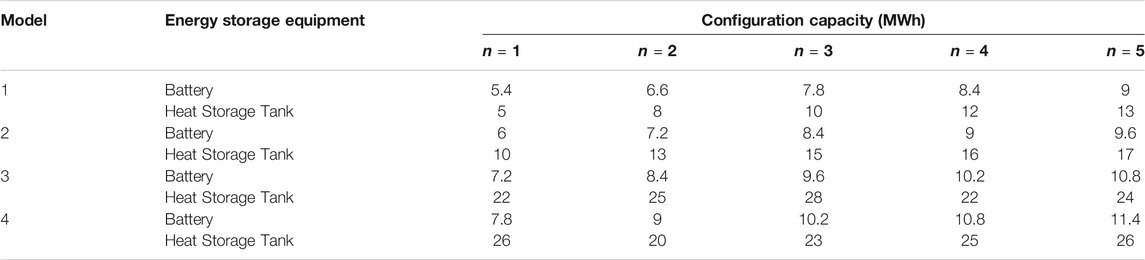
TABLE 5. Configuration results of physical energy storage planning with different virtual energy storage characteristics of the heating network.
The results of physical energy storage planning capacity with different virtual energy storage characteristics of the heating network are also shown in Table 5. The heat supply and heat load no longer need to be balanced in real time after considering the time delay of the heating network. A part of the heat energy which is equivalent to increasing a part of the virtual heat energy storage capacity is stored in the pipeline of the heating network to reduce the configuration capabilities of the heat storage tank during the period of planning years n = 1–5. When n = 5, the heat storage tank is reduced from 26 MWh to 13 MWh. After the capacity of the heat storage tank is reduced, the thermal output of CHP, HP, EB, and other electrothermal coupling equipment increases. The excess output from wind and photovoltaic power does not need to be stored in the battery but is directly consumed by the coupling equipment to provide heat energy. Therefore, the capacity of the battery is reduced. When n = 5, the capacity of the battery is reduced from 11.4 to 9 MWh.
After considering the heat loss, the investment and construction capacities of the battery and heat storage tank are reduced. To satisfy the heat load demand, the output of the heat source is increased accordingly and is transmitted through the heating network to be stored in the heat storage tank for reserves. After considering the heat loss, part of the heat energy is lost through the pipeline, reducing the demand for physical energy storage equipment. When the system considers the time delay and heat loss at the same time, the number of batteries and HST invested and constructed is the least, which is 5.4, 6.6, 7.8, 8.4, 9 MWh and 5, 8, 10, 12, 13 MWh, respectively.
The operation results before and after considering the time-delay characteristics of the heating network are shown in Figure 6. It can be seen from Figure 6 that the heat supply of the heat source and heat load in the thermal system are asynchronous. The heat energy of the heating network is more than the heating demand from 0:00 to 7:00 and 19: 00 to 24:00, and part of the excess heat energy is stored in the heating network, reducing the need for heat storage of HST. When the planning year n = 1, the construction amount of HST is reduced from 26 to 5 MWh. The heat energy entering the heating network is less than the heating demand from 9: 00 to 16:00. The heat energy stored in the heating network in the early stage makes up for part of the heating demand during this period, which is equivalent to reducing the heat discharge of physical energy storage. Meanwhile, it can be seen from Model 1 of Figure 6 that the output of the CHP unit, heat pump, electric boiler, and other heat supply equipment of the thermal system has decreased. During this period, the heat energy stored in the heating network can satisfy part of the load demand, and the heat discharge of physical energy storage is reduced accordingly. Therefore, from the perspective of operation, the planning capacity of physical energy storage can be effectively reduced after considering the time delay of the heating network, and the scheduling requirements can be met at the same time.
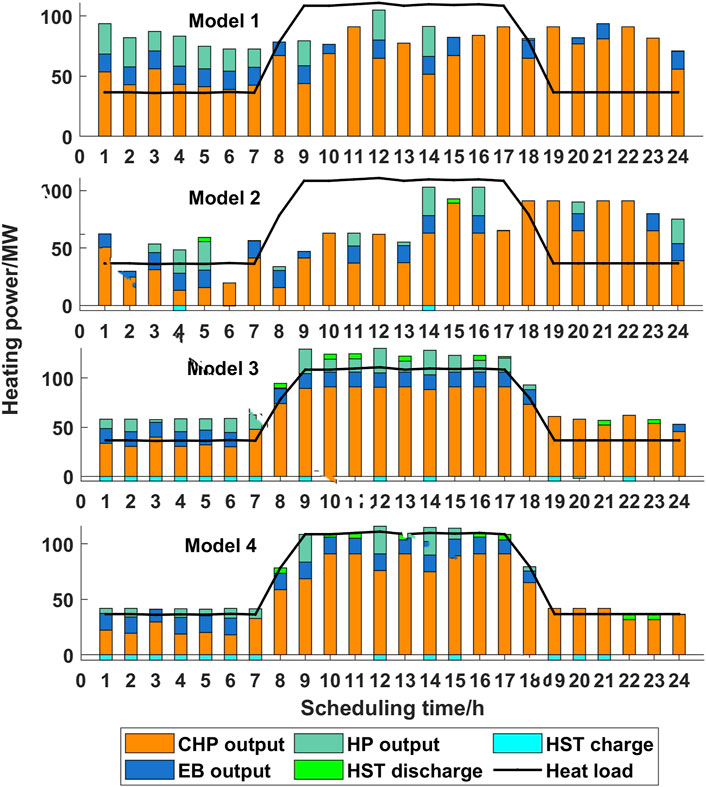
FIGURE 6. Operation results before and after considering time delay characteristics of the heating network.
The planning capacity results of physical energy storage planning with different demand responses are shown in Table 6. Model A is the virtual energy storage characteristics that consider the price-based DR and incentive DR; Model B is the virtual energy storage characteristics that only consider the price-based DR and do not consider the incentive DR; Model C is the virtual energy storage characteristics that only consider the incentive DR and do not consider the price-based DR; Model D is the virtual energy storage characteristics that do not consider the price-based DR and the incentive DR. The comparison shows that both the virtual energy storage of price-based DR and virtual energy storage of incentive DR can reduce the configuration capacity of the battery and heat storage tank to varying degrees. When considering the two demand response resources as virtual energy storage at the same time, the physical energy storage capacity configuration is the lowest, with a battery capacity of 9 MWh and a thermal storage tank capacity of 13 MWh.
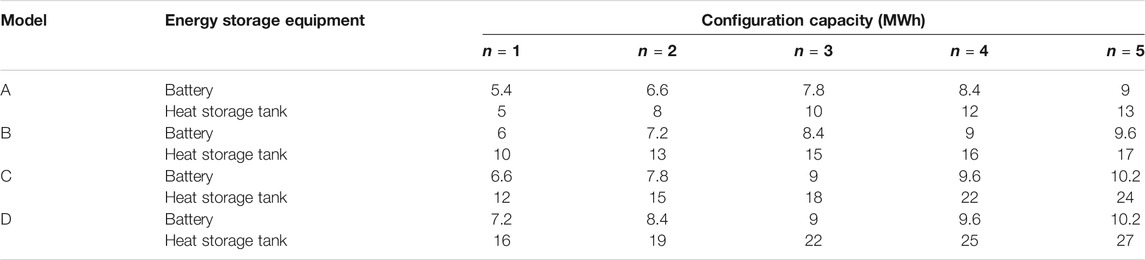
TABLE 6. Planning capacity of physical energy storage planning with different demand responses.
The load curve of virtual energy storage characteristics considering different demand responses is shown in Figure 7. It can be seen from Figure 7 that the peak-valley difference of power load is significantly reduced compared with that without a time-of-use policy. After considering the price-based demand response of the system, the valley power load increases from 0:00 to 9:00. At this time, the wind power output achieves its peak value, and the increase of load level increases the consumption of renewable energy such as wind power and reduces the demand for batteries; the peak power load is decreased to reduce the demand for battery discharge from 10:00 to 22:00. During the period of planning years n = 1–5, the construction amount of batteries is reduced. When n = 5, the battery capacity is reduced from 10.2 to 9.6 MWh. After considering the incentive DR, the peak load curve of 19:00–20:00 is further reduced within the incentive load DR time of 19:00–20:00, as shown in the green part of Figure 7. It can be seen that after considering the virtual energy storage of the demand-side response, the effect of peak shaving, valley filling, and reduction for peak and valley load difference is achieved, the energy storage demand at a low load with a high output and a high load with a low output is reduced, and the physical energy storage configuration is effectively reduced. Meanwhile, after considering the energy storage characteristics of the price-based and incentive demand response, the battery capacity in each planning year is reduced by 1.2 ∼ 1.8 MWh.
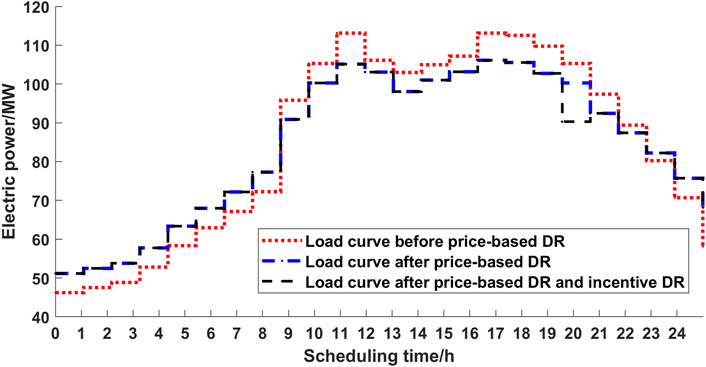
FIGURE 7. Load curve before and after demand response.
The operation characteristics of the power system curve when
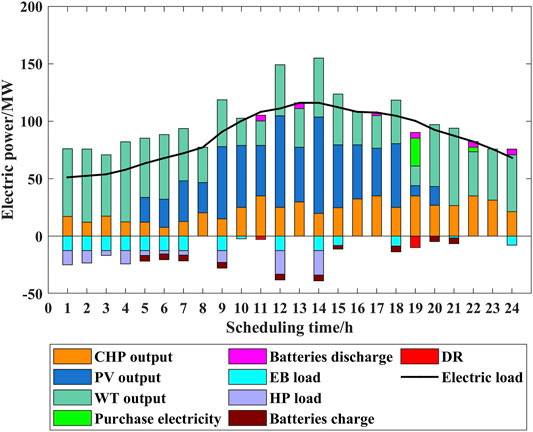
FIGURE 8. Operation characteristics of the power system curve when.
Because the virtual energy storage characteristics of incentive DR are related to the maximum demand response potential coefficient of users and the slope of the piecewise linear function of response potential, the impact of virtual energy storage potential of different incentive DRs on physical energy storage planning is analyzed, and the capacity of the storage battery and heat storage tank is shown in Table 7.
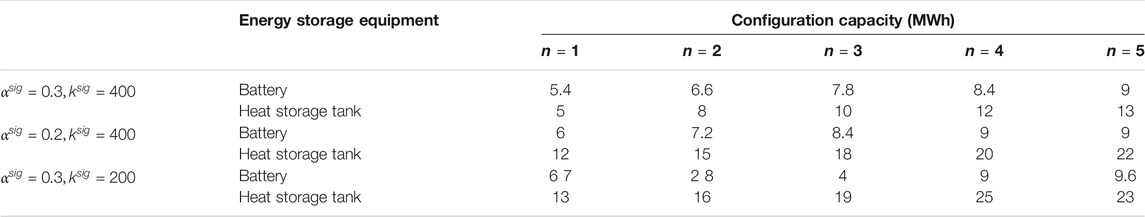
TABLE 7. Planning capacity of physical energy storage planning under different demand response potentials.
When
In this paper, starting from the vertical coordination of “source-network-load-storage” of the electrothermal IES, a planning model of IES considering the dynamic characteristics of the heating network and DR is proposed. The case study has been conducted to test the performance of the proposed model, and the following conclusion can be obtained by the simulation results: compared with only considering physical energy storage planning, the introduction of virtual energy storage into the planning of electrothermal IES can effectively reduce the physical energy storage configuration capacity, reduce the investment cost and wind and photovoltaic abandonment cost of the IES, and provide a new idea for realizing regional energy supply and consumption and consuming more renewable energy.
The proposed model can also be studied in the following aspects:
1) The IES in this paper is the electrothermal IES, and the network characteristics of the natural gas system, the load adjustability of the cooling system, and the mobility of electric vehicles in the transportation system can be considered to achieve further optimization.
2) The response characteristics of cooling, heating, and power demand in different regions are different, and the load has the characteristics of space-time complementarity, which can be further studied around the coordination and optimization between regions.
The original contributions presented in the study are included in the article/Supplementary Material; further inquiries can be directed to the corresponding author.
XD: conceptualization, methodology, software, and writing. YH: conceptualization and methodology. YC: review and editing. CC: review and editing. LY: conceptualization and methodology. QG: conceptualization. XC: conceptualization. WH: methodology. ZL: conceptualization, methodology, and review and editing.
This work is jointly supported by the National Natural Science Foundation of China (No. 52077195).
The authors declare that the research was conducted in the absence of any commercial or financial relationships that could be construed as a potential conflict of interest.
All claims expressed in this article are solely those of the authors and do not necessarily represent those of their affiliated organizations or those of the publisher, the editors, and the reviewers. Any product that may be evaluated in this article or claim that may be made by its manufacturer is not guaranteed or endorsed by the publisher.
Aluisio, B., Dicorato, M., Forte, G., and Trovato, M. (2017). An Optimization Procedure for Microgrid Day-Ahead Operation in the Presence of CHP Facilities. Sustain. Energ. Grids Netw. 11, 34–45. doi:10.1016/j.segan.2017.07.003
Beaudin, M., Zareipour, H., Schellenberglabe, A., and Rosehart, W. (2010). Energy Storage for Mitigating the Variability of Renewable Electricity Sources: An Updated Review. Energ. Sustain. Develop. 14 (4), 302–314. doi:10.1016/j.esd.2010.09.007
Cao, S., Gu, J., Zhang, X., and Lu, P. (2019). “Optimal Dispatch of Combined Cooling, Heating and Power Microgrid Considering Thermal Characteristics of Heating Network,” in 2019 34rd Youth Academic Annual Conference of Chinese Association of Automation (YAC), June 6–8 2019 in Jinzhou, China, 317–322. doi:10.1109/YAC.2019.8787640
Chen, C., Liu, S., Lin, Z., Yang, L., Wu, X., Qiu, W., et al. (2020). Optimal Coordinative Operation Strategy of the electric-thermal-gas Integrated Energy System Considering CSP Plant. IET Energ. Syst. Integration 2 (3), 187–195. doi:10.1049/iet-esi.2019.0123
Chen, C., Deng, X., Zhang, Z., Liu, S., Waseem, M., Dan, Y., et al. (2021). Optimal Day‐ahead Scheduling of Multiple Integrated Energy Systems Considering Integrated Demand Response, Cooperative Game and Virtual Energy Storage. IET Gener. Transm. Distribution 15, 1657–1673. doi:10.1049/gtd2.12124
Gu, W., Wang, J., Lu, S., Luo, Z., and Wu, C. (2017). Optimal Operation for Integrated Energy System Considering thermal Inertia of District Heating Network and Buildings. Appl. Energ. 199, 234–246. doi:10.1016/j.apenergy.2017.05.004
Huang, Y., Lin, Z., Liu, X., Yang, L., Dan, Y., Zhu, Y., et al. (2021). Bi-Level Coordinated Planning of Active Distribution Network Considering Demand Response Resources and Severely Restricted Scenarios. Mod. Power Syst. Clean Energ. 9, 1088–1100. doi:10.35833/MPCE.2020.000335
Hui, H., and Wei, L. (2020). “Modeling and Optimal Operation of Urban Integrated Energy System Considering Multiple Sub-systems,” in 2020 10th International Conference on Power and Energy Systems (ICPES), December 25–27, 2020 in Chengdu, China, 564–568. doi:10.1109/ICPES51309.2020.9349740
Jiang, C., and Ai, X. (2019). “Study on Optimal Operation of Integrated Energy System Considering New Energy Incentive Mechanism,” in 2019 IEEE 3rd Conference on Energy Internet and Energy System Integration (EI2), November 8–10, 2019 in Changsha, China, 301–306. doi:10.1109/EI247390.2019.9062262
Junhui, L., Hongkun, B., Hujun, L., Qinchen, Y., Fangzhao, D., and Wenjie, Z. (2021). “Optimal Decomposition of Flexible Load Resource Reserve Target Based on Power Demand Response,” in 2021 IEEE International Conference on Power Electronics, Computer Applications (ICPECA), January 22–24, 2021 in Shenyang, China, November 8–10, 2019 in Changsha, China, 1046–1049. doi:10.1109/ICPECA51329.2021.9362628
Kazemi, M., and Ansari, M. R. (2022). An Integrated Transmission Expansion Planning and Battery Storage Systems Placement - A Security and Reliability Perspective. Int. J. Electr. Power Energ. Syst. 134 (3), 107329. doi:10.1016/j.ijepes.2021.107329
Li, Z., Wu, W., Shahidehpour, M., Wang, J., and Zhang, B. (2017). “Combined Heat and Power Dispatch Considering Pipeline Energy Storage of District Heating Network,” in 2017 IEEE Power & Energy Society General Meeting, November 8–10, 2019 in Changsha, China. 1. doi:10.1109/PESGM.2017.8274313
Li, Y., Du, Y., Xiang, K., Lin, C., Lin, H., and Yang, Y. (2019). “Planning Model of Integrated Energy System Considering P2G and Energy Storage,” in 2019 IEEE 3rd Conference on Energy Internet and Energy System Integration (EI2), July 16–20, 2017 in Chicago, 1246–1251. doi:10.1109/EI247390.2019.9061829
Lijesen, M. G. (2007). The Real-Time price Elasticity of Electricity. Energ. Econ. 29 (2), 249–258. doi:10.1016/j.eneco.2006.08.008
Liu, D., Sun, Y., Li, B., Xiangying, X., and Yudong, L. (2020). Differentiated Incentive Strategy for Demand Response in Electric Market Considering the Difference in User Response Flexibility. IEEE Access 8, 17080–17092. doi:10.1109/ACCESS.2020.2968000
Liu, S., You, S., Lin, Z. Z., Zeng, C., Li, H., Wang, W., et al. (2021). Data-driven Event Identification in the U.S. Power Systems Based on 2D-OLPP and RUSBoosting Trees. IEEE Trans. Power Syst., 1–1. doi:10.1109/TPWRS.2021.3092037
Lund, H., Werner, S., Wiltshire, R., Svendsen, S., Thorsen, J. E., Hvelplund, F., et al. (2014). 4th Generation District Heating (4GDH). Energy 68, 1–11. doi:10.1016/j.energy.2014.02.089
Meng, J., Huang, X., Feng, Y., Xu, B., Zhao, W., and Luo, M. (2018). “A Comprehensive Evaluation Method and Incentive Mechanism for Demand Response,” in International Conference on Power System Technology (POWERCON), November 6–8, 2018 in Guangzhou, China, 703–707. doi:10.1109/POWERCON.2018.8602333
Pan, E., Li, H., Wang, Z., Peng, D., Zhao, L., Fan, L., et al. (2020). Operation Optimization of Integrated Energy Systems Based on Heat Storage Characteristics of Heating Network. Energy Sci. Eng. 9 (2), 223–238. doi:10.1002/ese3.842
Paolo, G., Matteo, G., Emanuele, M., and Marco, M. (2018). Optimal Design of Multi-Energy Systems with Seasonal Storage. Appl. Energ. 219, 408–424. doi:10.1016/j.apenergy.2017.12.070
Sheng, T., Yin, G., Guo, Q., Sun, H., and Pan, Z. (2020). A Hybrid State Estimation Approach for Integrated Heat and Electricity Networks Considering Time-Scale Characteristics. J. Mod. Power Syst. Clean Energ. 8 (4), 636–645. doi:10.35833/mpce.2019.000230
Wei, G., Wang, J., Shuai, L., Zhao, L., and Wu, C. (2017). Optimal Operation for Integrated Energy System Considering thermal Inertia of District Heating Network and Buildings. Appl. Energ. 199, 234–246. doi:10.1016/j.apenergy.2017.05.004
Wei, W., Shi, Y., Hou, K., Guo, L., Wang, L., Jia, H., et al. (2020). Coordinated Flexibility Scheduling for Urban Integrated Heat and Power Systems by Considering the Temperature Dynamics of Heating Network. Energies 13 (12), 3273. doi:10.3390/en13123273
Zhang, M., Ai, X., Fang, J., Yao, W., Zuo, W., Chen, Z., et al. (2018). A Systematic Approach for the Joint Dispatch of Energy and reserve Incorporating Demand Response. Appl. Energ. 230, 1279–1291. doi:10.1016/j.apenergy.2018.09.044
Zhang, C., Xu, Y., Dong, Z. Y., and Wong, K. P. (2018). Robust Coordination of Distributed Generation and Price-Based Demand Response in Microgrids. IEEE Trans. Smart Grid 9, 4236–4247. doi:10.1109/TSG.2017.2653198
Zhao, B., Zhang, X., Ni, C., Mu, Y., Wang, M., and Meng, X. (2019). “Optimal Scheduling Method for Electrical-Thermal Integrated Energy System Considering Heat Storage Characteristics of Heating Network,” in 2019 IEEE Innovative Smart Grid Technologies - Asia (ISGT Asia), May 21–24, 2019 in Chengdu, China, 1531–1535. doi:10.1109/ISGT-Asia.2019.8881084
Keywords: integrated energy system, physical energy storage, virtual energy storage, dynamic characteristics of the heating network, demand-side response
Citation: Deng X, Huang Y, Chen Y, Chen C, Yang L, Gao Q, Chen X, Hou W and Lin Z (2021) Multi-Scenario Physical Energy Storage Planning of Integrated Energy Systems Considering Dynamic Characteristics of Heating Network and Demand Response. Front. Energy Res. 9:783588. doi: 10.3389/fenrg.2021.783588
Received: 26 September 2021; Accepted: 12 November 2021;
Published: 14 December 2021.
Edited by:
Jingyang Fang, Duke University, United StatesCopyright © 2021 Deng, Huang, Chen, Chen, Yang, Gao, Chen, Hou and Lin. This is an open-access article distributed under the terms of the Creative Commons Attribution License (CC BY). The use, distribution or reproduction in other forums is permitted, provided the original author(s) and the copyright owner(s) are credited and that the original publication in this journal is cited, in accordance with accepted academic practice. No use, distribution or reproduction is permitted which does not comply with these terms.
*Correspondence: Li Yang, ZWV5YW5nbGlAemp1LmVkdS5jbg==
Disclaimer: All claims expressed in this article are solely those of the authors and do not necessarily represent those of their affiliated organizations, or those of the publisher, the editors and the reviewers. Any product that may be evaluated in this article or claim that may be made by its manufacturer is not guaranteed or endorsed by the publisher.
Research integrity at Frontiers
Learn more about the work of our research integrity team to safeguard the quality of each article we publish.