 Zhe Jiang1,2
- 1School of Economics and Management, University of Chinese Academy of Sciences, Beijing, China
- 2School of Energy and Environment, City University of Hong Kong, Hong Kong, China
- 3Troop of People’s Liberty Army, Beijing, China
The promotion of new energy vehicles is a grand plan across countries to achieve carbon neutrality and air purification. The sale volume of new energy vehicles is affected by many factors, yet it is the attitude of consumers themselves that has the final decisive role. We use four representative Baidu search indexes as the variables representing the attention of consumers and take variables of economic, population, and income as control variables for regression analysis from the national and sub-economic regional perspectives respectively. Results show that search indexes of “new energy vehiclek.” “new energy vehicles battery”, and ‘charging pile’ all have significant positive impacts on the sales of new energy vehicles to varying degrees while the index of ‘automobile spontaneous combustion’ has a significant negative impact on the sale volume. This study, therefore, verifies that the consumer attention represented by search indexes is an important yet uncovered factor affecting the sale volume of new energy vehicles. Besides, due to people’s prejudice against spontaneous combustion accidents of new energy vehicles, consumers have a cognitive bias about the spontaneous combustion rate of new energy vehicles especially in less developed areas of China.
1 Introduction
The proliferation of new energy vehicles is considered an important step towards the reduction of harmful gases and achieving carbon neutrality (Thomas, 2009; Hill et al., 2019; Spangher et al., 2019). Accordingly, governments around the world plan to adopt new energy vehicles to build a sustainable transport system and have set goals to promote new energy vehicles adoption (Mock and Yang, 2014; Nie et al., 2016). Yet, despite continuous financial supports and technological advances, the current market penetration rate of new energy vehicles is still quite low (Wang et al., 2019). Therefore, the academic has conducted extensive research on the influencing factors of the sales of new energy vehicles. The existing literature investigates a comprehensive list of elements that are related to the adoption of new energy vehicles, including but not limited to the four following categories: policy, economic, socio-demographic, and personal preference factors. Table 1 summarizes some typical literature on factors impacting the sale volume of new energy vehicles.
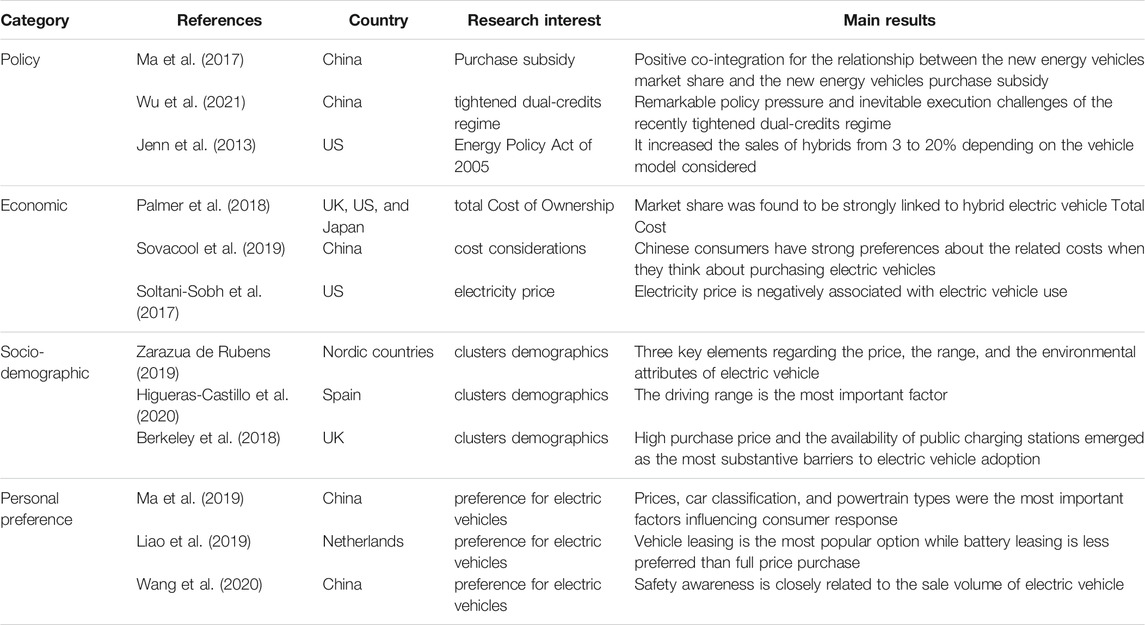
TABLE 1. Literature on factors affecting new energy vehicles.
Although the above literature has studied the factors affecting the sales of new energy vehicles from various aspects, there exists little research focusing on the impact of consumer attention on sales of new energy vehicles. Additionally, the sale volume of commodities is ultimately determined by the behavior of consumers and the quantification of consumer attention can extract the important factors affecting the sale volume. In previous literature, the depiction of consumers’ behavior is mainly obtained through the questionnaire survey (Hao et al., 2016; Liao et al., 2019; Maheshwari et al., 2016). However, the questionnaire survey has a certain lag and cannot reflect the real-time attitude and attention of consumers. On the contrary, the emergence of the Internet has changed consumers’ consumption habits for the development of search engines has made it possible to provide related information immediately. Thanks to the emergence of Internet search engines, for example, Google and Baidu, the detailed information of almost all products can be easily found through the Internet and consumers are now more likely to get information from the Internet before making a shopping decision.
Because automobiles are relatively higher-value commodities, people tend to spend longer time and obtain more information in comparing potential goods to make the decision(Mitchell and Prince, 1993). Due to the convenience of Internet search engines illustrated in the previous part, customers typically use online searches to access commodity information. Searching for pre-purchase information is regarded as an integral element of the consumer’s buying behavior (Akalamkam and Mitra, 2018). Specifically, about 50% of the customers spend more than ten hours identifying the best matching vehicle for their requirements(Wachter et al., 2019). Some scholars have used the search indexes in the research on the sales of new energy vehicles (Wachter et al., 2019; Yang and Zhang, 2020; Zhang et al., 2017). However, almost all the literature is aimed at sale volume forecasting and as far as we know, there is no attempt to explore the impact of consumer attitudes on sale volume through the search indexes.
To explore this possible relationship between consumer attention and commodity sales, we assume that on the whole, consumers’ search volume for phrases related to new energy vehicles may have a certain impact on the sale volume of new energy vehicles. We use the Baidu Index1, a measure of search volume similar to Google Trends, as our dependent variable for we focus on the Chinese market and Baidu is the largest search engine in China with around 79.89% market share2. Baidu index is based on the search volume of Internet users, taking keywords as the statistical object, scientifically calculation of the weighted sum of search frequency of the specific keyword in search engine. According to the main factors that consumers need to consider in the purchase of new energy vehicles, we choose Baidu indexes of four keywords as our research objects: “new energy vehicle” “new energy vehicle battery” “charging pile”, and “automobile spontaneous combustion”. Results show that the first three search indexes all have significant positive impacts on the sales of new energy vehicles to varying degrees while the index of ‘automobile spontaneous combustion’ has a significant negative impact on the sale volume.
The contribution of this paper is mainly reflected in the following aspects. First, to the best of our knowledge, it is the first study to explore the impacts of search indexes on new energy vehicle sales. In addition, we not only use the straight-forward keyword of “New energy vehicle” but also commodity-related factors that may affect consumers’ purchase intention as research objects, which sheds light on a new way to investigate the influence of consumer attitude on product sales. Second, the study suggests that consumers in regions of various economic development levels may have different concerns about new energy vehicles when making purchasing decisions, which provides useful information for manufacturers and governments to further promote new energy vehicles. Last, this study has found a cognitive bias in the adoption of new energy vehicles. Specifically, it reveals that people’s attention to ‘spontaneous combustion’ of new energy vehicles has an excessively negative impact on sale volume, but in fact, the spontaneous combustion rate of new energy vehicles is much lower than that of fuel vehicles.
The rest of the paper is organized as follows. Indexes Choice and Research Hypotheses introduces the background and puts forward the research hypotheses. Related Methodologies and Data presents the data and variables used in the study and the models for the research. Empirical Results analyzes the empirical results and Discussion and Conclusion discusses the main findings, gives policy implications, and provides several future research topics.
2 Indexes Choice and Research Hypotheses
Baidu doesn’t provide search indexes for all keywords, so in our study, we select phrases that both exist in Baidu’s search index library and can point precisely to specific information. The most direct search keyword for consumers when making purchase choices is the product itself, and this choice of keywords can be found in many pieces of literature on the relationship between consumer search index and product sales(Fritzsch et al., 2020; Geva et al., 2015; Ruohonen and Hyrynsalmi, 2017). Additionally, in the previous literature about forecasting new energy vehicles sales using search indexes, researchers all use the products themselves as the search index. Figure 1 also shows the trends of China’s new energy vehicle sales and Baidu search indexes of term ‘new energy vehicle’ from 2016 to June 2021 and it can be seen that the two curves have a certain synchronization. Accordingly, we assume the Baidu index of ‘New energy vehicle’ has an important impact on the sales of new energy vehicles.
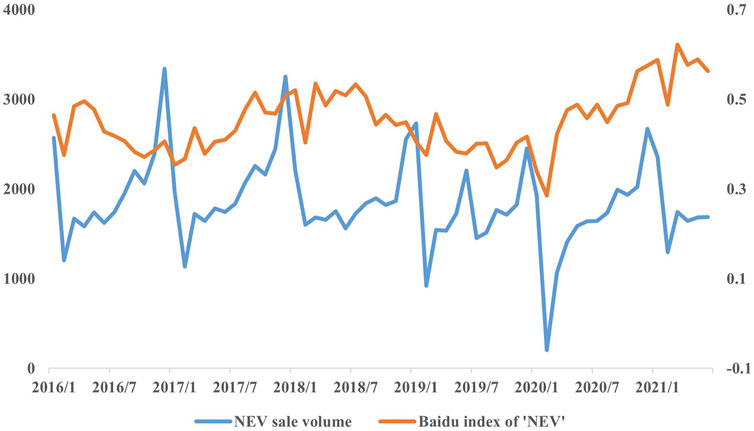
FIGURE 1. New energy vehicle sales and Baidu search index in China from 2016 to 2021.
Hypothesis H1 The search index of “new energy vehicle” has a significant positive impact on the sales of new energy vehicle.Further, we explore the important factors that influence consumers’ decision to buy new energy vehicles. The main reason why it is difficult for electric vehicles to replace traditional fuel vehicles is the short range restricted by battery capacity and the lack of charging pile facilities (Sun et al., 2018). A specific term that arises from it is “range anxiety”, defined as the psychological anxiety consumers feel when dealing with the limited range of new energy vehicles and it has been labeled as one of the most pressing obstacles to the adoption of new energy vehicles (Noel et al., 2019). In previous studies, Wang et al. (2020) suggest that infrastructure, battery technology, and safety awareness are three main factors influencing the market proportion of new energy vehicles in China by analyzing the comment data in Autohome.com, the most visited professional car website in China. Funke et al. (2019) also highlight the deficiencies of charging infrastructure construction in the promotion of new energy vehicles. Based on this, we choose two keywords, “new energy vehicle battery” and “charging pile” as the research objects.
Hypothesis H2 The search index of “new energy vehicles battery” has a significant positive impact on the sales of new energy vehicles.
Hypothesis H3 The search index of “charging pile” has a significant positive impact on the sales of new energy vehicles.Another major concern for new energy vehicles is the problem of safety and it is undoubtedly an enduring issue in the automobile market. Egbue and Long (2012) found that reliability and safety are among the biggest concerns for respondents in an American technological university. Wang et al. (2020) also stress the importance of safety in consumers’ purchasing intentions for new energy vehicles. Additionally, spontaneous combustion is the most common safety accident in electric vehicles. Therefore, we use the Baidu index of “automobile spontaneous combustion” as the variable of consumer attention and propose the fourth hypothesis.
Hypothesis H4 The search index of “automobile spontaneous combustion” has a significant negative impact on the sales of new energy vehicles.
3 Related Methodologies and Data
3.1 Variables and Data
3.1.1 Dependent Variable
Sales refers to the monthly sale volumes of new energy vehicles in the studied provinces during the studied period, i.e., 1st January 2016 to 30th June 2021. The data is provided by Datavision (http://www.dataisvision.com/). It should be noted that only passenger cars are included, while other types of vehicles such as new energy buses are not considered. This is because such vehicles are purchased in a predetermined way with a reasonable procurement process that can not be influenced by consumers. Additionally, the other statistics in our panel data for this study are also measured monthly.
3.1.2 Independent Variable
BI refers to the Baidu search indexes which are downloaded from Baidu.com. Baidu provides real-time data on keyword search volumes for a specific period and territorial scope. To match the monthly sales of new energy vehicles, we use the monthly Baidu index of each province from 2016 to June 2021. Additionally, we use four keywords in the empirical study: “new energy vehicle” “new energy vehicle battery” “charging pile”, and “automobile spontaneous combustion” and norm them as Index1, Index2, Index3, and Index4 respectively. It should be pointed out that we use the sum of the Baidu index of “new energy vehicle” and “electric vehicle” as Index1 and the sum of “new energy vehicle battery” and “electric vehicle battery” as Index2 for new energy vehicles are mainly electric vehicles in China’s market and these two kinds of terms refer to almost the same information on the Internet. We choose these four keywords as they are all directly related to the information consumers are most concerned about when buying new energy vehicles.
3.1.3 Control Variables
In this study, following Guo et al. (2020), we use provincial monthly urban population (
The urban population refers to the volume of permanent urban residents in the studied provinces during the studied period. Population size determines the overall potential demand for the sales of new energy vehicles, so it is one of the determinants of energy vehicles adoption (Egnér and Trosvik, 2018). Considering that China still has a large rural population and the charging facilities in rural areas are difficult to meet the daily use needs of new energy vehicles, we use the urban population as a control variable in the empirical study.
Gross domestic product refers to the total monetary or market value of all the finished goods and services produced within a province’s borders during the studied period. Some studies have found that regional economic development has a positive effect on the sales of new energy vehicles(Javid and Nejat, 2017; Kester et al., 2018). One possible explanation is that regions with better economic development have better infrastructure, and the use of electric cars relies on a large number of public charging devices which demands large-scale investment in public transit facilities(Needell et al., 2016).
Disposable income per capita is calculated by taking income earned from all sources (wages, government transfers, etc.) minus taxes, savings, and some non-tax payments. Disposable income per capita determines an individual’s ability to purchase goods or services, therefore, it is considered to be a significant factor affecting the adoption of new energy vehicles (Langbroek et al., 2016; Mersky et al., 2016; Egnér and Trosvik, 2018; Priessner et al., 2018).
Since the original dataset of
Where
3.1.4 Data Description
This study uses monthly data of 30 provincial-level administrative regions in China from January 2016 to June 2021 for the database we obtained only contains sales statistics of new energy vehicles since 2016. Our study doesn’t include the city of Beijing because Beijing has implemented the automobile purchase restriction policy and Beijing’s new energy vehicle sales are largely determined by the number of vehicle licenses issued by the government of Beijing, but not the true market demand. We also exclude Hong Kong, Macau, and Taiwan in this paper due to missing statistical information. Table 2 summarizes the definitions of all the variables used in the study, as well as their data sources and units of measurement.

TABLE 2. Definitions of variables and descriptive statistics.
3.2 Methodologies
3.2.1 Panel Unit Root Test
In the case of long panel type data, as non-stationary variables may lead to spurious regression, meaning that there is a high correlation even though variables are unrelated, we have to determine whether the variables contain panel unit roots. The unit root test is used to check whether variables in the panel model are stationary and we utilized Levin–Lin–Chu (LLC) test, and Fisher-type tests in our empirical study.
Levin et al. (2002) suggest a more powerful panel unit root test than performing individual unit root tests for each cross-section. The null hypothesis is that each time series contains a unit root against the alternative that each time series is stationary. The model used can be shown as follows:
The Fisher-type test uses an average statistic as the Im-Pesaran-Shin method (Im et al., 2003) but performs the panel unit root test by using the p-value in a meta-analysis. This test is the most commonly used unit root test and is known to have the highest power (Kim & Jun 2010). Fisher-ADF uses the p-value of the statistic obtained from the ADF unit root test while Fisher-PP uses the p-value of the individual cross-sectional data as follows:
3.2.2 Panel Analysis
When estimating static energy demand models by panel analysis, it is common to explain unobserved heterogeneity by using fixed or random effects. The following linear regression model considers the heterogeneity of the panel data:
In the fixed-effect model, the error term
When choosing between fixed and random effect models, the primary criterion is the inference of the heterogeneity of the panel data. If the panel data are derived from a random sampling of the population, then the error term
If the null hypothesis is rejected, the random effect model is more efficient, otherwise, the fixed effect model is chosen. Therefore, in this study, we conduct a panel analysis on the unobserved heterogeneity by using the Hausman test.
We analyze the relationship between Baidu search indexes and new energy vehicles sales in China through a panel analysis. We construct regression equations using four Baidu indexes, as follows:
Where
Then, we put all the Baidu indexes into the model for regression, as follows:
4 Empirical Results
4.1 Stationary Check and Hausmann Test
Table 3 shows the unit root test results for each variable. If the variable has a unit root, we use the first difference to make the variable stationary. It can be seen that
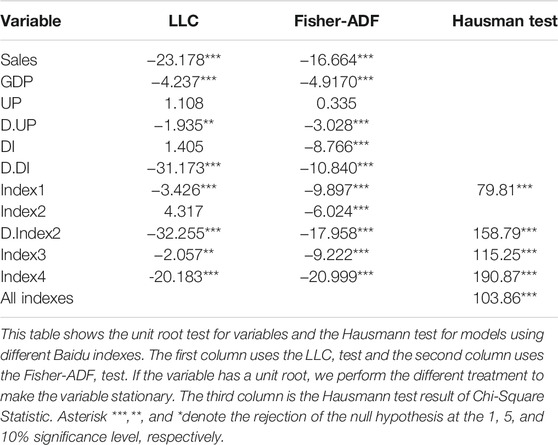
TABLE 3. Unit root test results for each variable.
We then perform the Hausman test to choose the fixed effect or random effect model to perform the panel regressions. As shown in Table 3, the null hypothesis of the Hausman test is rejected at the 1% level. That is, the Hausman test shows that the fixed effect estimation is more suitable than the random effect estimation.
4.2 Consumer Attention to the Sales of New Energy Vehicles
The estimation results are shown in Table 4. The models in the left four columns are regressions using four different search indexes respectively. The fifth model indicates the regression result using all four search indexes and in the sixth model, we omit the control variable of
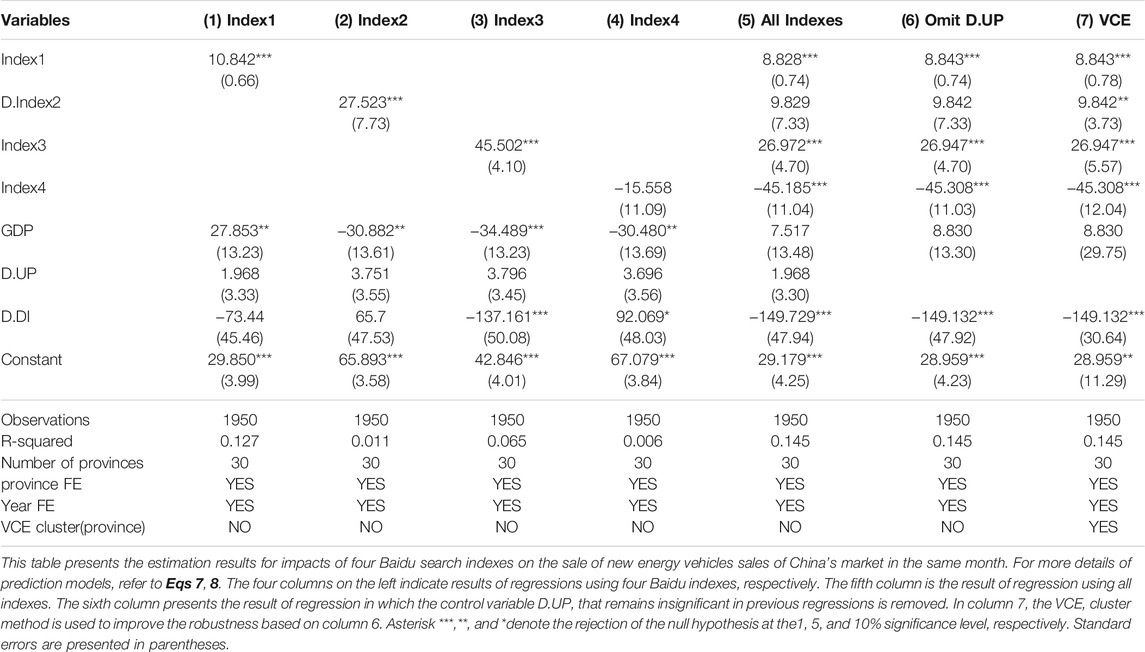
TABLE 4. Model estimation results using Baidu search index in the same month.
Consumers may take a longer time to compare and select commodities with higher values. It is more appropriate to use the previous month’s search index if the consumers use more than 1 month to gather information and make decisions to buy cars. Moreover, using the previous month’s search index can effectively avoid the possible endogeneity issue. We, therefore, use the lag terms of the four search indexes for regressions, and the results are shown in Table 5. The results are very similar to the previous regressions, indicating that search amount of ‘new energy vehicle’, ‘new energy vehicle battery’, and ‘charging pile’ are significantly positive with the new energy vehicle sales of the next month while the term of ‘automobile spontaneous combustion’ is significantly negative, which is in line with our proposed hypotheses.
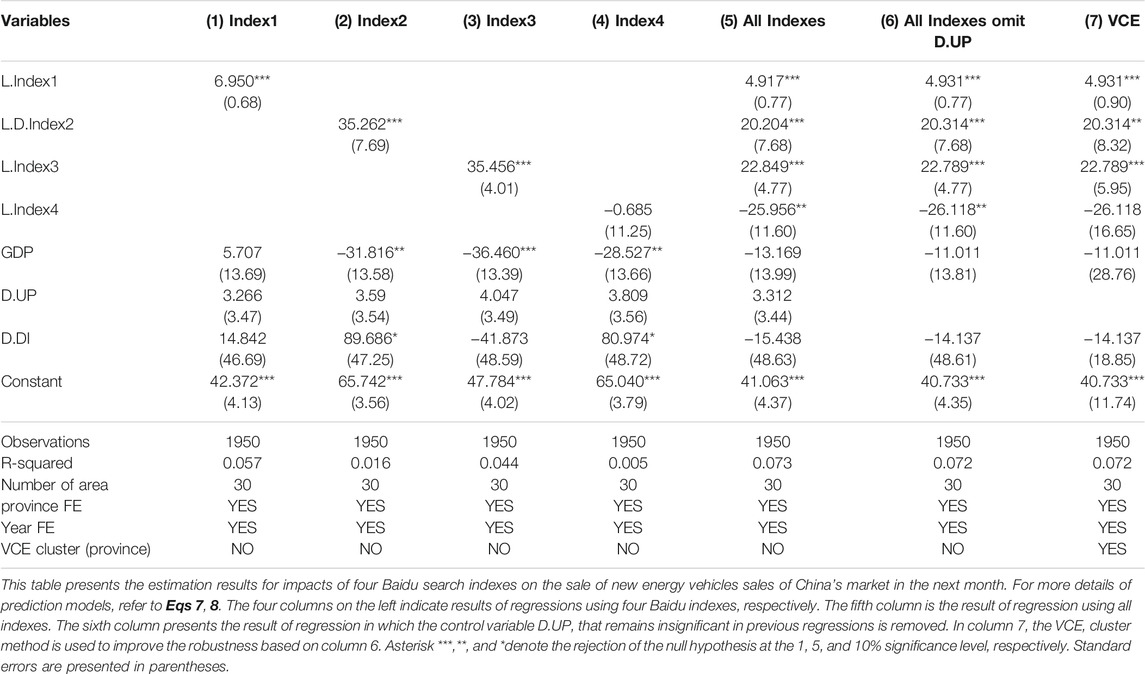
TABLE 5. Model estimation results using Baidu search index of 1 month ahead.
4.3 Analysis of the Different Districts of China
Sales of new energy vehicles are closely related to economic, demographic, and other factors according to the verified results. China has the world’s largest population and the largest market for new energy vehicles. Meanwhile, China has a relatively complicated national condition because the regional development in China is unbalanced in economic development and the situation of the environment varies greatly in different areas. Given this, to explore the impacts of the online search indexes of consumers on new energy vehicles from a more precise perspective, we divide China into four economic regions, i.e. east region, central region, west region, and northeast region, according to the geographical classification standard of the National Bureau of Statistics of China3. The sale volumes of new energy vehicles of four economic regions are presented in Figure 2. It can be seen that eastern China accounts for the largest share of new energy vehicle sales, followed by central and western China, and the least by northeast China.
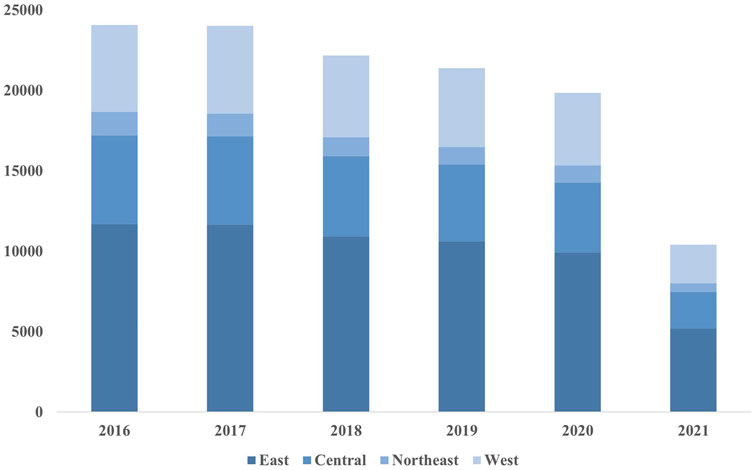
FIGURE 2. Sales of new energy vehicles in China’s four major economic regions from 2016 to the first half of 2021.
We use existing data to perform the regression analysis for each of the four economic regions to evaluate the influences of Internet search behavior on new energy vehicles sales separately. The results are shown in Tables 6–9. In the analysis of each area, we first perform the regression on all of the Baidu indexes as well as the control variables and then omit the non-significant control variables in the results of regressions using the single Baidu index. Using the same method in Consumer Attention to the Sales of New Energy Vehicles, we also use the Baidu search indexes with 1 month lag in the regressions.
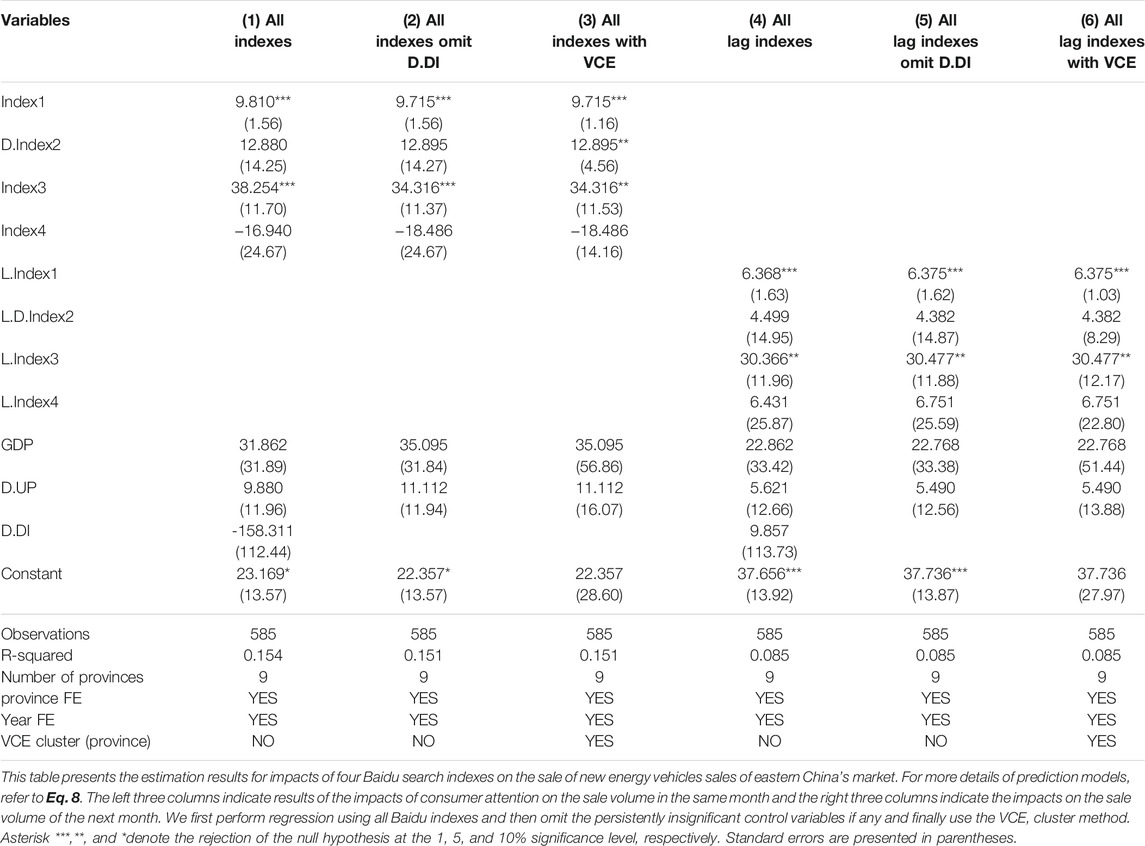
TABLE 6. Model estimation results using Baidu search index regarding the east district of China.

TABLE 7. Model estimation results using Baidu search index regarding the central district of China.
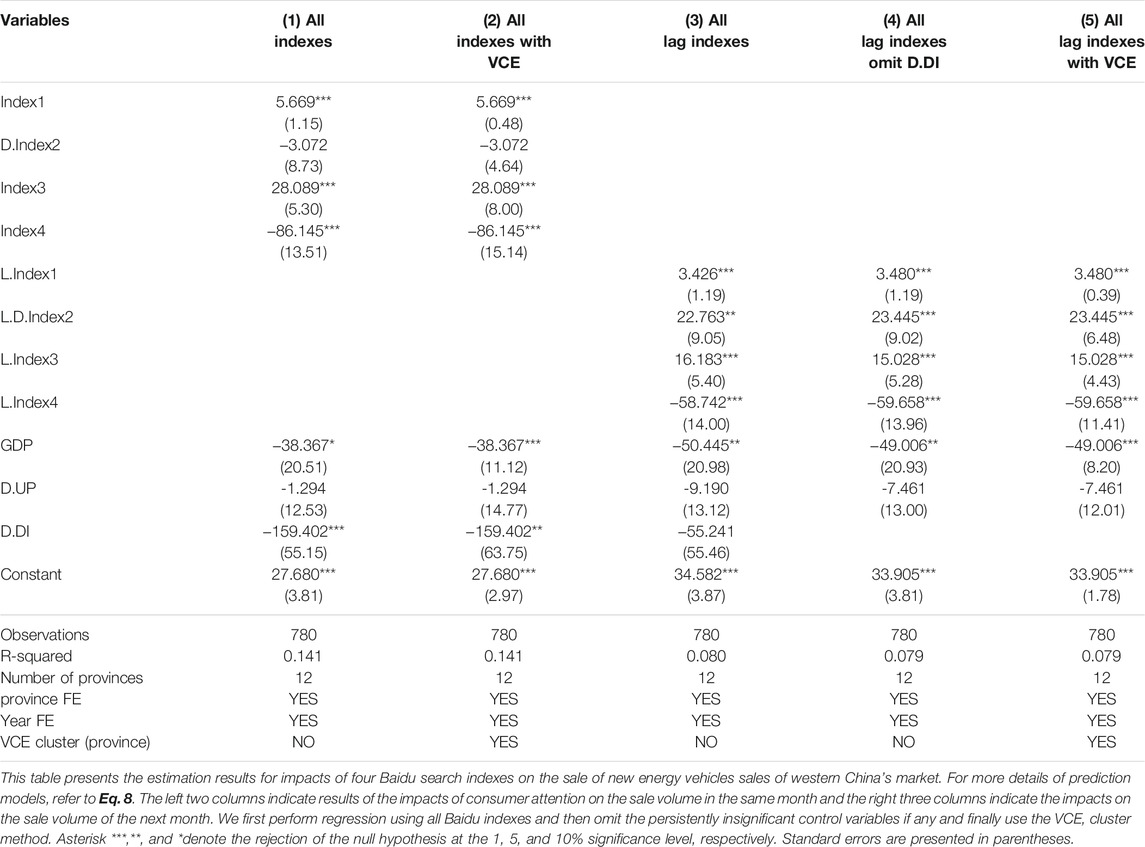
TABLE 8. Model estimation results using Baidu search index regarding the west district of China.
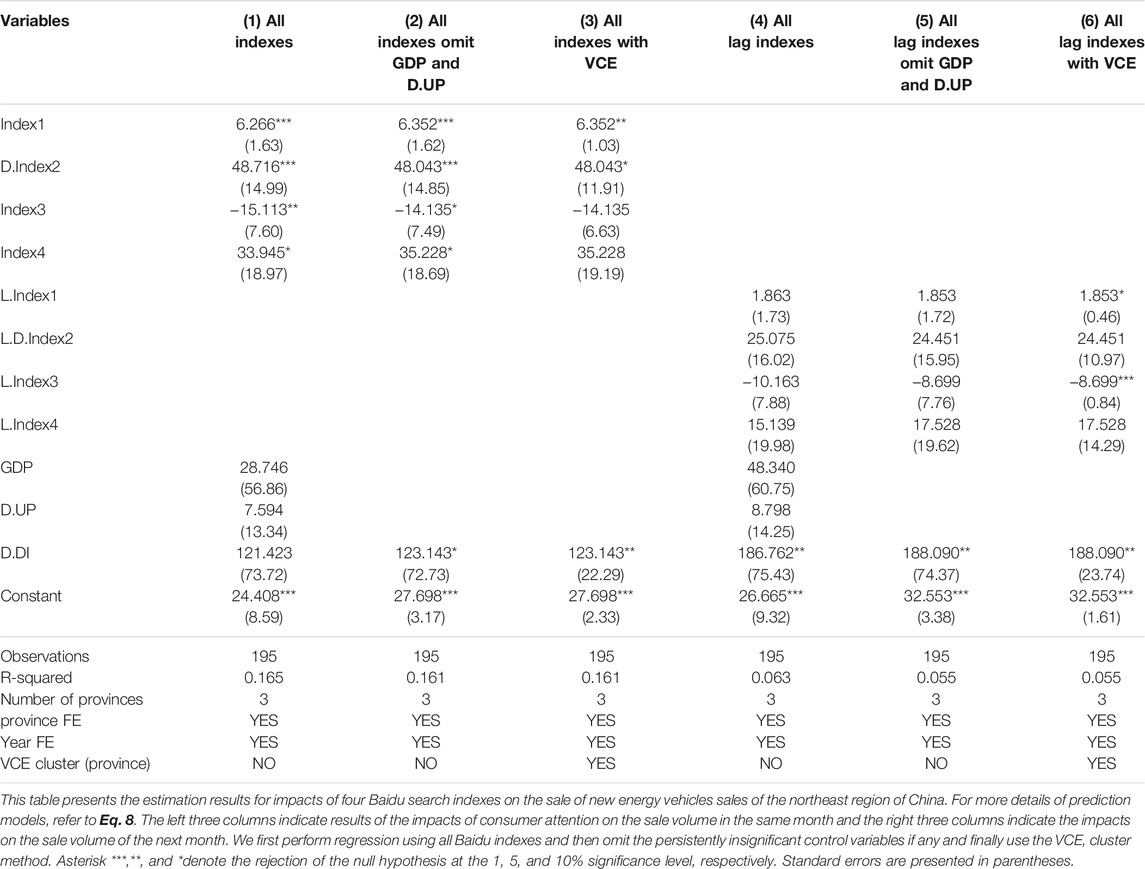
TABLE 9. Model estimation results using Baidu search index regarding the northeast area of China.
With the development of modern industry in China, eastern China has become the most economically developed region and the infrastructure construction in this area is also of the highest level in China. The three largest urban agglomerations in China, the Beijing-Tianjin-Hebei Region, the Yangtze River Delta, and the Pearl River Delta, are all located in eastern China. According to China’s seventh national census, the population in eastern China accounted for 39.93 percent. As illustrated in Table 6, the search trend of ‘new energy vehicle’, and ‘new energy vehicle battery’ both have significant positive impacts on the sales of new energy vehicles while ‘charging pile’, and ‘automobile spontaneous combustion’ are not significant.
The central region of China is consists of six provinces. Because it is located inland, the development level of the central region is not balanced, and the level of economic openness is not as good as that of the eastern region. At present, the economic development level of the central region is lower than that of the eastern economic zone while higher than that of the western economic zone, but the growth rate of economic development is lower than that of west China. As shown in Table 7, the search trends of ‘charging pile’, ‘new energy vehicle battery’, and ‘automobile spontaneous combustion’ all have significant impacts on the sales of new energy vehicles of the next month. It should be noted that the attention of ‘automobile spontaneous combustion’ is negatively correlated with the sales indicating consumers in the central region of China is more sensitive to the new energy vehicles accidents.
Western China generally lags behind central and eastern China. It accounts for 70 percent of the country’s land area and about 29 percent of the total population. Due to the terrain and climate conditions in western China, although the area is vast, the population density is relatively sparse, which magnifies the mileage problem of new energy vehicles. At the same time, the energy resources in western China are abundant and the electricity cost is low, which provides favorable conditions for the application of new energy vehicles. As shown in Table 8, the search trend of ‘new energy automobile’, ‘new energy vehicle battery’, and ‘automobile spontaneous combustion’ all have significant impacts on the sales of new energy vehicles of the next month. The attention of ‘automobile spontaneous combustion’ is also negatively correlated with the sales, which is similar to the facts of the central region of China.
The Northeast region of China is an old industrial area in China, but its economy develops slowly in recent years and is in a period of economic transition. According to the result presented in Table 9, we found that most of the variables were not significant. We believed that this is because the overall sample was too small and overall sales volume was only in the hundreds. The climate in Northeast China was not suitable for the use of new energy vehicles could be one of the possible reasons.
5 Discussion and Conclusion
Exploring the impacts of consumer attention to different aspects of new energy vehicles on the sale volume can provide effective information for the promotion of new energy vehicles. Accordingly, we use four representative Baidu search indexes, ‘new energy vehicle’, ‘new energy vehicles battery’, ‘charging pile’, and ‘automobile spontaneous combustion’, as variables representing the attention of consumers and adopt variables of economic, population, and residents income as control variables for regression analysis. We first analyzed the data of the whole China’s new energy vehicle market and found that search amounts of ‘new energy automobile’, ‘new energy vehicle battery’, and ‘charging pile’ have significant positive impacts on the new energy vehicle sales while the term of ‘automobile spontaneous combustion’ has a significant negative impact. To address the problem of endogeneity and consider the likelihood that consumers may make longer purchase decisions, we also used the lagging term of Baidu indexes for regressions and the results are in line with the conclusions from models using same month indexes.
Given the unbalanced regional development in China, we perform the regressions using the data of four major economic regions with different development levels respectively. In our subregional study, we found some interesting results. First, the search index of ‘charging pile’ has no significant impact on the sales of new energy vehicles in the economically developed region, specifically eastern China while in less developed areas this relationship exists, that is, more search for ‘charging pile’ mean more sales of new energy vehicles. One possible explanation is that better infrastructure and the availability of new energy charging devices in economically developed regions have made consumers less anxious about charging piles while in the less developed area, the consumers still have such concerns. Second, the search trend of ‘new energy vehicle battery’ has significant positive impacts on the sale volumes in all regions of China indicating that the efficiency of new energy vehicle batteries is still an important concern of consumers.
Another interesting finding from our study is people’s cognitive bias of excessive concerns about spontaneous combustion of new energy vehicles. Cognitive bias is an error in thinking that occurs when people are processing and interpreting information in the world around them and affects the decisions and judgments that they make (Bedi and Toshniwal, 2018). The empirical study shows that the search index of ‘auto spontaneous combustion’ has a significant negative effect on new energy vehicles sales in less developed regions, i.e. central and western China compared to eastern China indicating that the information on automobile spontaneous combustion will significantly increase people’s negative safety evaluation of new energy vehicles in certain areas. This concern about the spontaneous combustion of new energy vehicles may be exaggerated by the related news because the news of the spontaneous combustion of traditional fuel vehicles is not as attractive as that of new energy vehicles, although the spontaneous combustion rate of traditional fuel vehicles is higher than that of new energy vehicles. In fact, according to the “Travel Big Data Report of Small Pure Electric Passenger Vehicles” released by “National Big Data Alliance for New Energy Vehicles” in20204, the spontaneous combustion probability of domestic new energy vehicles in 2019 was 0.0049% and in 2020, the probability dropped to 0.0026%. On the other hand, according to data released by the Departments of the Public Security of China, the annual spontaneous combustion rate of traditional fuel vehicles in 2020 was about 0.01–0.02%, significantly greater than that of new energy vehicles. The different responses to spontaneous combustion of new energy vehicles between central as well as western regions, and eastern regions also reflect that this cognitive bias may be related to the level of economic development. People in economically developed regions are less likely to produce such cognitive bias.
This study provides some useful implications for the promotion of new energy vehicles. First, battery performance and charging devices are very important factors when consumers decide whether to buy new energy vehicles. Accordingly, how to improve the range and charging convenience should be the first thing that automobile manufacturers need to solve. Second, the safety of new energy vehicles should be more publicized, so that the cognitive bias that new energy vehicles are more prone to spontaneous combustion can be appropriately alleviated.
This study has several limitations that bode well for future research opportunities. First, as Baidu only provides search index information for specific keywords, some search terms related to new energy vehicles that do not appear in the search database may also provide interesting findings. Therefore, we can further study the impact of consumer attention on new energy vehicles through other proxies. Second, since relevant Baidu search terms can have an impact on the sales of new energy vehicles, we can try to predict the sales by integrating these indexes to provide effective information for new energy vehicle manufacturers and the government. Last, the potential relationship between economic development level and cognitive bias needs to be further demonstrated through social empirical research.
Data Availability Statement
The raw data supporting the conclusion of this article will be made available by the authors, without undue reservation.
Author Contributions
ZJ carried out methodology, coded, and wrote the original manuscript YL collected the data did the review and edition LZ acquired the fund and did the thesis modification.
Funding
Research reported in this publication was supported by funding from the National Natural Science Foundation of China (No. 72071194).
Conflict of Interest
The authors declare that the research was conducted in the absence of any commercial or financial relationships that could be construed as a potential conflict of interest.
Publisher’s Note
All claims expressed in this article are solely those of the authors and do not necessarily represent those of their affiliated organizations, or those of the publisher, the editors and the reviewers. Any product that may be evaluated in this article, or claim that may be made by its manufacturer, is not guaranteed or endorsed by the publisher.
Footnotes
2https://gs.statcounter.com/search-engine-market-share/all/china
3The information is found in http://www.stats.gov.cn/ztjc/zthd/sjtjr/dejtjkfr/tjkp/201106/t20110613_71947.htm.
4The official website of “National Big Data Alliance for New Energy Vehicles” is http://www.ndanev.com/.
References
Akalamkam, K., and Mitra, J. K. (2018). Consumer Pre-purchase Search in Online Shopping: Role of Offline and Online Information Sources. Business Perspect. Res. 6 (1), 42–60. doi:10.1177/2278533717730448
Bedi, J., and Toshniwal, D. (2018). Empirical Mode Decomposition Based Deep Learning for Electricity Demand Forecasting. IEEE Access 6, 49144–49156. doi:10.1109/access.2018.2867681
Berkeley, N., Jarvis, D., and Jones, A. (2018). Analysing the Take up of Battery Electric Vehicles: An Investigation of Barriers Amongst Drivers in the UK. Transportation Res. D: Transport Environ. 63, 466–481. doi:10.1016/j.trd.2018.06.016
Egbue, O., and Long, S. (2012). Barriers to Widespread Adoption of Electric Vehicles: An Analysis of Consumer Attitudes and Perceptions. Energy Policy 48, 717–729. doi:10.1016/j.enpol.2012.06.009
Egnér, F., and Trosvik, L. (2018). Electric Vehicle Adoption in Sweden and the Impact of Local Policy Instruments. Energy Policy 121, 584–596. doi:10.1016/j.enpol.2018.06.040
Fritzsch, B., Wenger, K., Sibbertsen, P., and Ullmann, G. (2020). Can Google Trends Improve Sales Forecasts on a Product Level. Appl. Econ. Lett. 27 (17), 1409–1414. doi:10.1080/13504851.2019.1686110
Funke, S. Á., Sprei, F., Gnann, T., and Plötz, P. (2019). How Much Charging Infrastructure Do Electric Vehicles Need? A Review of the Evidence and International Comparison. Transportation Res. Part D: Transport Environ. 77, 224–242. doi:10.1016/j.trd.2019.10.024
Geva, T., Oestreicher-Singer, G., Efron, N., and Shimshoni, Y. (2015). Using Forum and Search Data for Sales Prediction of High-Involvement Products. Tomer Geva, Gal Oestreicher-Singer, Niv Efron, Yair Shimshoni. MIS Q. 41, 65–82. doi:10.25300/MISQ/2017/41.1.04
Guo, J., Zhang, X., Gu, F., Zhang, H., and Fan, Y. (2020). Does Air Pollution Stimulate Electric Vehicle Sales? Empirical Evidence from Twenty Major Cities in China. J. Clean. Prod. 249, 119372. doi:10.1016/j.jclepro.2019.119372
Hao, Y., Dong, X. Y., Deng, Y. X., Li, L. X., and Ma, Y. (2016). What Influences Personal Purchases of New Energy Vehicles in China? an Empirical Study Based on a Survey of Chinese Citizens. J. Renew. Sust. Energ. 8 (6), 065904. doi:10.1063/1.4966908
Hausman, J. A. (1978). Specification Tests in Econometrics. Econometrica 46, 1251–1271. doi:10.2307/1913827
Higueras-Castillo, E., Molinillo, S., Coca-Stefaniak, J. A., and Liebana-Cabanillas, F. (2020). Potential Early Adopters of Hybrid and Electric Vehicles in Spain-Towards a Customer Profile. Sustainability 12 (11), 4345. doi:10.3390/su12114345
Hill, G., Heidrich, O., Creutzig, F., and Blythe, P. (2019). The Role of Electric Vehicles in Near-Term Mitigation Pathways and Achieving the UK's Carbon Budget. Appl. Energ. 251, 113111. doi:10.1016/j.apenergy.2019.04.107
Im, K. S., Pesaran, M. H., and Shin, Y. (2003). Testing for Unit Roots in Heterogeneous Panels. J. Econom. 115 (1), 53–74. doi:10.1016/s0304-4076(03)00092-7
Javid, R. J., and Nejat, A. (2017). A Comprehensive Model of Regional Electric Vehicle Adoption and Penetration. Transport Policy 54, 30–42. doi:10.1016/j.tranpol.2016.11.003
Jenn, A., Azevedo, I. L., and Ferreira, P. (2013). The Impact of Federal Incentives on the Adoption of Hybrid Electric Vehicles in the United States. Energ. Econ. 40, 936–942. doi:10.1016/j.eneco.2013.07.025
Kester, J., Noel, L., Zarazua de Rubens, G., and Sovacool, B. K. (2018). Policy Mechanisms to Accelerate Electric Vehicle Adoption: a Qualitative Review from the Nordic Region. Renew. Sust. Energ. Rev. 94, 719–731. doi:10.1016/j.rser.2018.05.067
Kim, Y., and Jun, C. H. (2010). A New Approach to Unit Root Testing of Panel Data. Seoul, South Korea: Korea Inst. Ind. Eng., 1462–1469.
Langbroek, J. H. M., Franklin, J. P., and Susilo, Y. O. (2016). The Effect of Policy Incentives on Electric Vehicle Adoption. Energy Policy 94, 94–103. doi:10.1016/j.enpol.2016.03.050
Levin, A., Lin, C.-F., and James Chu, C.-S. (2002). Unit Root Tests in Panel Data: Asymptotic and Finite-Sample Properties. J. Econom. 108 (1), 1–24. doi:10.1016/s0304-4076(01)00098-7
Liao, F., Molin, E., Timmermans, H., and van Wee, B. (2019). Consumer Preferences for Business Models in Electric Vehicle Adoption. Transport Policy 73, 12–24. doi:10.1016/j.tranpol.2018.10.006
Ma, S.-C., Fan, Y., and Feng, L. (2017). An Evaluation of Government Incentives for New Energy Vehicles in China Focusing on Vehicle Purchasing Restrictions. Energy Policy 110, 609–618. doi:10.1016/j.enpol.2017.07.057
Ma, S.-C., Fan, Y., Guo, J.-F., Xu, J.-H., and Zhu, J. (2019). Analysing Online Behaviour to Determine Chinese Consumers' Preferences for Electric Vehicles. J. Clean. Prod. 229, 244–255. doi:10.1016/j.jclepro.2019.04.374
Maheshwari, P., Seth, N., and Gupta, A. K. (2016). An Empirical Approach to Consumer Buying Behavior in Indian Automobile Sector. Ind. Commercial Train. 48 (3), 156–162. doi:10.1108/ict-09-2015-0061
Mersky, A. C., Sprei, F., Samaras, C., and Qian, Z. (2016). Effectiveness of Incentives on Electric Vehicle Adoption in Norway. Transportation Res. Part D: Transport Environ. 46, 56–68. doi:10.1016/j.trd.2016.03.011
Mitchell, V. W., and Prince, G. (1993). Retailing to Experienced and Inexperienced Consumers: A Perceived Risk Approach. West Yorkshire, UK: International Journal of Retail & Distribution Management.
Mock, P., and Yang, Z. (2014). Driving Electrification: A Global Comparison of Fiscal Incentive Policy for Electric vehiclesICCT, the Internationa council on Clean Transportation.
Needell, Z. A., McNerney, J., Chang, M. T., and Trancik, J. E. (2016). Potential for Widespread Electrification of Personal Vehicle Travel in the United States. Nat. Energ. 1 (9), 16112. doi:10.1038/nenergy.2016.112
Nie, Y., Ghamami, M., Zockaie, A., and Xiao, F. (2016). Optimization of Incentive Polices for Plug-In Electric Vehicles. Transportation Res. B: Methodological 84, 103–123. doi:10.1016/j.trb.2015.12.011
Noel, L., Zarazua de Rubens, G., Sovacool, B. K., and Kester, J. (2019). Fear and Loathing of Electric Vehicles: The Reactionary Rhetoric of Range Anxiety. Energ. Res. Soc. Sci. 48, 96–107. doi:10.1016/j.erss.2018.10.001
Palmer, K., Tate, J. E., Wadud, Z., and Nellthorp, J. (2018). Total Cost of Ownership and Market Share for Hybrid and Electric Vehicles in the UK, US and Japan. Appl. Energ. 209, 108–119. doi:10.1016/j.apenergy.2017.10.089
Priessner, A., Sposato, R., and Hampl, N. (2018). Predictors of Electric Vehicle Adoption: An Analysis of Potential Electric Vehicle Drivers in Austria. Energy Policy 122, 701–714. doi:10.1016/j.enpol.2018.07.058
Ruohonen, J., and Hyrynsalmi, S. (2017). Evaluating the Use of Internet Search Volumes for Time Series Modeling of Sales in the Video Game Industry. Electron. Markets 27 (4), 351–370. doi:10.1007/s12525-016-0244-z
Soltani-Sobh, A., Heaslip, K., Stevanovic, A., Bosworth, R., and Radivojevic, D. (2017). Analysis of the Electric Vehicles Adoption over the United States. Transportation Res. Proced. 22, 203–212. doi:10.1016/j.trpro.2017.03.027
Sovacool, B. K., Abrahamse, W., Zhang, L., and Ren, J. (2019). Pleasure or Profit? Surveying the Purchasing Intentions of Potential Electric Vehicle Adopters in China. Transportation Res. A: Pol. Pract. 124, 69–81. doi:10.1016/j.tra.2019.03.002
Spangher, L., Gorman, W., Bauer, G., Xu, Y., and Atkinson, C. (2019). Quantifying the Impact of U.S. Electric Vehicle Sales on Light-Duty Vehicle Fleet CO2 Emissions Using a Novel Agent-Based Simulation. Transportation Res. Part D: Transport Environ. 72, 358–377. doi:10.1016/j.trd.2019.05.004
Sun, H., Geng, Y., Hu, L., Shi, L., and Xu, T. (2018). Measuring China's New Energy Vehicle Patents: A Social Network Analysis Approach. Energy 153, 685–693. doi:10.1016/j.energy.2018.04.077
Thomas, C. E. (2009). Fuel Cell and Battery Electric Vehicles Compared. Int. J. Hydrogen Energ. 34 (15), 6005–6020. doi:10.1016/j.ijhydene.2009.06.003
Wachter, P., Widmer, T., and Klein, A. (2019). “Predicting Automotive Sales Using Pre-purchase Online Search Data,” in 2019 Federated Conference on Computer Science and Information Systems (FedCSIS), Leipzig, Germany, 1-4 Sept. 2019 (IEEE). doi:10.15439/2019F239
Wang, L., Fu, Z. L., Guo, W., Liang, R. Y., and Shao, H. Y. (2020). What Influences Sales Market of New Energy Vehicles in China? Empirical Study Based on Survey of Consumers' purchase Reasons. Energy Policy 142, 111484. doi:10.1016/j.enpol.2020.111484
Wang, N., Tang, L., and Pan, H. (2019). A Global Comparison and Assessment of Incentive Policy on Electric Vehicle Promotion. Sust. Cities Soc. 44, 597–603. doi:10.1016/j.scs.2018.10.024
Wu, Y. A., Ng, A. W., Yu, Z., Huang, J., Meng, K., and Dong, Z. Y. (2021). A Review of Evolutionary Policy Incentives for Sustainable Development of Electric Vehicles in China: Strategic Implications. Energy Policy 148, 111983. doi:10.1016/j.enpol.2020.111983
Yang, Z., and Zhang, C. (2020). “Automobile Sales Forecast Based on Web Search and Social Network Data,” in 2020 The 11th International Conference on E-business, Management and Economics, Beijing, China, July 15–17, 2020 (Beijing, China: Association for Computing Machinery), 37–41. doi:10.1145/3414752.3414759
Zarazua de Rubens, G. (2019). Who Will Buy Electric Vehicles after Early Adopters? Using Machine Learning to Identify the Electric Vehicle Mainstream Market. Energy 172, 243–254. doi:10.1016/j.energy.2019.01.114
Keywords: new energy vehicle, consumer attention, sale volume, cognitive bias, search trend
Citation: Jiang Z, Long Y and Zhang L (2021) How Does the Consumers’ Attention Affect the Sale Volumes of New Energy Vehicles: Evidence From China’s Market. Front. Energy Res. 9:782992. doi: 10.3389/fenrg.2021.782992
Received: 25 September 2021; Accepted: 27 October 2021;
Published: 08 December 2021.
Edited by:
Quande Qin, Shenzhen University, ChinaReviewed by:
Huaping Sun, Jiangsu University, ChinaHongyan Zhang, China University of Petroleum (Huadong), China
Copyright © 2021 Jiang, Long and Zhang. This is an open-access article distributed under the terms of the Creative Commons Attribution License (CC BY). The use, distribution or reproduction in other forums is permitted, provided the original author(s) and the copyright owner(s) are credited and that the original publication in this journal is cited, in accordance with accepted academic practice. No use, distribution or reproduction is permitted which does not comply with these terms.
*Correspondence: Lingling Zhang, zhangll@ucas.ac.cn