- 1Guangzhou Institute of Energy Conversion, Chinese Academy of Sciences, Guangzhou, China
- 2Guangdong Provincial Key Laboratory of New and Renewable Energy Research and Development, Guangzhou, China
The hydrate decomposition kinetics is a key factor for the gas production from hydrate-saturated porous media. Meanwhile, it is also related to other factors. Among them, the permeability and hydrate dissociation surface area on hydrate dissociation kinetics have been studied experimentally and numerically in this work. First, the permeability to water was experimentally determined at different hydrate saturations (0%, 10%, 17%, 21%, 34%, 40.5%, and 48.75%) in hydrate-bearing porous media. By the comparison of permeability results from the experimental measurements and theoretical calculations with the empirical permeability models, it was found that, for the lower hydrate saturations (less than 40%), the experimental results of water permeability are closer to the predicted values of the grain-coating permeability model, whereas, for the hydrate saturation above 40%, the tendencies of hydrate accumulation in porous media are quite consistent with the pore-filling hydrate habits. A developed two-dimensional core-scale numerical code, which incorporates the models for permeability and hydrate dissociation surface area along with the hydrate accumulation habits in porous media, was used to investigate the kinetics of hydrate dissociation by depressurization, and a “shrinking-core” hydrate dissociation driven by the radial heat transfer was found in the numerical simulations of hydrate dissociation induced by depressurization in core-scale porous media. The numerical results indicate that the gas production from hydrates in porous media has a strong dependence on the permeability and hydrate dissociation surface area. Meanwhile, the simulation shows that the controlling factor for the dissociation kinetics of hydrate switches from permeability to hydrate dissociation surface area depending on the hydrate saturation and hydrate accumulation habits in porous media.
1 Introduction
Gas hydrates (GHs) are ice-like chemical compounds formed by small “guest” gas molecules, such as CH4 or CO2, and water at the suitable environmental conditions of pressure and temperature (Sloan, 2003). They could play a major role in energy and environment fields because of their huge hydrocarbon gas reserves in nature and high gas storage capacity (Kumar et al., 2013). It is known that one cubic volume of GH (S.T.P) can store about 164 m3 of gas (Boswell and Collett, 2011), which represents a very attractive advantage in the application of CO2 capture and storage (CCS) and carbon sequestration. One of the proposed interesting applications is to recovery methane by carbon dioxide replacement from GHs (Goel, 2006; Zhao et al., 2012; Xu et al., 2015; Li et al., 2016; Wang X. et al., 2020). This production method is deemed to be the most environment-friendly and safety scheme for the methane hydrate exploitation (Ohgaki et al., 1996). It is believed that CH4 gases were produced by CO2 injection, and simultaneously, the CO2 was sequestered and stored as CO2 hydrate in hydrate reservoir, which also maintains the stability of the pore structure and reservoir (Lin et al., 2020). However, both the commercial methane hydrate exploitation and CO2 sequestration in the form of CO2 hydrate have not yet been feasible. One of the reason is that our knowledge of hydrate dissociation kinetics and fluid flow in porous media are still limited, which also occurs in the application of CO2 injection in sediments for CCS (Hoteit et al., 2019; Gauteplass et al., 2020). During CO2 injection in geological formations (e.g., depleted gas reservoirs), hydrates may form in the near-wellbore under moderate thermodynamic conditions, causing the flow blockage in porous media and permeability reduction (Gauteplass et al., 2020). Therefore, understanding the hydrate formation, the dissociation, and the impact on permeability is also crucial for CO2 injection and storage in sediments.
Compared with the productions of other conventional fossil fuels, the methane gas production from hydrate reservoir should make hydrate in situ dissociation and ensure the safety and stability of reservoir. Generally, the hydrate dissociation in porous media is controlled by dissociation reaction kinetics (Kim et al., 1987; Hong et al., 2003; Tang et al., 2007; Yin et al., 2020), heat and mass transfer (Selim and Sloan, 1989; Tonnet and Herri, 2009; Konno et al., 2014; Chen et al., 2017; Wan et al., 2020; Yin et al., 2020; Li et al., 2021), and fluid flow (Yousif et al., 1990; Moridis, 2004; Tang et al., 2007; Kumar et al., 2010; Yu et al., 2021). It is considered that different control mechanisms are coupling, and any of the abovementioned mechanisms (mechanisms discussed above) could be the dominating factor in the gas production process according to the scale and properties of hydrate-bearing sediments (Tang et al., 2007; Tonnet and Herri, 2009; Kumar et al., 2013; Wang Y.-F. et al., 2020; Ruan et al., 2021). For instance, Tang et al. (Tang et al., 2007) reported that the dissociation kinetics of hydrate is the main controlling mechanism during the core-scale hydrate production experiments. Their numerical results simulated by Tough + Hydrate simulator also indicated that, in the field scale hydrate-bearing reservoir (HBR), the fluid flow becomes the dominant factor for gas production from HBR. The results revealed that the process of hydrate dissociation and gas production in porous media is complex, and the knowledge of dissociation characteristics in hydrate-bearing porous media is still not completely understood.
The hydrate dissociation kinetics plays a critically important role in the prediction of gas production potential and gas production strategy (Ruan et al., 2021). However, according to the literatures, the studies that examined the hydrate dissociation kinetics in porous media are limited. To obtain more abundant research results on kinetics characteristics is required for the assessment of gas production from HBR. Kim et al. (1987) first studied the kinetics of hydrate dissociation in a batch reactor; the experimental results showed that the dissociation rate was the relationship with the hydrate surface area and the difference in the fugacity of methane at the equilibrium pressure (Pe) and the decomposition pressure. Yousif et al. (1991) reported the kinetics behavior and fluid flow in porous media for the depressurization-induced hydrate dissociation and gas production under the isothermal conditions. Kneafsey et al. (2007) performed CT experiments to investigate the kinetics of hydrate dissociation in partially saturated sand. Some important kinetic parameters for hydrate dissociation in porous media were obtained by their experimental tests. Kerkar et al. (2013) studied the kinetics of methane hydrate dissociation induced by stepwise depressurization at a constant temperature; the effects of effective pressure and temperature on the dissociation kinetics also were analyzed. In the pilot-scale experimental investigation of Tang et al. (2007), it is worth noting that the intrinsic dissociation constant in the condition of porous media is much lower than that of the bulk hydrate dissociation. The difference could be attributed to the heat and mass transfer effect on hydrate dissociation in porous media. Similarly, the abovementioned experiments on the kinetics of hydrate dissociation by depressurization in a porous medium were carried out under the isothermal conditions, which could eliminate the heat transfer resistances. In addition, Kono et al. (2002) experimentally obtained the rates of hydrate depressurization-induced dissociation in sediments with different particle sizes and derived the mathematical expression for kinetic dissociation rate, which included the coupling effect of heat and mass transfer, and intrinsic kinetics dissociation reaction. More interesting, their study also indicated that the dissociation rate could be obviously affected by different sediment particle sizes. In other words, sediment properties can significantly affect the dissociation kinetics of GHs. Meanwhile, there have also been several numerical investigations focusing on the hydrate dissociation kinetics in a porous medium. Hong et al. (2003) presented an analytical work on depressurization-induced hydrate dissociation and reported that the influence of fluid flow to hydrate decomposition is much less than those of heat transfer and intrinsic kinetics. Nazridoust and Ahmadi (2007) proposed an axisymmetric model to study the hydrate dissociation in a porous medium of sandstone; the dissociation kinetics and gas–water flow were simulated numerically. Their numerical results indicated that hydrate dissociation rate is related to physical and thermal conditions of hydrate-bearing core sample; the porosity and permeability have an essential impact on hydrate dissociation. More recently, a one-dimensional (1D) numerical simulation on hydrate dissociation with a deep depressurization method reported that the fluid flow and hydrate dissociation kinetics have a significant influence on gas and water production from GHs above the freezing point (Jin et al., 2019). In view of the observations mentioned above, it could be concluded that the kinetics of hydrate dissociation is an essential factor affecting the gas production. Meanwhile, it is also related to other factors.
In this work, a series of absolute permeability experiments with different hydrate saturations was first carried out in artificial hydrate-bearing glass beads, and then, on the basis the results of permeability experiments with that obtained from permeability model, the hydrate morphology in porous media would be inferred. Subsequently, a two-dimensional (2D) core-scale numerical code, which incorporates the models for permeability and hydrate dissociation surface area along with the hydrate accumulation habits in porous media, was used to investigate the kinetics of hydrate dissociation by depressurization in a porous medium. Last, the simulation results of temperature, pressure, hydrate saturation, and gas production from hydrate dissociation were drawn based on the proven and prescriptive model. The effects of permeability and hydrate dissociation surface area on the dissociation kinetics of hydrate also were numerically studied.
2 Experimental Investigation
2.1 Instruments and Materials
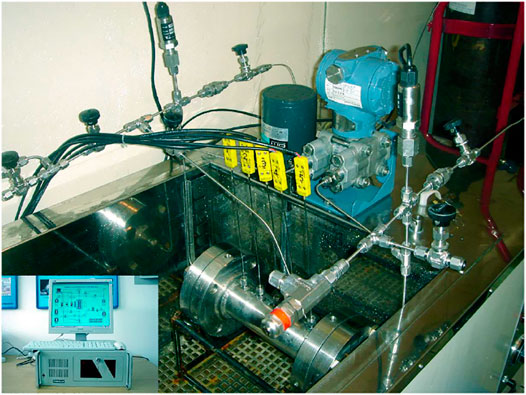
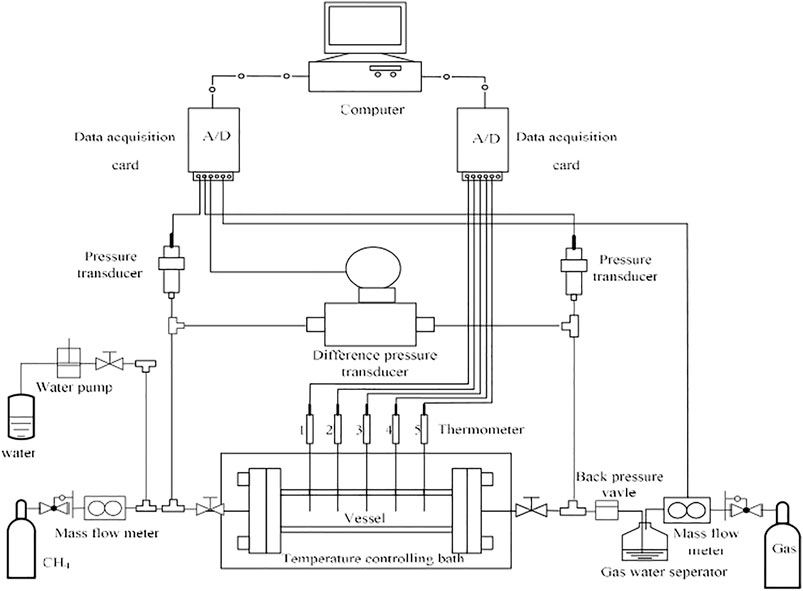
In this study, a 316 stainless steel high pressure cylinder cell with an inner volume of 153 ml (as shown in Figure 1) was used, in which the hydrate dissociation kinetics and permeability measurement could be conducted. The maximum pressure of the cell is 20 MPa. A plunger pump was employed to inject water into the cell for hydrate formation and permeability measurement. A back pressure valve was applied to keep the system pressure at a constant pressure by releasing extra water or gas. To maintain a stable low-temperature condition and reduce the influence of heat transfer from surrounding environment, the cell was situated in a low-temperature and temperature-controlled glycol bath. Five type E thermocouples with a measurement uncertainty of ±0.1°C and two pressure transducers with the uncertainty of ±0.01 MPa were connected to the reactor. The digital signals of temperature and pressure from the thermocouples and pressure transducers were acquired by an A/D module (Advantech Co., Ltd.) and saved in the Monitor and Control Generated System. The glass beads of BZ-01 (AS-One Co., Ltd., Japan) with diameter of 0.105–0.125 mm were filled in the high pressure cell to form a porous medium with high-permeability, in which the investigation of GHs dissociation kinetics could be conducted with the elimination of the effects caused by the heat/mass transfer and fluid flow (Kumar et al., 2013). The porosity of glass beads was determined to be 35.4%, which was kept to stay the same for the all following experiments. The CH4 gas (99.999%, in purity) was used for the following experiments, and the deionized water was adopted in all tests. The experiment system in this work was mainly composed of four parts: the gas/water injection system, the high pressure reaction cell with low temperature-controlled system, the separation and collection system for gas and water, and the data monitoring and acquisition system (as shown in Figure 2). The specific introduction of the experimental apparatus could be found in detail in the previous publications (Yang et al., 2013a; Yang et al., 2013b; Chen et al., 2018; Ruan and Li, 2021).
2.2 Experimental Procedure
The whole experimental procedure for all tests in this study could be performed with three steps: first, the hydrate formed in the glass beads sample; then, the permeability measurements were conducted; and last, the depressurization experiments for hydrates dissociation were implemented. The details of experimental procedure are presented in the following.
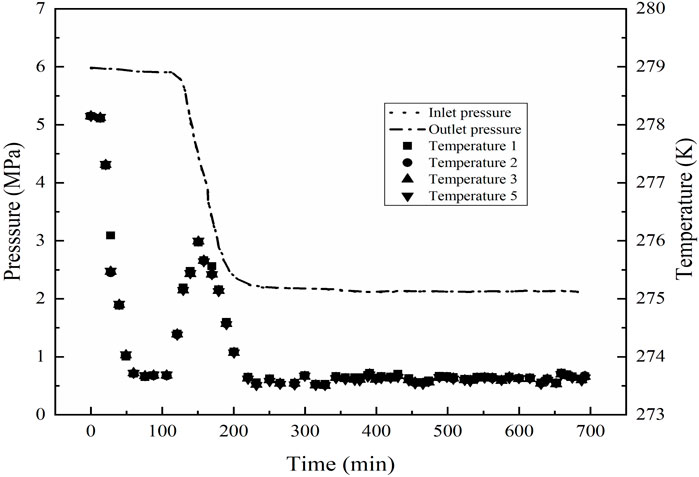
First, according to the required initial water saturations, the glass beads were thoroughly saturated with different volumes of de-ionized water and then were packed into the reactor. The experimental apparatus was left for hours, so that the water could distribute evenly in glass beads, and the pressure and temperature of system could become gradually stabilized. During the above whole process, the bath temperature was kept at a constant temperature of 292.15 K. Once no leakage occurred in all of the system, the residual air remaining in the reactor was sucked away by a vacuum pump, then CH4 gas was injected into the high pressure cell at a pressure of 6 MPa, and the system was cooled to 273.7 K below the anticipated hydrate-forming temperature. Here, the higher supercooling degree (i.e., the difference between the actual operating temperature and equilibrium temperature (Englezos, 1993; DuQuesnay et al., 2016), which has a critical impact on the reaction of hydrate formation as a form of driving force (Yang et al., 2012; Yang et al., 2014; Liu et al., 2019)), provides a stronger driving force and makes hydrate formation easier and faster to achieve. As seen from Figure 3, when the GHs began to form, a sudden and rapid increase in the temperature could be observed, and, in turn, the system pressure could be found to also be decreased gradually. The system stayed under the formation conditions of GHs for a period of time until the system pressure and temperature do not change to ensure the complete of hydrate formation. The hydrate saturation (Sh) could be calculated based on the data of pressure and temperature. The detailed determination of Sh would be displayed in the section of Supplementary Appendix SA1: Calculation of hydrate saturation.
To avoid the dissociation of hydrate in the measurement process of permeability to water, the temperature of the injected fluid was required to be consistent with the temperature of hydrate-saturated reactor, a long enough (about 3 m) coiled water injection pipeline was used, the deionized water sample used to injection was first mixed and saturated with methane gas by stirring the water vigorously for about 15 min in a water tank, and then the water tank filled with the mixing of water and gas and the coiled water injection pipeline were immersed in the low-temperature (273.7 K) glycol bath for 20–30 min. To commence the permeability measurement, the water tank and the coiled pipeline were connected with the experimental system, the back pressure and the pressure of water flood injection pump were adjusted accordingly (much higher than the equilibrium pressure of GHs in glass beads), the mixture of de-ionized water and dissolved methane gas were injected with a constant flow rate into the reactor and to measure the permeability with different hydrate saturations, which ensured that there would be very limited GHs dissociation during permeability measurement (Li et al., 2017; Chen et al., 2018).
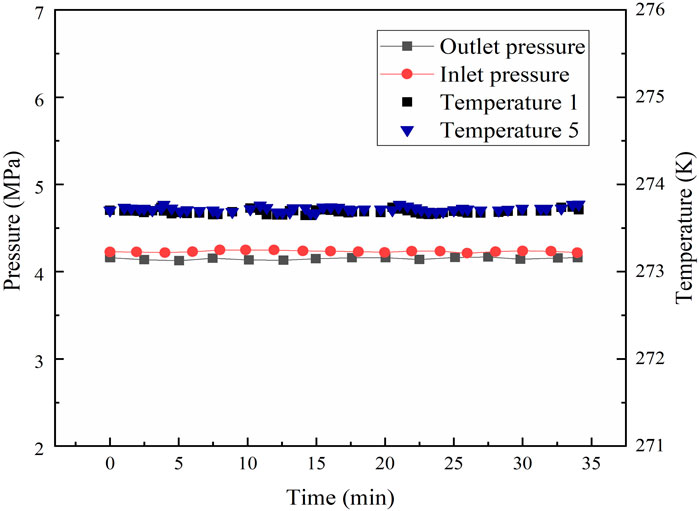
In the whole permeability experiments, the pressure and temperature of the reactor were monitored and collected by a monitor and control generated system. Figure 4 shows the variations in the pressure and temperature of the Run 4 permeability experiment for Sh = 21%. As seen in Figure 4, the pressure and temperature of the system maintained nearly steady, and there were no obvious sharp fluctuations during water permeability measurement, which indicated that the amount of hydrate formed or decomposed could be ignored. The water permeability of artificial hydrate-bearing glass beads was investigated with different hydrate saturations using the Darcy’s law, and the experimental conditions and results are presented in Table 1.
Last, to implement the experiments of hydrate dissociation by depressurization, the back pressure regulator was opened, and the system pressure was dropped below the Pe. As the methane hydrates in the glass beads dissociated, the gas generated and water flowed to the outlet and were collected by gas/water collection system. Meanwhile, all the production behaviors of hydrate kinetic dissociation are dynamically recorded and calculated. Because of the true nature of endothermic reaction for GHs dissociation, once the dissociation was initiated by the pressure drop, the temperature in the dissociation zone would decrease rapidly and then reached the lowest temperature. After that, the system temperature rose to the initial temperature as the heat supplied from the bath with a constant temperature.
3 Numerical Model
A 2D numerical simulator of hydrate dissociation was modified and adopted to implement the investigation of hydrate dissociation kinetics, and more detailed equations can be found in our published literatures (Ruan et al., 2012a; Ruan et al., 2012b; Ruan et al., 2017; Ruan and Li, 2021). The main mechanisms including the hydrate decomposition reaction kinetics, gas–liquid fluid flow, and heat and mass transfer are all considered in this simulator. In the following section, we will pay more attention on the discussion of permeability, hydrate saturation, and dissociation kinetics with numerical models.
3.1 Equations for the Absolute Permeability
The experiments of permeability measurement and the calculation of absolute permeability K (μm2) were based on the Darcy’s law as follows:
where Q is the average fluid flow rate (m3/s), L is the length (cm) of the hydrate-bearing core sample (L = 25 cm), μ is the fluid viscosity (Pas); here, the water was used for the permeability measurement; ΔP is the pressure difference (Pa) at the inlet and outlet section of reactor; here, the cross-sectional area (cm2) of the hydrate-bearing core sample can be calculated as A = πr2 = 19.2345 cm2. 1 Darcy = 9.87 × 10⁻¹³ m2 = 0.987 μm2.
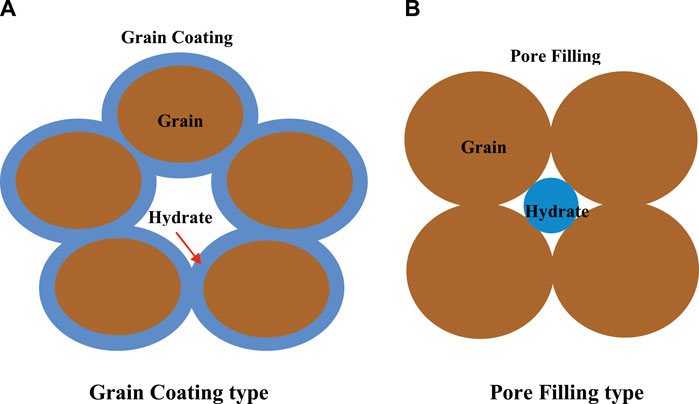
Recent published studies indicated that hydrate morphology (i.e., how hydrates accumulate in the pores and contact with sediments) and hydrate saturation have been regarded as essential factors affecting the permeability and fluid flow in hydrate-bearing porous media (Kumar et al., 2010; Li et al., 2017; Mahabadi et al., 2019; Mahabadi et al., 2016; Ren et al., 2020; Shen et al., 2020). The reduction in the permeability of hydrate-bearing sediments can be attributed to the fact that the shape and size of pores can be changed along with hydrate morphology and hydrate saturation (Kumar et al., 2010). The main accumulation habits of artificial GHs found in porous media are the grain-coating (GC) and pore-filling (PF) types (as shown in Figure 5). Meanwhile, the variation of hydrate morphology is related with hydrate saturation (Kumar et al., 2010; Liang et al., 2011; Xue et al., 2012; Ren et al., 2020). If hydrate coats the grain surface of porous media, then the influence on the porous structure and permeability reduction would be expected to be not obvious, whereas hydrate accumulation in the center of pores would reduce the pore volume and is potential to block the path for fluid-flow. Consequently, the permeability model for hydrate-bearing sediments should be expressed with the consideration of the influence of hydrate saturation and hydrate morphology.
In this study, the permeability of hydrate-bearing glass beads is represented by the following (Kleinberg et al., 2003):
Case 1 Grain-coating type
Kc is the permeability of GC hydrate-bearing sediments, K0 means the permeability of porous media without hydrate, and Sh presents the hydrate saturation. Note that there are different values that varied with hydrate saturation for the index n (for Sh > 0.8, n would be larger than 1.5; whereas 0 < Sh < 0.8, n is given as 1.5).
Case 2 Pore-filling type
where n = 0.7Sh +0.3.
3.2 Equations for the Hydrate Dissociation Kinetics
Exactly predicting the potential of GHs production requires a better understanding for the kinetics of GHs dissociation (Jarrar et al., 2020). Kim and Bishnoi (Kim et al., 1987) first proposed the known dissociation kinetic model for hydrate; the gas productivity of hydrate dissociation reaction was given as follows:
where
For the surface area of hydrate dissociation As, which has significant influence over the hydrate dissociation kinetics (Liu and Gamwo, 2012; Chen and Espinoza, 2018) and also is related closely to the hydrate accumulation habit in pores (Li et al., 2016; Jarrar et al., 2020; Ruan et al., 2021; Ruan and Li, 2021), only a handful of researches have been carried out for the quantitative description of the GHs dissociation surface area. Kim et al. (1987) studied the surface area based on the assumption that there is all the same particle diameter for hydrate particles in the bulk phase system. Yousif et al. (1991), Masuda et al. (1999), and Moridis et al. (2004) all have given the correlations for the computation of surface area considering the hydrate saturation. Yousif et al. (Yousif et al., 1991) defined the As using a combination of hydrate saturation, porosity, and permeability. Masuda et al. (1999) presented a formula of hydrate saturation and porosity for descripting the As. Kumar et al. (2013) and Nakayama et al. (2018) computed the As considering the influence of pore shape and the hydrate accumulation habit in pores. In addition, other detail discussions on the experimental and numerical studies of surface area for hydrate dissociation can be found in our recent studies (Ruan et al., 2021; Ruan and Li, 2021).
In this study, the computation for As was based on our recent work as in Equations 5 and 7, in which the mathematical formulation of As was linked to the porosity of sediment
Case 1 Grain-coating model
Case 2 Pore-filling model
where Ns is the number of particles per unit volume and is associated with the sediment particle diameter Dp. Here, Ns = 4 (Ruan and Li, 2021).
4 Results and Discussions
In this study, a series of permeability measurements at hydrate saturations of 0%, 10%, 17%, 21%, 34%, 40.5%, and 48.75% were conducted in the hydrate-saturated glass beads. The experimental data of hydrate formation and permeability measurements were listed in Table 1. The water permeability was calculated by the Darcy’s formula, as shown in Equation 1. The experimental results of permeability in presence of GHs were compared with the values of empirical model for permeability. The comparison results indicated that the permeability data of the glass beads with different hydrate saturations lied between the theoretical estimations of GC and PF permeability model (Kleinberg et al., 2003). In this work, a developed 2D laboratory-scale numerical code was used to investigate the production behavior and hydrate kinetic decomposition. On the basis of the different hydrate morphologies and hydrate saturations, two conceptual models of surface area proposed by our previous research (Ruan and Li, 2021) were adopted in the following numerical simulations to describe the hydrate decomposition surface area and model the hydrate kinetic decomposition by depressurization in hydrate-bearing glass beads. During the depressurization process, the outlet pressure was kept at a constant pressure of 2.84 MPa, which was below the equilibrium hydrate decomposition pressure.
4.1 Hydrate Formation and Permeability Measurement
The initial pressures of hydrate formation for Run 1 to Run 6 were 5.48–5.88 MPa, and the initial temperatures for experiments of Run 1 to Run 6 were 292.15 K. The experimental conditions were shown in Table 1. The typical pressure and temperature time evolution curves during GHs formation were shown in Figure 3. As shown in Figure 3, the inlet and outlet pressures, the temperatures at the point 1, 2, 3, and 5 were presented. The curves of temperature and pressure showed that, in a certain period of time, the temperature increased with the decrease of pressure. This phenomenon could be attributed to the fact of GHs formation. When the hydrate began to form, a lot of water would form the hydrate cages and a great quantity of gas would be consumed and encaged into the cages, which led the great decrease in the amount of gas under the isochoric and closed condition, and made the pressure drop sharply. Meanwhile, because of the exothermic nature of GHs formation, the temperature would increase briefly in the formation process. For an example, in the process of hydrate formation at Sh = 17%, the GHs formation started at the time of 75 min, the completion of hydrate formation was about at the time of 100 min. The rise in temperature was near 2.3 K, and the pressure drop was up to 3 MPa.
In the permeability experiments, the pressure difference across the vessel (as shown in Figure 2) was monitored by the differential pressure device, and the difference pressure was maintained at about 4 kPa. During the permeability measurement for hydrate-bearing glass beads, the back pressure regulator together with the water flood injection pump were used to keep a constant water flow rate for permeability measurement. The inlet/outlet pressures and the temperatures in the reactor vessel were also measured. Figure 4 shows the variations of pressure and temperature in the experimental process of measuring permeability. It can be noted that the variations of pressure and temperature were very small and nearly steady in the process of measuring permeability. It indicates that the water flow through the hydrate-bearing glass beads was steady, and there was no clear indication of hydrate formation or dissociation in the measurement process. Permeability to water in the hydrate-saturated glass beads was measured by three water flow rates at different hydrate saturations, and the experimental data of average permeability are presented in Table 1. According to Darcy’s law, the permeability for Sh = 0 was obtained as 44 μm2.
4.2 Comparison of the Experimental Data and Permeability Models
Permeability has been regarded to be a key factor for the success of depressurization-induced gas production from GHs and affecting the fluid flow in hydrate-saturated porous medium (Tang et al., 2007; Konno et al., 2010; Moridis et al., 2011; Li X.-S. et al., 2012). Once hydrate forms in the porous medium, the pore structure and porosity would be changed, and the flow channel could be hindered and even blocked. It means that the permeability of a hydrate-saturated porous medium relies on where hydrate accumulates in pore space (Kumar et al., 2010; Liang et al., 2011; Ruan et al., 2021). When the hydrates form as thin films coating on grain surface, the impact of hydrate accumulation in pores on the permeability is considered to be unremarkable. When the hydrate accumulates in the center of the pores or flow channel, the decrease of permeability can be obvious (as shown in Figure 5). Therefore, the permeability is closely related to the hydrate morphology in a porous medium. In other words, the hydrate morphology in porous media could be made clear indirectly by means of the investigation of permeability measurement (Hou et al., 2018).
According to the published literature, the empirical permeability models from Kleinberg et al. (2003) are regarded as the commonly used models for the prediction of permeability considering hydrate accumulation habits in pore space of porous media, which include the GC and PF permeability models (as shown in Equations 2, 3. The experimental data of water permeability are correlated with these empirical models (as shown in Table 2), and according to the comparative relationships of the experimental and theoretical permeability results, it can be analyzed to provide an insight for further understanding the hydrate accumulation habits in porous media. Table 2 and Figure 6, respectively, show the comparison results of the different permeability models with the experimental results of permeability for hydrate-saturated glass beads. From Table 2 and Figure 6, it is clear that, in the case of lower hydrate saturations (less than 40%), the water permeability measurement data are much closer to the predicted permeability from the GC permeability model. Whereas, the experimental results for permeability may switch with the increase of Sh. For the higher hydrate saturations (above Sh = 40%), the comparison results between the experimental and theoretical data for permeability indicated that the tendencies of hydrate accumulation in porous media are more consistent with the PF hydrate habits.
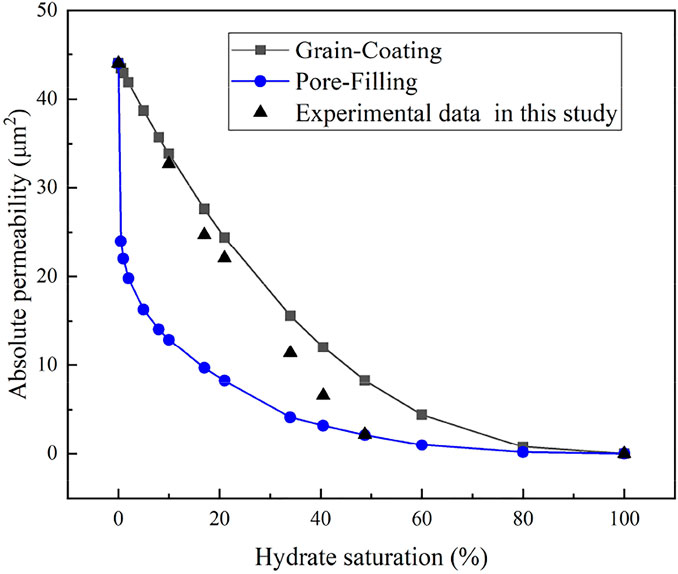
FIGURE 6. Absolute permeability variation with hydrate saturation from experimental data and permeability models.
4.3 Numerical Results of Hydrate Kinetic Decomposition Induced by Depressurization in a Porous Medium
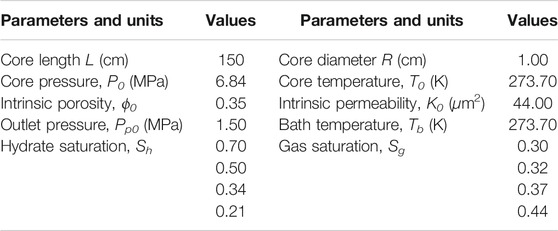
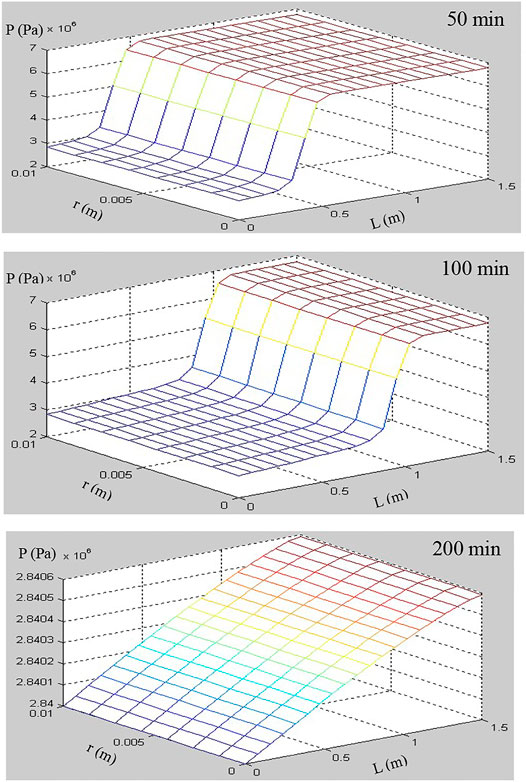
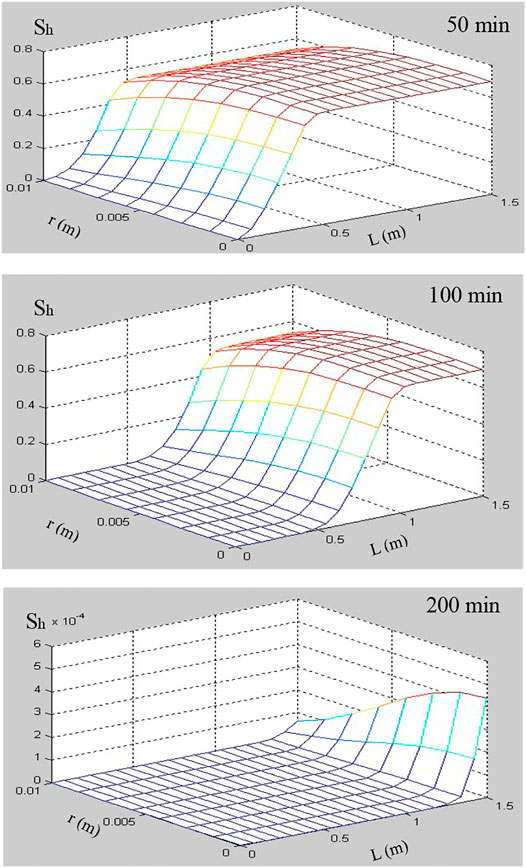
The numerical simulations for hydrate dissociation in hydrate-saturated glass beads using depressurization method were presented to study the hydrate decomposition kinetics in a core-scale porous medium. The models of permeability and surface area considering that the hydrate accumulation habits in porous media were incorporated into the 2D numerical simulator (Ruan et al., 2012a; Ruan et al., 2012b; Ruan et al., 2017). The numerical code has been validated using different experimental data of the hydrate-saturated porous media depressurization-induced dissociation, which include the test dataset of Masuda et al. (1999), Yousif et al. (1991), Falser et al. (2012), and Ruan and Li (2021). The simulation conditions are listed in Table 3. The numerical results at three interesting time points (e.g., 50, 100, and 200 min) have been selected and compared to illustrate the different stages of hydrate dissociation. The time evolutions of hydrate saturation (Sh), temperature (T), and gas pressure (P) during the pressure-induced dissociation of hydrate were tracked and illustrated using the numerical results, which were displayed as 2D plots (length vs. diameter).
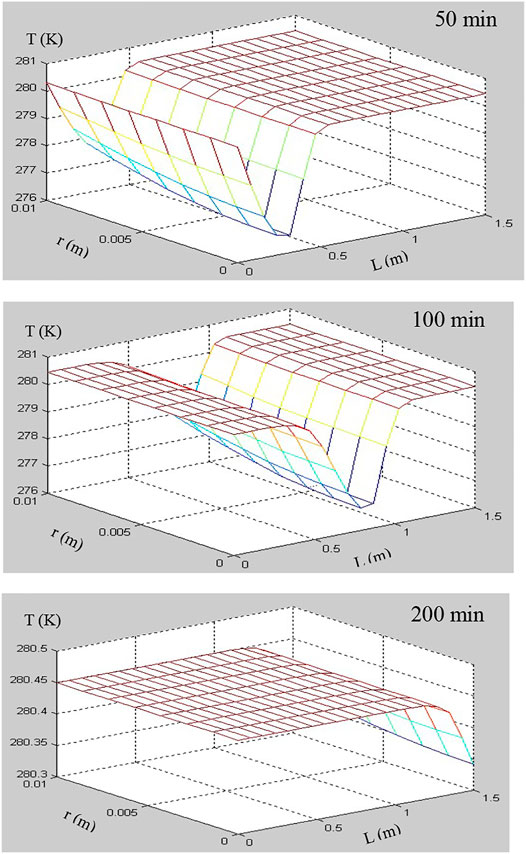
In this simulation of hydrate dissociation in core-scale glass beads [the initial hydrate saturation (Sh0) is 70%], there is no free water in the sample before the dissociation, the boundary temperature (Tb) and initial temperature (T0) are regulated to 280.45 K, and the initial pressure (P0) is equal to 6.84 MPa and is depressurized to the constant pressure (Pout = 2.84 MPa). Figures 7–9 record the changes in P, T, and Sh over time, respectively. In Figure 7, the 2D plots display the changes of gas pressure during hydrate dissociation, and the depressurization was applied at time t = 0 and at the outlet end. With the advance of the depressurization process, hydrates in core sample become unstable, the endothermic hydrate dissociation reaction would take place, and the decrease of T and Sh could be observed in Figures 8, 9, respectively. The gas and water generated from hydrate dissociation flow to the outlet, and then, the longitudinal pressure gradient would expand toward the end of core sample (as shown in Figure 7), as a result, the changes in temperature and hydrate saturation occur along the longitudinal (as shown in Figures 8, 9, respectively).
In addition, as seen in Figures 8, 9, the numerical results show that the temperature and hydrate saturation distribution in core sample at 50, 100, and 200 min display the radial symmetry obviously. In other words, the hydrates closes to the boundary dissociate earlier than those existing in the center of the core sample, and the process of depressurization-induced hydrate dissociation presents the “shrinking-core” dissociation (Tonnet and Herri, 2009; Li and Zhang, 2011; Ruan et al., 2012a). Meanwhile, the constant thermal boundary and the endothermic dissociation reaction lead to a radial temperature gradient in the hydrate-saturated core sample, as illustrated in Figure 8, which supports the endothermic reaction during dissociation and the temperature rebound after hydrate decomposition.
4.4 Influence of Permeability on Hydrate Decomposition Kinetics in a Porous Medium
Several simulation studies have indicated that the permeability is a critical factor for the success of recovering gas from GHs by depressurization (Moridis et al., 2004; Tang et al., 2007; Moridis et al., 2009; Konno et al., 2010; Ruan et al., 2012c; Su et al., 2012; Zhao et al., 2016; Wang et al., 2018; Sun et al., 2020). The depressurization-induced GHs production in a porous medium would be greatly affected by the permeability variation. In this section, the effect of permeability variation with hydrate saturation and hydrate morphology on the hydrate decomposition kinetics in porous media was studied numerically. The simulation results of cumulative gas generated from depressurization-induced hydrate decomposition in a hydrate-saturated core sample with different permeability models were presented and analyzed. Table 1 and 3 summarize the initial values and the main model parameters for the simulations.
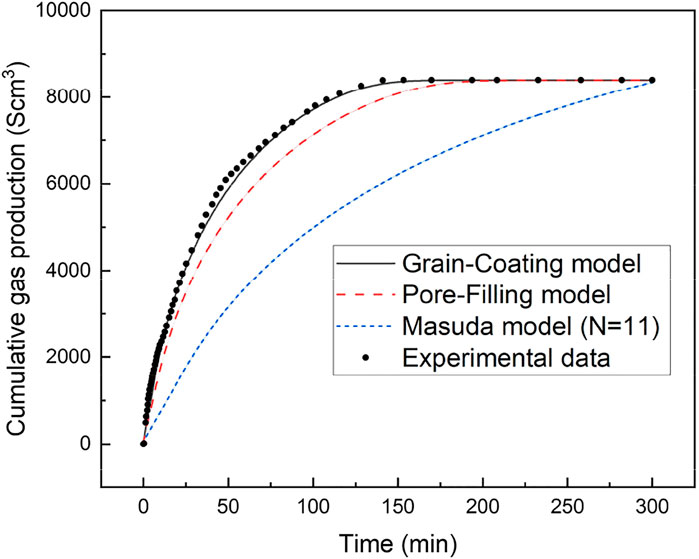
Figure 10 presents the modeling results of cumulative gas generated for three different permeability models at the Sh of 34%. These three permeability models (GC, PF, and Masuda models) were displayed in Table 2. As seen from Figure 10, the GC model is able to match the experimental results of cumulative gas production reasonably well at this initial hydrate saturation. The average deviation and the maximum deviation between the experimental data and the numerical results from the new model are 2.37% and 4.67%, respectively.
As indicated in Figure 10, the numerical evaluation of cumulative gas generated largely depends on the permeability models. The numerical result of cumulative gas generated using Masuda permeability model is much lower than the gas generated in the other two cases. Because the GC and PF permeability models are respectively related to different hydrate accumulation habits in porous media and represent the impact of permeability under various hydrate accumulation habits, so it also indicated that the hydrate accumulation habits are important for hydrate production and its accurate accumulation habit in sediment is essential for reliable numerical predictions of gas produced from GHs. In Figure 10, the simulations of cumulative gas generated from depressurization-induced hydrate decomposition also showed that using the Masuda permeability model underpredicts the gas production. Meanwhile, the predicted cumulative gas generated with GC model is higher than that with PF model, which is mainly attributed to the fact mentioned above that the effect of GC accumulation habit on permeability is smaller than that of PF accumulation habit.
Figures 10, 11 present the evolution of cumulative gas generated over time using the GC and PF permeability models at initial hydrate saturations of 21%, 34%, and 60%, respectively. From Figures 10, 11, we can draw a general conclusion that there are the corresponding discrepancies in the gas generated for different permeability models at the same hydrate saturation. This indicated again that the accumulation habits of GHs in a porous medium impose substantial influence to the gas generated. Moreover, the discrepancy will increase largely with the increase of Sh. It can be concluded that the accumulation habits of GHs in a porous medium are strongly dependent on the hydrate saturation, which further supports the stated issues in section of 4.3. Meanwhile, it suggests that the reasonable and accurate permeability model should be adopted in the modeling studies of hydrate production for the corresponding hydrate properties in a porous medium.
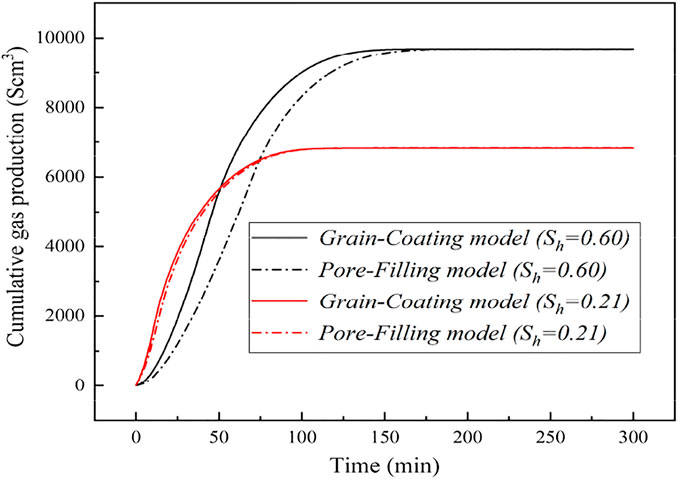
FIGURE 11. The changes of cumulative gas production for different permeability models at the hydrate saturations of 21% and 60%.
4.5 Influence of Hydrate Decomposition Surface Area on Hydrate Decomposition Kinetics in a Porous Medium
In porous media, the depressurization-induced decomposition of GHs is under the control of heat transfer (Oyama et al., 2009), permeability (Konno et al., 2010), and interfacial reaction (Chen and Espinoza, 2018). The heat transfer is related with the permeability properties, and the interfacial reaction is associated with the contact of hydrates and porous media, in which the hydrate morphology all plays a very important role; more specifically, it will affect the permeability and decomposition surface area. There have been many numerical simulations related to the decomposition of GHs in a porous medium; however, there is little research paper for investigating the impact of the hydrate accumulation habits and surface area on hydrate dissociation. In this section, the investigation for the effect of surface area with the consideration of hydrate accumulation habits on hydrate decomposition kinetics will be performed by the mean of numerical simulations.
The different models of surface area for GHs decomposition in a porous medium were used in the simulation studies related to different hydrate accumulation habits and hydrate saturations. Figure 12 shows the simulation predictions of gas production with different hydrate decomposition surface areas at hydrate saturations of 21% and 50%. The GC and PF surface area models for hydrate dissociation (as shown in Equations 5 and 7) were adopted in this numerical simulation. As seen in Figure 12, there are some distinctions in the cumulative gas generated based on different mathematical models for surface area, and the difference will become larger with increasing hydrate saturation. It suggested that the surface area for hydrate dissociation has an important influence on the gas production. Meanwhile, the conclusions drawn above (as discussed in Sections 4.3 and 4.4) indicated that, for initial hydrate saturation less than 40%, hydrate preferentially accumulates on the surfaces of porous media as the accumulation habit of GC, and at higher hydrate saturation, the hydrate accumulation habit in porous media presents the tendency of PF, which can be used to explain the different differences of gas production as seen in Figure 12. For Sh = 21%, the experimental and numerical results indicate a GC accumulation habit for hydrate growth in a porous medium, and the predicted values of surface area for GC and PF hydrates dissociation are 6.04 × 10⁴ and 1.32 × 10⁴ m2/m3, respectively. The difference in cumulative gas production for Sh = 21% (as shown in Figure 12) means that the numerical simulation using the decomposition surface area model of PF hydrate to evaluate the depressurization-induced hydrate production would underpredict the gas production. However, for Sh = 50%, the difference of the modeling predicted cumulative gas productions is small. That is because, when the hydrates continuously accumulate in a porous medium, the surface area of GC hydrate (as shown in the schematic of Figure 5A, GC type) would be not only not increase or even decreasing. Therefore, at higher hydrate saturation, the surface area of PF hydrate could be larger than that of GC hydrate, and there is a corresponding higher gas production (as displayed in Figure 12).
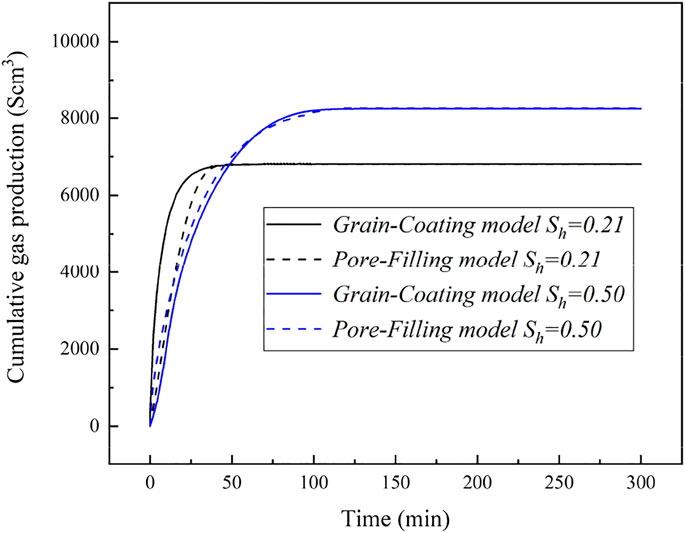
FIGURE 12. Cumulative gas production time evolution for different hydrate dissociation surface area at the hydrate saturations of 21% and 50%.
Moreover, as seen from Figures 11, 12, a distinction could be found between the gas productions controlled by permeability and others controlled by surface area of hydrate. For high initial hydrate saturation, Figure 12 shows that the decomposition surface area of GHs (with considering the different hydrate accumulation habits) has little influence on the dissociation kinetics and gas production; however, in Figure 11, it can be seen that the permeability is important in the hydrate decomposition kinetics and gas production. For low initial hydrate saturation, the hydrate dissociation kinetics becomes dependent upon the decomposition surface area (as indicated in Figure 12), and the permeability of GC or PF hydrate-saturated porous media does not significantly change the time evolution of gas production (as shown in Figure 11).
5 Conclusion
The experimental study on the dependence of water permeability on different hydrate saturations was carried out in glass bead porous media. The experimental data of permeability in hydrate-bearing glass beads was correlated with the empirical permeability relationships for GC and PF accumulation habits of GHs in a porous medium. When the hydrate saturation was less than 40%, the water permeability was closer to the GC modeling predicted permeability. When the hydrate saturation was above 40%, the tendencies of hydrate accumulation in porous media were more consistent with the PF hydrate habit.
A developed 2D core-scale numerical code was used to model the kinetic dissociation process in hydrate-bearing glass beads using depressurization method. The permeability and specific surface area model of hydrate dissociation considering the accumulation habits of hydrate in porous media were introduced into the numerical simulation. The 2D simulation results indicated that the radial temperature gradient and longitudinal pressure gradient appeared in the changes of temperature and gas pressure, and in core-scale porous media, there was a phenomenon of “shrinking-core” hydrate decomposition driven by the radial heat transfer in the kinetic dissociation process induced by hydrate depressurization.
The influence of permeability and hydrate dissociation surface area on the dissociation kinetics of hydrate was numerically studied. The numerical results showed that the hydrate production by depressurization in hydrate-bearing glass beads was closely connected with permeability and hydrate dissociation surface area. Meanwhile, a distinction was found between the gas productions controlled by permeability and others controlled by surface area of hydrate. For high initial hydrate saturation (PF hydrate accumulation habit in glass-beads porous media), the permeability was an important parameter that played a determining role in the production process of hydrate kinetic decomposition. Whereas, for low initial hydrate saturation (GC hydrate accumulation habit), the hydrate dissociation kinetics became dependent upon the surface area of hydrate.
Data Availability Statement
The original contributions presented in the study are included in the article/Supplementary Material; further inquiries can be directed to the corresponding author.
Author Contributions
XR carried out the experiments and numerical simulation, prepared the manuscript. C-GX, X-SL and K-FY provided suggestions on the contents of the manuscript.
Funding
This work is supported by the Guangdong Major project of Basic and Applied Basic Research (no. 2020B0301030003), the Key Program of National Natural Science Foundation of China (grant no. 51736009), the Guangdong Special Support Program-Local Innovation and Entrepreneurship Team Project (2019BT02L278), the Special Project for Marine Economy Development of Guangdong Province (GDME-2018D002), the Science and Technology Apparatus Development Program of the Chinese Academy of Sciences (YZ201619), the Frontier Sciences Key Research Program of the Chinese Academy of Sciences (QYZDJ-SSW-JSC033 and QYZDB-SSW-JSC028), the Program of CAS Key Laboratory of Gas Hydrate (E1290201), and the Science and Technology Program of Guangzhou (202102080159), which are gratefully acknowledged.
Conflict of Interest
The authors declare that the research was conducted in the absence of any commercial or financial relationships that could be construed as a potential conflict of interest.
Publisher’s Note
All claims expressed in this article are solely those of the authors and do not necessarily represent those of their affiliated organizations or those of the publisher, the editors, and the reviewers. Any product that may be evaluated in this article, or claim that may be made by its manufacturer, is not guaranteed or endorsed by the publisher.
Supplementary Material
The Supplementary Material for this article can be found online at: https://www.frontiersin.org/articles/10.3389/fenrg.2021.779635/full#supplementary-material
References
Boswell, R., and Collett, T. S. (2011). Current Perspectives on Gas Hydrate Resources. Energy Environ. Sci. 4, 1206–1215. doi:10.1039/c0ee00203h
Chen, X., and Espinoza, D. N. (2018). Surface Area Controls Gas Hydrate Dissociation Kinetics in Porous media. Fuel 234, 358–363. doi:10.1016/j.fuel.2018.07.030
Chen, L., Yamada, H., Kanda, Y., Okajima, J., Komiya, A., and Maruyama, S. (2017). Investigation on the Dissociation Flow of Methane Hydrate Cores: Numerical Modeling and Experimental Verification. Chem. Eng. Sci. 163, 31–43. doi:10.1016/j.ces.2017.01.032
Chen, B., Yang, M., Zheng, J.-n., Wang, D., and Song, Y. (2018). Measurement of Water Phase Permeability in the Methane Hydrate Dissociation Process Using a New Method. Int. J. Heat Mass Transfer 118, 1316–1324. doi:10.1016/j.ijheatmasstransfer.2017.11.085
DuQuesnay, J. R., Diaz Posada, M. C., and Beltran, J. G. (2016). Novel Gas Hydrate Reactor Design: 3-in-1 Assessment of Phase Equilibria, Morphology and Kinetics. Fluid Phase Equilib. 413, 148–157. doi:10.1016/j.fluid.2015.11.006
Englezos, P. (1993). Clathrate Hydrates. Ind. Eng. Chem. Res. 32, 1251–1274. doi:10.1021/ie00019a001
Falser, S., Uchida, S., Palmer, A. C., Soga, K., and Tan, T. S. (2012). Increased Gas Production from Hydrates by Combining Depressurization with Heating of the Wellbore. Energy Fuels 26, 6259–6267. doi:10.1021/ef3010652
Gauteplass, J., Almenningen, S., Barth, T., and Ersland, G. (2020). Hydrate Plugging and Flow Remediation during CO2 Injection in Sediments. Energies 13, 4511. doi:10.3390/en13174511
Goel, N. (2006). In Situ methane Hydrate Dissociation with Carbon Dioxide Sequestration: Current Knowledge and Issues. J. Pet. Sci. Eng. 51, 169–184. doi:10.1016/j.petrol.2006.01.005
Hong, H., Pooladi-Darvish, M., and Bishnoi, P. R. (2003). Analytical Modelling of Gas Production from Hydrates in Porous Media. J. Can. Pet. Techn. 42, 45–56. doi:10.2118/03-11-05
Hoteit, H., Fahs, M., and Soltanian, M. R. (2019). Assessment of CO2 Injectivity during Sequestration in Depleted Gas Reservoirs. Geosciences 9, 199. doi:10.3390/geosciences9050199
Hou, J., Ji, Y., Zhou, K., Liu, Y., and Wei, B. (2018). Effect of Hydrate on Permeability in Porous media: Pore-Scale Micro-simulation. Int. J. Heat Mass Transfer 126, 416–424. doi:10.1016/j.ijheatmasstransfer.2018.05.156
Jarrar, Z. A., Alshibli, K. A., Al-Raoush, R. I., and Jung, J. (2020). 3D Measurements of Hydrate Surface Area during Hydrate Dissociation in Porous media Using Dynamic 3D Imaging. Fuel 265, 116978. doi:10.1016/j.fuel.2019.116978
Jin, Y., Li, S., Yang, D., and Jiang, X. (2018). Determination of Dissociation Front and Operational Optimization for Hydrate Development by Combining Depressurization and Hot Brine Stimulation. J. Nat. Gas Sci. Eng. 50, 215–230. doi:10.1016/j.jngse.2017.12.009
Jin, Y., Yang, D., Li, S., and Pang, W. (2019). Hydrate Dissociation Conditioned to Depressurization below the Quadruple point and Salinity Addition. Fuel 255, 115758. doi:10.1016/j.fuel.2019.115758
Kerkar, P., Horvat, K., Mahajan, D., and Jones, K. (2013). Formation and Dissociation of Methane Hydrates from Seawater in Consolidated Sand: Mimicking Methane Hydrate Dynamics beneath the Seafloor. Energies 6, 6225–6241. doi:10.3390/en6126225
Kim, H. C., Bishnoi, P. R., Heidemann, R. A., and Rizvi, S. S. H. (1987). Kinetics of Methane Hydrate Decomposition. Chem. Eng. Sci. 42, 1645–1653. doi:10.1016/0009-2509(87)80169-0
Kleinberg, R. L., Flaum, C., Griffin, D. D., Brewer, P. G., Malby, G. E., Peltzer, E. T., et al. (2003). Deep Sea NMR: Methane Hydrate Growth Habit in Porous media and its Relationship to Hydraulic Permeability, deposit Accumulation, and Submarine Slope Stability. J. Geophys. Res. Sol. Earth 108, B10. doi:10.1029/2003jb002389
Kneafsey, T. J., Tomutsa, L., Moridis, G. J., Seol, Y., Freifeld, B. M., Taylor, C. E., et al. (2007). Methane Hydrate Formation and Dissociation in a Partially Saturated Core-Scale Sand Sample. J. Pet. Sci. Eng. 56, 108–126. doi:10.1016/j.petrol.2006.02.002
Konno, Y., Masuda, Y., Hariguchi, Y., Kurihara, M., and Ouchi, H. (2010). Key Factors for Depressurization-Induced Gas Production from Oceanic Methane Hydrates. Energy Fuels 24, 1736–1744. doi:10.1021/ef901115h
Konno, Y., Jin, Y., Shinjou, K., and Nagao, J. (2014). Experimental Evaluation of the Gas Recovery Factor of Methane Hydrate in sandy Sediment. RSC Adv. 4, 51666–51675. doi:10.1039/c4ra08822k
Kono, H. O., Narasimhan, S., Song, F., and Smith, D. H. (2002). Synthesis of Methane Gas Hydrate in Porous Sediments and its Dissociation by Depressurizing. Powder Techn. 122, 239–246. doi:10.1016/s0032-5910(01)00420-x
Kumar, A., Maini, B., P.R. Bishnoi, P. R., Clarke, M., Zatsepina, O., and Srinivasan, S. (2010). Experimental Determination of Permeability in the Presence of Hydrates and its Effect on the Dissociation Characteristics of Gas Hydrates in Porous media. J. Pet. Sci. Eng. 70, 114–122. doi:10.1016/j.petrol.2009.10.005
Kumar, A., Maini, B., Bishnoi, P. R., and Clarke, M. (2013). Investigation of the Variation of the Surface Area of Gas Hydrates during Dissociation by Depressurization in Porous Media. Energy Fuels 27, 5757–5769. doi:10.1021/ef400807n
Li, X.-S., and Zhang, Y. (2011). Study on Dissociation Behaviors of Methane Hydrate in Porous Media Based on Experiments and Fractional Dimension Shrinking-Core Model. Ind. Eng. Chem. Res. 50, 8263–8271. doi:10.1021/ie101787f
Li, G., Li, B., Li, X.-S., Zhang, Y., and Wang, Y. (2012a). Experimental and Numerical Studies on Gas Production from Methane Hydrate in Porous Media by Depressurization in Pilot-Scale Hydrate Simulator. Energy Fuels 26, 6300–6310. doi:10.1021/ef301229k
Li, X.-S., Li, B., Li, G., and Yang, B. (2012b). Numerical Simulation of Gas Production Potential from Permafrost Hydrate Deposits by Huff and Puff Method in a Single Horizontal Well in Qilian Mountain, Qinghai Province. Energy 40, 59–75. doi:10.1016/j.energy.2012.02.030
Li, B., Li, X.-S., Li, G., Feng, J.-C., and Wang, Y. (2014). Depressurization Induced Gas Production from Hydrate Deposits with Low Gas Saturation in a Pilot-Scale Hydrate Simulator. Appl. Energ. 129, 274–286. doi:10.1016/j.apenergy.2014.05.018
Li, X.-S., Xu, C.-G., Zhang, Y., Ruan, X.-K., Li, G., and Wang, Y. (2016). Investigation into Gas Production from Natural Gas Hydrate: A Review. Appl. Energ. 172, 286–322. doi:10.1016/j.apenergy.2016.03.101
Li, G., Wu, D.-M., Li, X.-S., Lv, Q.-N., Li, C., and Zhang, Y. (2017). Experimental Measurement and Mathematical Model of Permeability with Methane Hydrate in Quartz Sands. Appl. Energ. 202, 282–292. doi:10.1016/j.apenergy.2017.05.147
Li, S., Li, S., Zheng, R., Li, Q., and Pang, W. (2021). Strategies for Gas Production from Class 2 Hydrate Accumulations by Depressurization. Fuel 286, 119380. doi:10.1016/j.fuel.2020.119380
Liang, H., Song, Y., Chen, Y., and Liu, Y. (2011). The Measurement of Permeability of Porous Media with Methane Hydrate. Pet. Sci. Techn. 29, 79–87. doi:10.1080/10916460903096871
Lin, T.-K., Dahyar, M., Lee, M.-J., and Hsieh, B.-Z. (2020). Study of the Formation Mechanisms of CO2 Hydrates from Matching the Experimental Data with a Porous media Setting by Multiphase Flow-Geochemical-thermal Reservoir Simulator. J. Taiwan Inst. Chem. Eng. 114, 115–124. doi:10.1016/j.jtice.2020.09.015
Liu, Y., and Gamwo, I. K. (2012). Comparison between Equilibrium and Kinetic Models for Methane Hydrate Dissociation. Chem. Eng. Sci. 69, 193–200. doi:10.1016/j.ces.2011.10.020
Liu, W., Li, Y., and Xu, X. (2019). Influence Factors of Methane Hydrate Formation from Ice: Temperature, Pressure and SDS Surfactant. Chin. J. Chem. Eng. 27, 405–410. doi:10.1016/j.cjche.2018.03.033
Mahabadi, N., Dai, S., Seol, Y., Sup Yun, T., and Jang, J. (2016). The Water Retention Curve and Relative Permeability for Gas Production from Hydrate-Bearing Sediments: Pore-Network Model Simulation. Geochem. Geophys. Geosyst. 17, 3099–3110. doi:10.1002/2016gc006372
Mahabadi, N., Dai, S., Seol, Y., and Jang, J. (2019). Impact of Hydrate Saturation on Water Permeability in Hydrate-Bearing Sediments. J. Pet. Sci. Eng. 174, 696–703. doi:10.1016/j.petrol.2018.11.084
Masuda, Y., Fujinaga, Y., Naganawa, S., Fujita, H., Sato, T., and Hayashi, Y. (1999). “Modeling and Experimental Studies on Dissociation of Methane Gas Hydrates in Berea Sandstone Cores,” in Proceedings of the 3rd International Conference on Gas Hydrates, Salt lake city, Utah, July 18–22.
Moridis, G. J., Collett, T. S., Dallimore, S. R., Satoh, T., Hancock, S., and Weatherill, B. (2004). Numerical Studies of Gas Production from Several CH4 Hydrate Zones at the Mallik Site, Mackenzie Delta, Canada. J. Pet. Sci. Eng. 43, 219–238. doi:10.1016/j.petrol.2004.02.015
Moridis, G. J., Reagan, M. T., Kim, S.-J., Seol, Y., and Zhang, K. (2009). Evaluation of the Gas Production Potential of Marine Hydrate Deposits in the Ulleung Basin of the Korean East Sea. SPE J. 14, 759–781. doi:10.2118/110859-pa
Moridis, G. J., Silpngarmlert, S., Reagan, M. T., Collett, T., and Zhang, K. (2011). Gas Production from a Cold, Stratigraphically-Bounded Gas Hydrate deposit at the Mount Elbert Gas Hydrate Stratigraphic Test Well, Alaska North Slope: Implications of Uncertainties. Mar. Pet. Geol. 28, 517–534. doi:10.1016/j.marpetgeo.2010.01.005
Moridis, G. J. (2004). Numerical Studies of Gas Production from Class 2 and Class 3 Hydrate Accumulations at the Mallik Site, Mackenzie Delta, Canada. Spe Reserv Eval. Eng. 7, 175–183. doi:10.2118/88039-pa
Nakayama, T., Ogasawara, K., Kiyono, F., Torii, H., Yamasaki, A., and Sato, T. (2018). Estimation of Surface Area of Methane Hydrate in the Sand Sediment Using a Dissociation-Rate Model. Mar. Syst. Ocean Technol. 13, 1–12. doi:10.1007/s40868-017-0040-4
Nazridoust, K., and Ahmadi, G. (2007). Computational Modeling of Methane Hydrate Dissociation in a sandstone Core. Chem. Eng. Sci. 62, 6155–6177. doi:10.1016/j.ces.2007.06.038
Ohgaki, K., Takano, K., Sangawa, H., Matsubara, T., and Nakano, S. (1996). Methane Exploitation by Carbon Dioxide from Gas Hydrates. Phase Equilibria for CO2-CH4 Mixed Hydrate System. J. Chem. Eng. Jpn. 29, 478–483. doi:10.1252/jcej.29.478
Oyama, H., Konno, Y., Masuda, Y., and Narita, H. (2009). Dependence of Depressurization-Induced Dissociation of Methane Hydrate Bearing Laboratory Cores on Heat Transfer. Energy Fuels 23, 4995–5002. doi:10.1021/ef900179y
Ren, X., Guo, Z., Ning, F., and Ma, S. (2020). Permeability of Hydrate-Bearing Sediments. Earth Sci. Rev. 202, 103100. doi:10.1016/j.earscirev.2020.103100
Ruan, X., and Li, X.-S. (2021). Investigation of the Methane Hydrate Surface Area during Depressurization-Induced Dissociation in Hydrate-Bearing Porous Media. Chin. J. Chem. Eng. 32, 324–334. doi:10.1016/j.cjche.2020.10.014
Ruan, X., Song, Y., Liang, H., Yang, M., and Dou, B. (2012a). Numerical Simulation of the Gas Production Behavior of Hydrate Dissociation by Depressurization in Hydrate-Bearing Porous Medium. Energy Fuels 26, 1681–1694. doi:10.1021/ef201299p
Ruan, X., Song, Y., Zhao, J., Liang, H., Yang, M., and Li, Y. (2012b). Numerical Simulation of Methane Production from Hydrates Induced by Different Depressurizing Approaches. Energies 5, 438–458. doi:10.3390/en5020438
Ruan, X., Yang, M., Song, Y., Liang, H., and Li, Y. (2012c). Numerical Studies of Hydrate Dissociation and Gas Production Behavior in Porous media during Depressurization Process. J. Nat. Gas Chem. 21, 381–392. doi:10.1016/s1003-9953(11)60380-0
Ruan, X., Li, X.-S., and Xu, C.-G. (2017). Numerical Investigation of the Production Behavior of Methane Hydrates under Depressurization Conditions Combined with Well-Wall Heating. Energies 10 (2), 161. doi:10.3390/en10020161
Ruan, X., Li, X.-S., and Xu, C.-G. (2021). A Review of Numerical Research on Gas Production from Natural Gas Hydrates in China. J. Nat. Gas Sci. Eng. 85, 103713. doi:10.1016/j.jngse.2020.103713
Selim, M. S., and Sloan, E. D. (1989). Heat and Mass Transfer during the Dissociation of Hydrates in Porous media. AIChE J. 35, 1049–1052. doi:10.1002/aic.690350620
Shen, P., Li, G., Li, B., and Li, X. (2020). Coupling Effect of Porosity and Hydrate Saturation on the Permeability of Methane Hydrate-Bearing Sediments. Fuel 269, 117425. doi:10.1016/j.fuel.2020.117425
Sloan, E. D. (2003). Fundamental Principles and Applications of Natural Gas Hydrates. Nature 426, 353–359. doi:10.1038/nature02135
Su, Z., He, Y., Wu, N., Zhang, K., and Moridis, G. J. (2012). Evaluation on Gas Production Potential from Laminar Hydrate Deposits in Shenhu Area of South China Sea through Depressurization Using Vertical wells. J. Pet. Sci. Eng. 86-87, 87–98. doi:10.1016/j.petrol.2012.03.008
Sun, Z.-F., Jia, S., Yuan, Q., Sun, C.-Y., and Chen, G.-J. (2020). One-dimensional Study on Gas Production Characteristics of Methane Hydrate in Clayey Sediments Using Depressurization Method. Fuel 262, 116561. doi:10.1016/j.fuel.2019.116561
Tang, L.-G., Li, X.-S., Feng, Z.-P., Li, G., and Fan, S.-S. (2007). Control Mechanisms for Gas Hydrate Production by Depressurization in Different Scale Hydrate Reservoirs. Energy Fuels 21, 227–233. doi:10.1021/ef0601869
Tonnet, N., and Herri, J.-M. (2009). Methane Hydrates Bearing Synthetic Sediments-Experimental and Numerical Approaches of the Dissociation. Chem. Eng. Sci. 64, 4089–4100. doi:10.1016/j.ces.2009.05.043
Wan, Q.-C., Chen, L.-L., Li, B., Peng, K., and Wu, Y.-Q. (2020). Insights into the Control Mechanism of Heat Transfer on Methane Hydrate Dissociation via Depressurization and Wellbore Heating. Ind. Eng. Chem. Res. 59, 10651–10663. doi:10.1021/acs.iecr.0c00705
Wang, B., Fan, Z., Zhao, J., Lv, X., Pang, W., and Li, Q. (2018). Influence of Intrinsic Permeability of Reservoir Rocks on Gas Recovery from Hydrate Deposits via a Combined Depressurization and thermal Stimulation Approach. Appl. Energ. 229, 858–871. doi:10.1016/j.apenergy.2018.08.056
Wang, X., Zhang, F., and Lipiński, W. (2020a). Research Progress and Challenges in Hydrate-Based Carbon Dioxide Capture Applications. Appl. Energ. 269, 114928. doi:10.1016/j.apenergy.2020.114928
Wang, Y.-F., Wang, L.-B., Li, Y., Gu, J.-X., Sun, C.-Y., Chen, G.-J., et al. (2020b). Effect of Temperature on Gas Production from Hydrate-Bearing Sediments by Using a Large 196-L Reactor. Fuel 275, 117963. doi:10.1016/j.fuel.2020.117963
Xu, C.-G., Cai, J., Lin, F.-h., Chen, Z.-Y., and Li, X.-S. (2015). Raman Analysis on Methane Production from Natural Gas Hydrate by Carbon Dioxide-Methane Replacement. Energy 79, 111–116. doi:10.1016/j.energy.2014.10.068
Xue, K., Zhao, J., Song, Y., Liu, W., Lam, W., Zhu, Y., et al. (2012). Direct Observation of THF Hydrate Formation in Porous Microstructure Using Magnetic Resonance Imaging. Energies 5, 898–910. doi:10.3390/en5040898
Yang, M., Song, Y., Ruan, X., Liu, Y., Zhao, J., and Li, Q. (2012). Characteristics of CO2 Hydrate Formation and Dissociation in Glass Beads and Silica Gel. Energies 5, 925–937. doi:10.3390/en5040925
Yang, M., Liu, W., Song, Y., Ruan, X., Wang, X., Zhao, J., et al. (2013a). Effects of Additive Mixture (THF/SDS) on the Thermodynamic and Kinetic Properties of CO2/H2 Hydrate in Porous Media. Ind. Eng. Chem. Res. 52, 4911–4918. doi:10.1021/ie303280e
Yang, M., Song, Y., Liu, W., Zhao, J., Ruan, X., Jiang, L., et al. (2013b). Effects of Additive Mixtures (THF/SDS) on Carbon Dioxide Hydrate Formation and Dissociation in Porous media. Chem. Eng. Sci. 90, 69–76. doi:10.1016/j.ces.2012.11.026
Yang, M., Song, Y., Jiang, L., Liu, Y., and Li, Y. (2014). CO2 Hydrate Formation Characteristics in a Water/Brine-Saturated Silica Gel. Ind. Eng. Chem. Res. 53, 10753–10761. doi:10.1021/ie5012728
Yin, Z., Wan, Q.-C., Gao, Q., and Linga, P. (2020). Effect of Pressure Drawdown Rate on the Fluid Production Behaviour from Methane Hydrate-Bearing Sediments. Appl. Energ. 271, 115195. doi:10.1016/j.apenergy.2020.115195
Yousif, M. H., Li, P. M., Selim, M. S., and Sloan, E. D. (1990). Depressurization of Natural Gas Hydrates in berea sandstone Cores. J. Incl. Phenom. Macrocycl. Chem. 8, 71–88. doi:10.1007/bf01131289
Yousif, M. H., Abass, H. H., Selim, M. S., and Sloan, E. D. (1991). Experimental and Theoretical Investigation of Methane-Gas-Hydrate Dissociation in Porous Media. SPE Reservoir Eng. 6, 69–76. doi:10.2118/18320-pa
Yu, T., Guan, G., Wang, D., Song, Y., and Abudula, A. (2021). Numerical Investigation on the Long-Term Gas Production Behavior at the 2017 Shenhu Methane Hydrate Production Site. Appl. Energ. 285, 116466. doi:10.1016/j.apenergy.2021.116466
Zhao, J., Xu, K., Song, Y., Liu, W., Lam, W., Liu, Y., et al. (2012). A Review on Research on Replacement of CH4 in Natural Gas Hydrates by Use of CO2. Energies 5, 399–419. doi:10.3390/en5020399
Zhao, J., Zhu, Z., Song, Y., Liu, W., Zhang, Y., and Wang, D. (2015). Analyzing the Process of Gas Production for Natural Gas Hydrate Using Depressurization. Appl. Energ. 142, 125–134. doi:10.1016/j.apenergy.2014.12.071
Keywords: gas hydrate, decomposition kinetics, surface area, permeability, hydrate saturation, hydrate accumulation habit, numerical simulation, depressurization
Citation: Ruan X, Xu C-G, Yan K-F and Li X-S (2021) Experimental and Modeling Study of Kinetics for Hydrate Decomposition Induced by Depressurization in a Porous Medium. Front. Energy Res. 9:779635. doi: 10.3389/fenrg.2021.779635
Received: 19 September 2021; Accepted: 05 November 2021;
Published: 20 December 2021.
Edited by:
Youngjune Park, Gwangju Institute of Science and Technology, South KoreaReviewed by:
Yun-Ho Ahn, Soongsil University, South KoreaHussein Hoteit, King Abdullah University of Science and Technology, Saudi Arabia
Copyright © 2021 Ruan, Xu, Yan and Li. This is an open-access article distributed under the terms of the Creative Commons Attribution License (CC BY). The use, distribution or reproduction in other forums is permitted, provided the original author(s) and the copyright owner(s) are credited and that the original publication in this journal is cited, in accordance with accepted academic practice. No use, distribution or reproduction is permitted which does not comply with these terms.
*Correspondence: Xiao-Sen Li, bGl4c0Btcy5naWVjLmFjLmNu
 Xuke Ruan
 Chun-Gang Xu
 Ke-Feng Yan
 Xiao-Sen Li1,2*