 Xue Chen1
 Zhen Liu
 Hayot Berk Saydaliev
 Assem Abu Hatab
94% of researchers rate our articles as excellent or good
Learn more about the work of our research integrity team to safeguard the quality of each article we publish.
Find out more
ORIGINAL RESEARCH article
Front. Energy Res., 24 December 2021
Sec. Sustainable Energy Systems
Volume 9 - 2021 | https://doi.org/10.3389/fenrg.2021.779032
This article is part of the Research TopicThe Future of Energy Efficiency in Post-COVID-19 EraView all 33 articles
Considering the significance of green governance in economic restructuring and the green technology revolution, this study examines the impact of China’s recent green governance policies and their implications in various regions; it also examines new models, methods, and development directions for China’s green governance in the future. Green governance efficiency and spatial patterns have been studied through 2008–2018 data using a three-stage generalized panel Data Envelopment Analysis (DEA) model, spatial autocorrelation model, spatial gravity model, and social network analysis. The study summarizes the status and role of each provincial region in green governance based on the social network of green governance efficiency under the network architecture. It concludes that (1) green governance efficiency in China’s provinces has a U-shaped trend, with non-managerial elements in the external environment masking genuine green governance efficiency. (2) During the study period, the overall efficiency of the industrial system improved. The efficiency of the manufacturing and wastewater stages has been substantially enhanced, but no significant gains were observed in the treatment stages of solid and gas waste. (3) Although China has made progress in enhancing the overall efficiency of its industrial system, there is still potential for improvement. (4) China has established a “three horizontal and two vertical grid-type” green governance spatial correlation structure among the sub-stages of the industrial system, and the radiation impact of major provincial areas would increase overall green governance efficiency.
China’s 34.3% economy is accounted for by its industrial sector (Lee and Brahmasrene, 2020), which consumes 70% of the total energy in China, discharging 80% of its waste gases. To increase the use, treatment, and removal of industrial solid waste, sewage, and waste gases, the government of China is making significant efforts, and a detailed analysis of the past gains and losses regarding the industrial production and pollutants treatment performance of China provides a context for the adjustments and improvements of the country’s future policy (Wang and Feng, 2020). The literature highlights China’s high energy-consuming and carbon-emitting industrial sector, focusing mainly on green productivity, energy, and the environment (Pastor et al., 2020). The industrial eco-efficiency for 2004 is examined through an input-oriented DEA (Data Envelopment Analysis) method, and only five provinces of China, out of 30, are found eco-efficient (Ding et al., 2020). Furthermore, the energy efficiency of the regional industrial sectors of China from 1997 to 2008 is investigated by a Malmquist index to find how an increase in the industrial energy efficiency of China is influenced mainly by technological progress (Simar and Wilson, 2019). Similarly, the sectorial environmental efficiency of China from 1998 to 2009 is studied through a non-radial DEA (Kang et al., 2018), which shows a 58% increase in the industrial environmental efficiency of the nation, considering technological progress as the main element. Moreover, green productivity in the industrial sectors of China from 1980 to 2010 is measured by applying a Luenberger index (Zhou et al., 2007), which shows a lack of a sustainable path producing low carbon growth (Bian et al., 2013).
Sustainable development is most likely achieved through a green economy playing the leading role (He et al., 2019). Hence, increased urbanization and industrialization caused a rise in the energy consumption of China, increasing pollution, which causes severe damage to the ecology (Mohsin et al., 2020b; Mohsin et al., 2018; Mohsin et al., 2021). Therefore, green economic development is deemed imperative, pertaining to the unfeasibility of the development model, where the environment is sacrificed to achieve economic benefits amid an economic transition. Moreover, the critical sustainable development measure is green governance efficiency (GGE), promoting economic growth and environmental development (Sueyoshi et al., 2017), which results in better economic growth with nominal environmental loss in limited resources. The economic growth quality, which adds to sustainable development worldwide, is revealed through a detailed GGE analysis of China (Mohsin et al., 2019; Mohsin et al., 2020a; Mohsin et al., 2021). Similarly, coal consumption in China records 52% of global CO2 emissions, whereas 2013 recorded the peak for coal consumption and in 2014, it recorded 87.67% of China’s energy consumption (Wu et al., 2020). Furthermore, China is recorded as the largest global carbon emitter in 2006 and the largest global energy consumer in 2010, exceedingly even the U.S., whereas 28% of global carbon emission is recorded in the present. Since 1998, 70% of the energy assumption in China is accounted for by coal consumption, summed up to 21% of global carbon emissions in 2017, regardless of its decrease since 2015 (Kozhakhmetova et al., 2019). Moreover, energy demand in China is considered the highest and is constantly increasing. Hence, with a relatively low ratio and nominal role of qualified energies, including petroleum and natural gas, the energy structure of China is coal-oriented as compared to the global average due to its natural resource distribution, “rich coal, meager petroleum and little gas” (Yuan et al., 2017; Hao et al., 2020). Similarly, the coefficient of coal for carbon emission is higher than petroleum or natural gas and, therefore, future economic and regional development in China depends on carbon emissions and air quality control due to the inability of the dominant position of coal within the Chinese energy structure to shift quickly (Musibau et al., 2021; Wu et al., 2021; Pavlyk, 2020).
Climate change and environmental protection is negatively affected by the energy price distortions due to the continuous increase in energy consumption for China (Yang et al., 2021; He et al., 2020; Mohsin et al., 2020b). Furthermore, misallocation and the consumption of threatened resources are caused by the distortion in energy prices, which does not suggest market values or the supply-demand balance. Moreover, China’s economic development is promoted by artificially lowering energy prices, whereas distortions strengthen short-term resource concentration and production (Tavana et al., 2020; Ikram et al., 2019a; Sun et al., 2019; Ikram et al., 2019b), which reflects how administrative intervention causes a substandard economic growth due to the energy flows moving toward inefficient sectors rather than efficient ones. Energy price nexus mechanisms are examined in several previous studies, which do not consider the impact of energy price distortions on environmental and economic progress and their combined effect. Hence, this study focuses on GGE for China (Zhu et al., 2017) along with the influencing mechanisms. It also discusses the most widely consumed form of energy in China, which is fossil energy, the possible variation in the types of fossil energy, and how the GGE of different regions is affected, assisting policymakers in planning and achieving environmentally and economically balanced development by gaining a better grasp of the relation between energy price anomalies and GGE (Tavana et al., 2020).
Hence, this paper, (1) starts by measuring the efficiency of green governance in each region scientifically by building an evaluation index system, (2) followed by the clarification of the resource input adjustment mechanism of green governance on the basis of the redundancy analysis, ending with the clarification of spatial correlation for green governance in each region through the Moran index, the spatial gravity model, and the social network analysis method, respectively. Moreover, the efficiency of green governance is improved and the broad scope of green governance is expanded, radiating the periphery of spatial effect of green governance in the core region. The study also uses the three stage DEA model for the empirical assessment of Chinese provinces.
The DEA technique, a prominent mathematical model created by Charnes et al. (1978) and currently utilized to quantitatively assess sustainability-related concerns, is used to measure efficiency (Emrouznejad et al., 2010). DMUs are always a “black box” in classic DEA models, regardless of the DMUs, including a two-stage network. Scholars have built substantial network-based DEA models to analyze the effectiveness of environmental decentralization. Energy effectiveness is calculated using a variety of predictors (Sun et al., 2020a; Baloch et al., 2020), with single factor and total factor energy efficiency being the most commonly used indicators (Omrani et al., 2021). Figure 1 shows Green governance efficiency by first stage generalized-panel DEA (before adjustment).
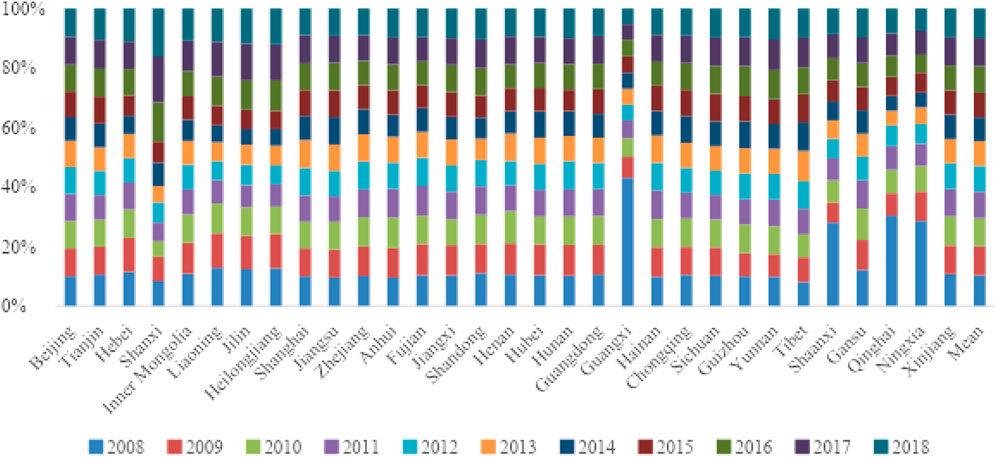
FIGURE 1. Green governance efficiency by first stage generalized-panel DEA (before adjustment).
Figure 2 states the Green governance efficiency by first stage generalized-panel DEA (after adjustment). GE is studied by a number of existing studies and the evaluation indicator system (OECD, 2011) and efficiency evaluation methods are the two main approaches used to measure efficiency. Moreover, parameter-based stochastic Frontier analysis (SFA) and the nonparametric data envelopment analysis (DEA) approach are the two main types of efficiency methods. The eco-efficiency of major world economies is measured through the SFA and DEA methods, which measure the efficiency of a decision-making unit with inputs and outputs objectively as compared to the subjective indicators of weighting involving the high degree of uncertainty in the evaluation results (Kortelainen, 2008; Halkos and Petrou, 2019). Hence, the SFA approach is not applicable to quantifications with multiple inputs and outputs and requires specified production function (Zhou et al., 2013). Some scholars believe in how the production costs of a country are increased by environmental regulation while weakening the competition of enterprises (Nasawat et al., 2021; Emrouznejad and Yang, 2018; Yeşilyurt et al., 2020). Furthermore, when it comes to research methodology, the majority of past studies use linear analysis and static research (Sun et al., 2020b; Sun et al., 2020; Sun et al., 2020a). Hence, it is impossible to solve the endogeneity problems and ordinary panel data estimates in the related studies.
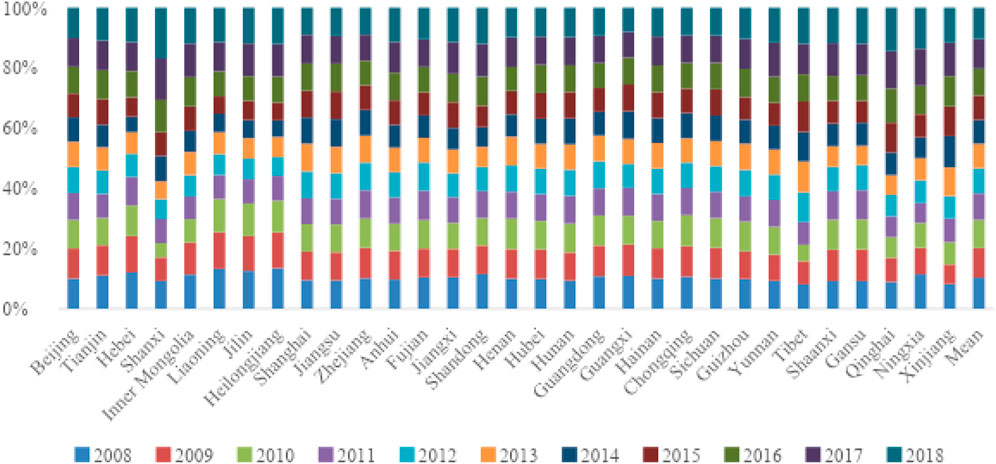
FIGURE 2. Green governance efficiency by the first stage generalized-panel DEA (after adjustment).
Eco-efficiency is described as a single process in the previous studies focusing on the industrial sector, overlooking the essential role of the government, generating CO2 emissions directly. Furthermore, the government sector offers important services, but the precise effects of the government sector on the industrial sector or even overall efficiency (eco-efficiency) are unknown. The sectoral correlations and interactions within China’s GGE are not considered in the evaluation of this study, omitting target sectors for policy governance.
Furthermore, authorities and universities are emphasizing energy efficiency in terms of growing concerns about global warming, fast development in energy needs, and poor energy safety (Wu et al., 2020). However, unwanted outputs like the discharge of wastewater, exhaust emissions, and waste production are not considered when current energy efficiency indices are calculated. Hence, this study builds an index for energy efficiency called green governance efficiency (GGE), which considers the undesirable output and follows the concepts of sustainable growth from earlier literature. Therefore, it is challenging to determine whether the angular and radial measures as a traditional DEA model starts with input or output. As a result, the fraction of all input (outcomes and impacts) decreased (raised) in an equal proportion is included in the calculation of inefficiency.
Similarly, in faulty decision-making units where the percentage change is not equal to the actual input-output, the relaxation improvement, omitting the equal proportion development element, is not discovered by the quality evaluation of the standard DEA model. Therefore, Slacks-based measure (SBM) models (non-radial and non-angular) are derived by Tone (2001) by proposing relaxation variables directly into the objective function, which also overlooks the influence due to the selection of the radial and the angular systems, measuring the inefficiency situation through the input and output angles. Hence, the external adverse environmental effects resulting from the manufacturing process are ignored, and the output of the standard SBM model is set to the expected output. The input-oriented variable returns to scale DEA model, and this paper chooses the generalized BBC-DEA model, considering the existence of input controllability of green governance. If
where each DMU shows
A nonparametric method called DEA, commonly used to quantify eco-efficiency, is used to evaluate the efficiency of decision-making units (DMUs) that can consume numerous inputs and generate multiple outputs (Zhou et al., 2008). Long et al. (2017) evaluated the eco-efficiency of cement manufacturers in China and found a converging tendency in the Eastern, Central, and Western regions. Furthermore, DEA was used to assess the eco-efficiency of China’s industrial sector by Yang et al. (2017), Zhang et al. (2017). The Data envelopment analysis have been used to measure the green governance efficiency analysis where as the regression model is used to access the impact of non managerial concerns.
where
The adjusted green governance efficiency value
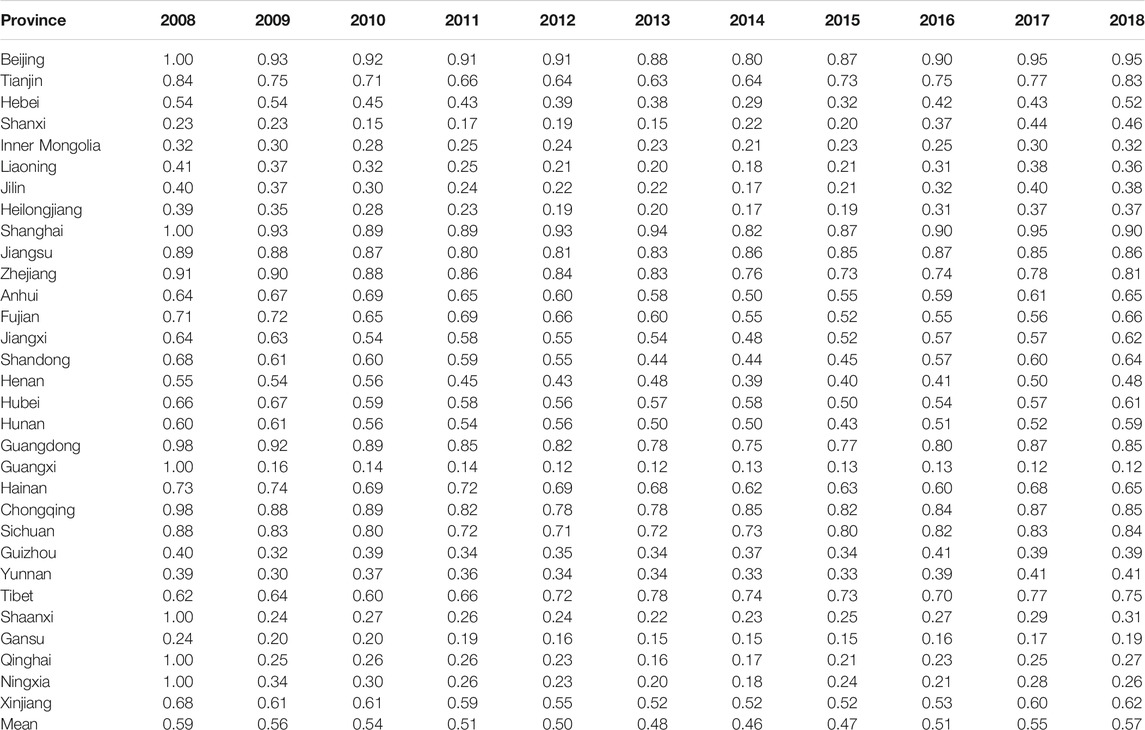
TABLE 1. Green governance efficiency by first stage generalized-panel DEA (before adjustment).
An effective combination of the first law of geography and econometrics is obtained by the global spatial autocorrelation analysis, based on the exploratory analysis of spatial data, which explores a spatial unit for the degree of clustering and interaction of some aspects within it. The calculation formula is given as:
where the number of provinces is identified as n, the green governance efficiency values of the two provinces as xi and xj, and the specific element of the spatial weight matrix W as Wij. Moran’s, I index rages from (−1, 1), whereas with calculated value greater than 0, a positive spatial correlation between green governance in each province is identified, showing a robust spatial clustering feature with an increase in the value becoming more significant. Similarly, with calculated value less than 0, a negative spatial correlation between green governance in each province is evident, whereas the significance increases showing a high degree of spatial variation. The absence of spatial interaction and clustering correlation shows green governance in each province distributed in a random style.
This study determines the potential interaction between green governance in each province through spatial autocorrelation analysis; however, feedback on the scale of association and gravitational agents in the interaction process is absent. Moreover, this study determines the degree of interaction between green governance in different provinces by building and modifying the spatial gravity model. Where the degree of spatial correlation of green governance efficiency between the two provinces is given as Rij, the spatial gravity coefficient as Mij, the green governance efficiency of province i and province j as Si and Sj, the spatial distance between the two regions as Dij and the size of green industries and GDP per capita of each province as Z and g. Moreover, the total spatial association of green governance in region i to measure the extent of effect for green governance efficiency in region i on other regions is characterized as Ai.
This study considers the data availability and analytical value for 31 provinces in China for the period 2008–2018 and the data is obtained from the China Science and Technology Statistical Yearbook, China High Technology Industry Statistical Yearbook, China Statistical Yearbook, Provincial and Municipal Statistical Yearbooks, EPS Data Platform, and the patent search and analysis system of the National Intellectual Property Office. Hence, green innovation identifies with high technology driving sustainable development in society, considering the meaning of green in the green governance indicator system along with green innovation as an external manifestation of green governance. Consequently, the raw data for core content of green governance and green innovation is reprocessed in this section, specifically the research and development institutions for local (government) departments in the high-tech industry, the number of employed research and development personnel, the money spent on R&D, innovation projects completed or in-progress along with the new fixed asset investment in innovation applied to clarify the meaning of “green”.
Furthermore, there is variation in the four regions for long-term trends and the effectiveness between both sectors, with an increase of 111.11% in the Eastern part of the country for governance performance, rising from 0.27 in 2007 to 0.57 in 2015, whereas the industrial sector’s efficiency rose by 77.63% during the study period. Table 2 shows green governance efficiency scores. The economic and environmental efficiency scores of the Chinese provinces reflect that environmental efficiency shall be measured by fixing the best undesirable output, which generates a green governance efficiency score. It can be seen that most countries have higher economic efficiency scores than environmental efficiency, which means that these countries are economically and environmentally efficient. Shanxi and Inner Magnolia are the least efficient countries with scores below 1.
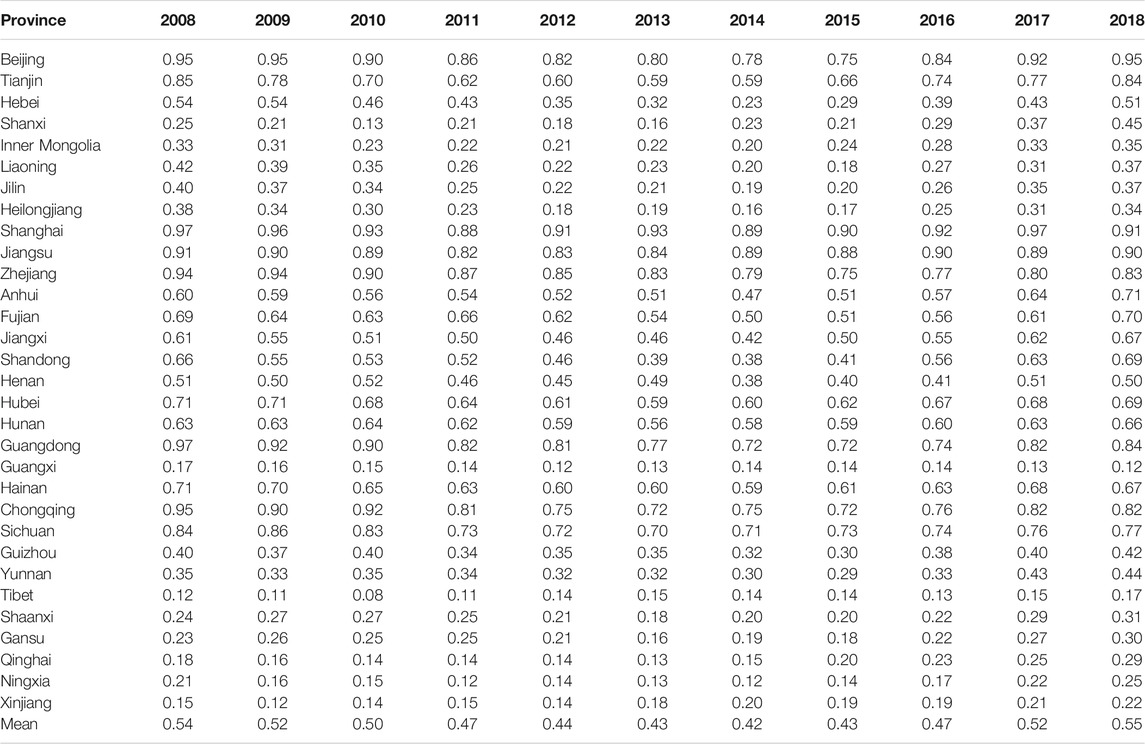
TABLE 2. Green governance efficiency by first stage generalized-panel DEA (after adjustment).
The external environment is seen to influence green governance more after eliminating factors, such as management noise, external environment, and random error as shown in Table 2, where the green governance efficiency fluctuates more in the first and third stages.
The period 2008–2014 for the eve of launch for green governance strategy comes under the first cycle which scatters the activities related to green governance in each region, whereas the respective planning and location conditions determine the development of relevant governance strategies. Similarly, the formal introduction of green governance for the period of 2015–2018 is included in the second cycle which shows a positive interoperability, a high degree of unity and close connection for green governance in all regions. The previous period shows increase of approximately 4.12% with the average value of green governance efficiency for each province in the current period reaching 0.480, as shown in Table 2.
Furthermore, the Western area increased from 0.13 in 2009 to 0.36 in 2014, before declining after 2014, the production activities of industrial sectors showing a negative trend. As a result, the utilization of fiscal income after 2014 reveals a relatively poor quality with a falling tendency, whereas natural resource rent is a significant source of revenue for resource-based towns. Furthermore, the abundance of natural resources has a detrimental impact on the government, resulting in rent-seeking activities that squander money and lead to corruption. Consequently, the unsustainable development of resource-based areas may occur due to the inefficiency of the government sector resulting in institutional weakening.
This paper uses an econometric prediction model to calculate Equation (3) in the methodology and considers the possible endogeneity between environmental laws predictors and GGE, conducting the estimations through generalized moment estimation and strengthening the estimated results. Furthermore, the Hansen test and the autoregressive AR2 estimate results show no second-order sequence correlation. Similarly, GGE is “U-shaped,” with an increase in environmental regulation inhibiting GGE improvement before the level of environmental law reaching its defining moment. In contrast, an increased environmental process law can increase GGE advancement.
As a result, the regression findings are compressed by the “cost” of complying with environmental regulations, and the increase of green total factor productivity is stifled, making it impossible to motivate businesses to do technical R&D in the short term. Similarly, it also reduces pollution through changed production methods, improving the green total factor productivity simultaneously. Consequently, the market concentration is further increased due to the market’s withdrawal through some high-energy enterprises and strict environmental regulations. In contrast, retained enterprises improve the core competitiveness, promoting green total-factor long-run efficiency by focusing on green technology innovation. Nevertheless, green institutions and personnel under the leadership of social organizations do not follow the macro policy direction of the government due to the excessive financial, environmental investment, leading to redundancy in the allocation of government organizations through the disincentive effect under the regulation of the market.
A noticeable rise in government sector efficiency in the Western area, from 0.13 in 2009 to 0.36 in 2014, is shown with a drop, a tendency also apparent in China. This downward trend reflects the government sector’s generally low quality in its use of fiscal revenue after 2014. Natural resource rent may be highly beneficial to resource-based towns.
The different trends based on the geographical location and economic development are seen in the data analysis in Table 3, reflecting redundancy in green governance inputs in all the provinces and aspects of China. Hence, with an average of 52.129%, an enormous redundancy scale is found in green organizational building capacity, which shows the least redundancy with 52.129% as an average. Similarly, green investment capability shows the least redundancy with an average redundancy of 40.601%, whereas the average redundancy of 42.111, 42.408, and 42.451% is found for green organizational configurations capability, green service capability, and green operations capability. This reflects the industrial sector’s more efficient manufacturing actions as a result of the public sector’s higher efficiency and the linking structure’s ability to influence the flow of intermediates, such as facilities, new tech, schooling, and health, and thus affect production operations, which is the reason for this positive relationship.
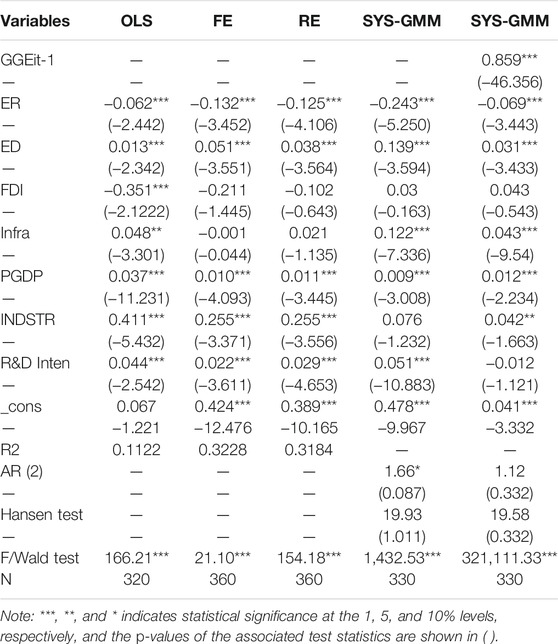
TABLE 3. Econometric estimation of redundancy of green governance (role of technology).
Hence, the provinces of China show industrial system efficiencies of significant differences and a value of more than 0.9 is recorded for the GGE of Shanxi, Jilin, Jiangsu, Zhejiang, Anhui, Fujian, the Xinjiang’s total factor productivity and wastewater governance efficiencies, and Tianjin’s solid waste governance efficiencies all need to be improved. Hence, steps should be taken to improve the performance of industry system by clarifying the efficiency-related performance of the sub-stages in Chinese provinces.
The average efficiency of the government sector and production efficiency are both 0.42, with Shaoyang (0.87) and Xuzhou (0.80) ranking first and second, respectively. Similarly, Shaoyang (1.00) and Xuzhou (1.00) are the highest performers in production efficiency, suggesting that they have the best-practice technological frontier with sectoral efficiencies of 1.00 (Table 4).

TABLE 4. SFA regression model results.
The clock is ticking, the snow on the glaciers is melting, and the sea level is rising. People are dying due to floods, droughts, heat strokes, and natural catastrophes. China is currently experiencing a threefold increase in heat compared to the worldwide rate at the same time, the temperature has risen by more than 2°, which has been melting the glaciers and the impact can be seen in the form of pulverized homes, dangerous food insecurities, and ravenous animals, for instance polar bears. In Japan, heavy rains in 2018 initiated landslides and floods, which killed around 200 people (Hao et al., 2021). In addition, the indescribable heat waves endangered the vulnerable species in the region. The climate has been getting worse, a pattern of abnormal weather will start occurring more than before, while the region will consume double as compared to the present consumption (Halicioglu and Ketenci, 2018).
The green governance in all provinces shows a significant upward trend as seen in, whereas the position and role of each province in the social network of green governance are comparatively solidified due to factors such as simultaneous increases and slight differences in the magnitude of the increases. Furthermore, between 2004 and 2015.
Figure 3 shows the green redundancy. We found that the green governance in all provinces shows a significant upward trend as seen in Table 8, whereas the position and role of each province in the social network of green governance are comparatively solidified due to factors, such as simultaneous increases and slight differences in the magnitude of the increases. Furthermore, between 2004 and 2015. Result shows that, the 1% significance analysis results in an extraordinary two-way influence (2). Within the constant 96 percent confidence level shown in Table 5, the approximate upper limits are 0.763 and 0.833 and (0.801), (3.863), and (0.763, 3.861).
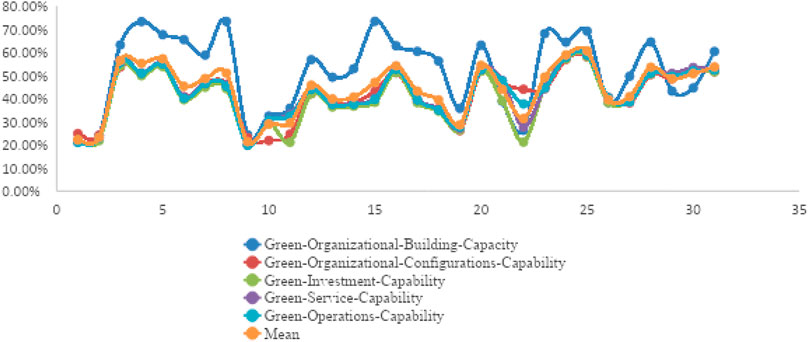
FIGURE 3. Green redundancy.

TABLE 5. Results of the threshold test.
This fact indicates that energy-focused technology advancements have a non-linear influence on EE, with a maximum value of 61.33. This means that the influence of advancements in energy-oriented technology on EE is variable, both above and below the upper limit amount. Results illustrates the regional green economic performance stage concerning the upper limit values. In 3010 and 3017, respectively, the EPI of around 0.301 increased by 63.3% and 86.3%. Similarly, regions with EPI values between 0.301 and 0.738 increased by 3.3% and 33.6%, respectively, demonstrating these regions' green economic success during the research period. Regions with a larger than 0.738 economic performance index have a similar consistent expansion trend. This trend results from economic improvements taking root at the province level of around 9.7% and 16.1%, respectively, and provincial creative systems continuing to reach new heights, (Table 6) economic performance coupled with the green economic performance was above 0.73 altered after 2013.
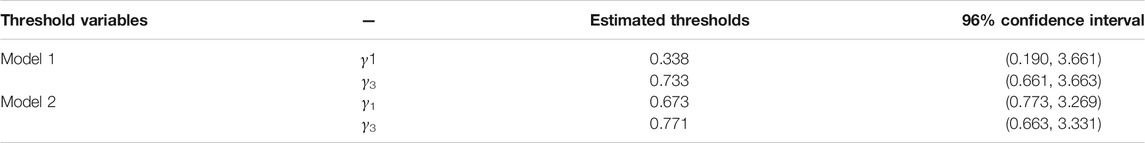
TABLE 6. Estimated threshold variables.
Nevertheless, provincial performance in combination with green economic performance was more than 0.73 following 2013. Between 2010 and 2017, provinces with an economic progress level greater than 0.738 decreased from roughly 90.3 to 83.9 percent. Provincial technology improvements have a direct effect on the viability of the country's regional economies. The percentage of provinces where provincial technical breakthroughs had a tangible effect on promoting sustainable development decreased from 87.1 to 61.3 percent within the research period. Additionally, the proportion of provinces where provincial technical breakthroughs had a negligible influence on sustained provincial progress increased from 3.3 to 33.6 percent throughout the research period. As a result, one may argue that China's current atmosphere is progressive in general.
This research creates a generalized panel three-stage DEA model on the concept of green governance to objectively measure, assess, and evaluate the efficiency of 31 provinces in China in the period 2008 to 2018. Through an external environment and projection analysis, it highlights the direction of green governance efficiency improvement. The intrinsic geographical correlation and magnitude of spatial connection of green governance effectiveness in Chinese provinces are revealed using this research’s spatial autocorrelation model, spatial gravity model, and social network analysis.
1) There is a clear correlation between governance and production efficiency. The resource-based cities in the Central, Western, and Northeast regions should be given special attention, as their governance and production efficiency deteriorated after 2014. This pattern demonstrates the government sector’s low quality in fiscal income derived from natural resource rents. According to the projection analysis of green governance input redundancy, the redundancy of each input element is more severe, and the problem of internal variation in redundancy is apparent. Although China has achieved some initial success in enhancing the overall efficiency of its industrial system, more progress is required.
2) China has two development cycles of provincial green governance efficiency, with 2015 serving as an inflection point with U-shaped change characteristics in terms of the temporal dimension. The official implementation of several techniques, such as green governance, has resulted in a consistent and high-quality improvement in green governance efficiency. All input redundancies are harmed by the technology environment, implying that the technology market is the ultimate goal of green governance and a critical position to enhance resource use efficiency and remove input redundancies. The redundancy of green organizational building capacity and green organizational configurations capacity has a significant beneficial association with the economic environment, but it can absorb the redundancy of green investment capability, green service capability, and green operations capacity positively. The use of the market to manage the complementary roles of social and financial capital becomes a vital component of the optimal regulation of green governance efficiency.
3) Between 2004 and 2015, China’s industrial efficiency increased substantially. Specifically, the efficiency of the production and wastewater sub-stages has substantially increased, but the efficiency of the solid waste and waste gas treatment sub-stages has not improved significantly. Significant results show as a correlation between GDP growth and GHG emission. (It caused an increase of GHG releases, i.e., emissions with the perspective of Canada due to growth in GDP.) The corresponding growth in gross domestic product, i.e., GDP due to swings in economic movement showed significant and positive impacts on GHG releases, i.e., emissions. Whereas other side nations who utilize greater energy also experience challenges of energy security and greater volume GHG emissions per capita. Results indicate that in both well-developed and welfare nation’s fossil fuels subsidies caused a greater energy utilizing nations experience and face challenges of greater GHG releases, i.e., emissions and energy security per capita. Furthermore, different research studies also show that both well-developed and welfare nations caused a greater volume of using fossil fuels. Because of the increasing trend toward the utilization of renewable energy, similar strategies are being depressed. Reduction in subsidy is forecasted in Australia to decrease GHG releases, i.e., emissions by the year 2030 will be 12%. GHG values demonstrate the energy being utilized in those nations is typically being generated from the sources of fossil fuel. Conversely, those nations experiencing the lowermost GHG have greater energy of renewable utilization, for instance, Iceland has 77.03% renewable energy; it also has GHG releases, emissions per unit utilization of energy.
The following policy implications can be taken from the preceding findings.
China’s market-based energy market process will be refined, and a comprehensive and uniform energy pricing system will be established. Unless an efficient reformed energy pricing system is in place, energy price anomalies cannot be removed, and excessive carbon emissions and power consumption cannot be managed, all at the expense of GEE progress. Furthermore, because different fossil fuel costs are not consistently marketized, the prospect of replacing clean energy with low-cost, high-polluting alternatives is increasing. As a result, the government should focus on reforming the oil and natural gas pricing, which are now inadequately market-oriented. Energy price changes must be implemented at all levels to create a complete and consistent pricing structure.
Diverse energy pricing strategies for different regions should be implemented. Attempts to reduce the outflow of local energy advantages encourage the free movement of energy components across areas, and reduce the geographical agglomeration of energy price distortions, on the other hand, should decrease market segmentation.
Energy price changes must be pushed simultaneously as new technologies develop and energy usage is optimized. Hence, the government launched the Egyptian Pollution Abatement Project (EPAP), which seeks to encourage renewables production (Hamed and El Mahgary, 2004). The issue of pollution is a primary concern for China due to China’s importation of oil and gas to meet rising domestic consumption. As a result, the government has adopted measures to meet this increasing demand, neglecting energy efficiency. The growth in fossil fuel supply has worsened the pollution rate. The country bore the brunt of the most damage cost of air pollutions, which is 21% of its GDP in the region, responsible for the overall 44% environmental costs. Given this background, renewables are seen as cleaner energy sources to help achieve energy security and avoid pollution.
The original contributions presented in the study are included in the article/Supplementary Material. Further inquiries can be directed to the corresponding authors.
All authors listed have made a substantial, direct, and intellectual contribution to the work and approved it for publication.
The authors declare that the research was conducted in the absence of any commercial or financial relationships that could be construed as a potential conflict of interest.
All claims expressed in this article are solely those of the authors and do not necessarily represent those of their affiliated organizations, or those of the publisher, the editors, and the reviewers. Any product that may be evaluated in this article, or claim that may be made by its manufacturer, is not guaranteed or endorsed by the publisher.
Baloch, Z. A., Tan, Q., Iqbal, N., Mohsin, M., Abbas, Q., Iqbal, W., et al. (2020). Trilemma Assessment of Energy Intensity, Efficiency, and Environmental index: Evidence from BRICS Countries. Environ. Sci. Pollut. Res. 27, 34337–34347. doi:10.1007/s11356-020-09578-3
Bian, Y., He, P., and Xu, H. (2013). Estimation of Potential Energy Saving and Carbon Dioxide Emission Reduction in China Based on an Extended Non-radial DEA Approach. Energy Policy 63, 962–971. doi:10.1016/J.ENPOL.2013.08.051
Charnes, A., Cooper, W. W., and Rhodes, E. (1978). Measuring the Efficiency of Decision Making Units. Eur. J. Oper. Res. 2 (6), 429–444.
Ding, L.-L., Lei, L., Wang, L., and Zhang, L.-F. (2020). Assessing Industrial Circular Economy Performance and its Dynamic Evolution: An Extended Malmquist index Based on Cooperative Game Network DEA. Sci. Total Environ. 731, 139001. doi:10.1016/j.scitotenv.2020.139001
Emrouznejad, A., Anouze, A. L., and Thanassoulis, E. (2010). A Semi-oriented Radial Measure for Measuring the Efficiency of Decision Making Units with Negative Data, Using DEA. Eur. J. Oper. Res. 200, 297–304. doi:10.1016/j.ejor.2009.01.001
Emrouznejad, A., and Yang, G.-L. (2018). A Survey and Analysis of the First 40 Years of Scholarly Literature in DEA: 1978-2016. Socio-Economic Plann. Sci. 61, 4–8. doi:10.1016/j.seps.2017.01.008
Halicioglu, F., and Ketenci, N. (2018). Output, Renewable and Non-Renewable Energy Production, and International Trade: Evidence from EU-15 Countries. Energy 159, 995–1002.
Halkos, G., and Petrou, K. N. (2019). Assessing 28 EU Member States' Environmental Efficiency in National Waste Generation with DEA. J. Clean. Prod. 208, 509–521. doi:10.1016/j.jclepro.2018.10.145
Hamed, M. M., and El Mahgary, Y. (2004). Outline of a National Strategy for Cleaner Production: The Case of Egypt. J. Clean. Prod. 12 (4), 327–336.
Hao, Y., Gai, Z., and Wu, H. (2020). How Do Resource Misallocation and Government Corruption Affect green Total Factor Energy Efficiency? Evidence from China. Energy Policy 143, 111562. doi:10.1016/j.enpol.2020.111562
Hao, L. N., Umar, M., Khan, Z., and Ali, W. (2021). Green Growth and Low Carbon Emission in G7 Countries: How Critical the Network of Environmental Taxes, Renewable Energy and Human Capital is? Sci. Total Environ. 752, 141853.
He, L., Liu, R., Zhong, Z., Wang, D., and Xia, Y. (2019). Can green Financial Development Promote Renewable Energy Investment Efficiency? A Consideration of Bank Credit. Renew. Energ. 143, 974–984. doi:10.1016/j.renene.2019.05.059
He, W., Abbas, Q., Alharthi, M., Mohsin, M., Hanif, I., Vinh Vo, X., et al. (2020). Integration of Renewable Hydrogen in Light-Duty Vehicle: Nexus between Energy Security and Low Carbon Emission Resources. Int. J. Hydrogen Energ. 45, 27958–27968. doi:10.1016/j.ijhydene.2020.06.177
Ikram, M., Mahmoudi, A., Shah, S. Z. A., and Mohsin, M. (2019a). Forecasting Number of ISO 14001 Certifications of Selected Countries: Application of Even GM (1,1), DGM, and NDGM Models. Environ. Sci. Pollut. Res. 26, 12505–12521. doi:10.1007/s11356-019-04534-2
Ikram, M., Sroufe, R., Mohsin, M., Solangi, Y. A., Shah, S. Z. A., and Shahzad, F. (2019b). Does CSR Influence Firm Performance? A Longitudinal Study of SME Sectors of Pakistan. Jgr 11, 27–53. doi:10.1108/jgr-12-2018-0088
Kang, Y.-Q., Xie, B.-C., Wang, J., and Wang, Y.-N. (2018). Environmental Assessment and Investment Strategy for China's Manufacturing Industry: A Non-radial DEA Based Analysis. J. Clean. Prod. 175, 501–511. doi:10.1016/j.jclepro.2017.12.043
Kortelainen, M. (2008). Dynamic Environmental Performance Analysis: A Malmquist index Approach. Ecol. Econ. 64, 701–715. doi:10.1016/j.ecolecon.2007.08.001
Kozhakhmetova, A. K., Gabdullin, K. T., Kunanbayeva, D. A., Tazhiyeva, S. K., and Kydaybergenova, R. E. (2019). Green Energy Project`s Efficiency: a Cross-Industry Evaluation. Ijeep 9, 207–215. doi:10.32479/ijeep.8137
Lee, J. W., and Brahmasrene, T. (2020). Exchange Rate Movements and Structural Break on China FDI Inflows. Ce 14, 112–126. doi:10.5709/ce.1897-9254.335
Long, X., Sun, M., Cheng, F., and Zhang, J. (2017). Convergence Analysis of Eco-efficiency of China’s Cement Manufacturers Through Unit Root Test of Panel Data. Energy 134, 709–717.
Mohsin, M., Hanif, I., Taghizadeh-Hesary, F., Abbas, Q., and Iqbal, W. (2021). Nexus between Energy Efficiency and Electricity Reforms: A DEA-Based Way Forward for Clean Power Development. Energy Policy 149, 112052. doi:10.1016/j.enpol.2020.112052
Mohsin, M., Nurunnabi, M., Zhang, J., Sun, H., Iqbal, N., Iram, R., et al. (2020a). The Evaluation of Efficiency and Value Addition of IFRS Endorsement towards Earnings Timeliness Disclosure. Int. J. Fin Econ. 26, 1793–1807. doi:10.1002/ijfe.1878
Mohsin, M., Rasheed, A. K., Sun, H., Zhang, J., Iram, R., Iqbal, N., et al. (2019). Developing Low Carbon Economies: An Aggregated Composite index Based on Carbon Emissions. Sustainable Energ. Tech. Assessments 35, 365–374. doi:10.1016/j.seta.2019.08.003
Mohsin, M., Taghizadeh-Hesary, F., Panthamit, N., Anwar, S., Abbas, Q., and Vo, X. V. (2020b). Developing Low Carbon Finance Index: Evidence from Developed and Developing Economies. Finance Res. Lett., 101520. doi:10.1016/j.frl.2020.101520
Mohsin, M., Zhou, P., Iqbal, N., and Shah, S. A. A. (2018). Assessing Oil Supply Security of South Asia. Energy 155, 438–447. doi:10.1016/J.ENERGY.2018.04.116
Musibau, H. O., Adedoyin, F. F., and Shittu, W. O. (2021). A Quantile Analysis of Energy Efficiency, green Investment, and Energy Innovation in Most Industrialized Nations. Environ. Sci. Pollut. Res. 28, 19473–19484. doi:10.1007/s11356-020-12002-5
Nasawat, P., Talangkun, S., Arunyanart, S., and Wichapa, N. (2021). Hybrid Cross-Efficiency Approach Based on Ideal and Anti-ideal Points and the Critic Method for Ranking Decision-Making Units: A Case Study on Ranking the Methods of rice Weevil Disinfestation. 10.5267/j.dsl 10, 375–392. doi:10.5267/j.dsl.2021.2.001
OECD (2011). Towards Green Growth: Monitoring Progress. Innovation: OECD Indicators. doi:10.1787/9789264111318-en
Omrani, H., Valipour, M., and Emrouznejad, A. (2021). A Novel Best Worst Method Robust Data Envelopment Analysis: Incorporating Decision Makers' Preferences in an Uncertain Environment. Operations Res. Perspect. 8, 100184. doi:10.1016/j.orp.2021.100184
Pastor, J. T., Lovell, C. A. K., and Aparicio, J. (2020). Defining a New Graph Inefficiency Measure for the Proportional Directional Distance Function and Introducing a New Malmquist Productivity index. Eur. J. Oper. Res. 281, 222–230. doi:10.1016/j.ejor.2019.08.021
Pavlyk, V. (2020). Assessment of green Investment Impact on the Energy Efficiency gap of the National Economy. Financ. Mark. Institutions Risks. doi:10.21272/fmir.4(1).117-123.2020
Sakr, D., and Sena, A. A. (2017). Cleaner production status in the Middle East and North Africa region with special focus on Egypt. J. Clean. Prod. 141, 1047–1086.
Simar, L., and Wilson, W. P. (2019). Central Limit Theorems and Inference for Sources of Productivity Change Measured by Nonparametric Malmquist Indices. Eur. J. Oper. Res. 277, 756–769. doi:10.1016/j.ejor.2019.02.040
Sueyoshi, T., Goto, M., and Wang, D. (2017). Malmquist index Measurement for Sustainability Enhancement in Chinese Municipalities and Provinces. Energ. Econ. 67, 554–571. doi:10.1016/j.eneco.2017.08.026
Sun, H.-p., Tariq, G., Haris, M., and Mohsin, M. (2019). Evaluating the Environmental Effects of Economic Openness: Evidence from SAARC Countries. Environ. Sci. Pollut. Res. 26, 24542–24551. doi:10.1007/s11356-019-05750-6
Sun, H., Pofoura, A. K., Adjei Mensah, I., Li, L., and Mohsin, M. (2020). The Role of Environmental Entrepreneurship for Sustainable Development: Evidence from 35 Countries in Sub-saharan Africa. Sci. Total Environ. 741, 140132. doi:10.1016/j.scitotenv.2020.140132
Sun, L., Cao, X., Alharthi, M., Zhang, J., Taghizadeh-Hesary, F., and Mohsin, M. (2020a). Carbon Emission Transfer Strategies in Supply Chain with Lag Time of Emission Reduction Technologies and Low-Carbon Preference of Consumers. J. Clean. Prod. 264, 121664. doi:10.1016/j.jclepro.2020.121664
Sun, L., Qin, L., Taghizadeh-Hesary, F., Zhang, J., Mohsin, M., and Chaudhry, I. S. (2020b). Analyzing Carbon Emission Transfer Network Structure Among Provinces in China: New Evidence from Social Network Analysis. Environ. Sci. Pollut. Res. 27, 23281–23300. doi:10.1007/s11356-020-08911-0
Tavana, M., Khalili-Damghani, K., Santos Arteaga, F. J., and Hashemi, A. (2020). A Malmquist Productivity index for Network Production Systems in the Energy Sector. Ann. Oper. Res. 284, 415–445. doi:10.1007/s10479-019-03173-7
Tone, K. (2001). A Slacks-Based Measure of Efficiency in Data Envelopment Analysis. Eur. J. Oper. Res. 130 (3), 498–509.
Wang, M., and Feng, C. (2020). Regional Total-Factor Productivity and Environmental Governance Efficiency of China's Industrial Sectors: A Two-Stage Network-Based Super DEA Approach. J. Clean. Prod. 273, 123110. doi:10.1016/j.jclepro.2020.123110
Wu, H., Hao, Y., and Ren, S. (2020). How Do Environmental Regulation and Environmental Decentralization Affect green Total Factor Energy Efficiency: Evidence from China. Energ. Econ. 91, 104880. doi:10.1016/j.eneco.2020.104880
Wu, H., Hao, Y., Ren, S., Yang, X., and Xie, G. (2021). Does Internet Development Improve green Total Factor Energy Efficiency? Evidence from China. Energy Policy 153, 112247. doi:10.1016/j.enpol.2021.112247
Yang, Z., Abbas, Q., Hanif, I., Alharthi, M., Taghizadeh-Hesary, F., Aziz, B., et al. (2021). Short- and Long-Run Influence of Energy Utilization and Economic Growth on Carbon Discharge in Emerging SREB Economies. Renew. Energ. 165, 43–51. doi:10.1016/j.renene.2020.10.141
Yang, L., Tang, K., Wang, Z., An, H., and Fang, W. (2017). Regional Eco-efficiency and Pollutants’ Marginal Abatement Costs in China: a Parametric Approach. J. Clean. Prod. 167, 619–629.
Yeşilyurt, M. E., Şahin, E., Elbi, M. D., Kızılkaya, A., Koyuncuoğlu, M. U., and Akbaş-Yeşilyurt, F. (2021). A Novel Method for Computing Single Output for DEA with Application in Hospital Efficiency. Socio-Economic Plann. Sci. 76, 100995. doi:10.1016/j.seps.2020.100995
Yuan, Y., Yu, X., Yang, X., Xiao, Y., Xiang, B., and Wang, Y. (2017). Bionic Building Energy Efficiency and Bionic green Architecture: A Review. Renew. Sustainable Energ. Rev. 74, 771–787. doi:10.1016/j.rser.2017.03.004
Zhang, J., Liu, Y., Chang, Y., and Zhang, L. (2017). Industrial Eco-Efficiency in China: A Provincial Quantification Using Three-Stage Data Envelopment Analysis. J. Cleaner Prod. 143, 238–249.
Zhou, P., Poh, K. L., and Ang, B. W. (2007). A Non-radial DEA Approach to Measuring Environmental Performance. Eur. J. Oper. Res. 178, 1–9. doi:10.1016/j.ejor.2006.04.038
Zhou, P., and Ang, B. W. (2008). Decomposition of Aggregate CO2 Emissions: A Production-Theoretical Approach. Energy Economics, 30 (3), 1054–1067.
Zhou, P., Ang, B. W., and Poh, K. L. (2008). Measuring Environmental Performance Under Different Environmental DEA Technologies. Energy Econ. 30 (1), 1–14.
Zhou, Y., Xing, X., Fang, K., Liang, D., and Xu, C. (2013). Environmental Efficiency Analysis of Power Industry in China Based on an Entropy SBM Model. Energy Policy 57, 68–75. doi:10.1016/j.enpol.2012.09.060
Keywords: green governance efficiency, provincial, spatial pattern, generalized panel three-stage DEA, spatial effects
Citation: Chen X, Liu Z, Saydaliev HB, Abu Hatab A and Fang W (2021) Measuring Energy Efficiency Performance in China: Do Technological and Environmental Concerns Matter for Energy Efficiency?. Front. Energy Res. 9:779032. doi: 10.3389/fenrg.2021.779032
Received: 17 September 2021; Accepted: 28 October 2021;
Published: 24 December 2021.
Edited by:
Muhammad Mohsin, Jiangsu University, ChinaReviewed by:
Muhammad Haris, NFC Institute of Engineering and Technology (NFCIET), PakistanCopyright © 2021 Chen, Liu, Saydaliev, Abu Hatab and Fang. This is an open-access article distributed under the terms of the Creative Commons Attribution License (CC BY). The use, distribution or reproduction in other forums is permitted, provided the original author(s) and the copyright owner(s) are credited and that the original publication in this journal is cited, in accordance with accepted academic practice. No use, distribution or reproduction is permitted which does not comply with these terms.
*Correspondence: Wei Fang, ZmFuZ3dlaUBnZGFhcy5jbg==; Zhen Liu, emhlbmxpdV9jbkB5YWhvby5jb20=
Disclaimer: All claims expressed in this article are solely those of the authors and do not necessarily represent those of their affiliated organizations, or those of the publisher, the editors and the reviewers. Any product that may be evaluated in this article or claim that may be made by its manufacturer is not guaranteed or endorsed by the publisher.
Research integrity at Frontiers
Learn more about the work of our research integrity team to safeguard the quality of each article we publish.