 Chunhua Fang1
 Yuning Tao
95% of researchers rate our articles as excellent or good
Learn more about the work of our research integrity team to safeguard the quality of each article we publish.
Find out more
ORIGINAL RESEARCH article
Front. Energy Res. , 12 November 2021
Sec. Smart Grids
Volume 9 - 2021 | https://doi.org/10.3389/fenrg.2021.777230
This article is part of the Research Topic Advanced Anomaly Detection Technologies and Applications in Energy Systems View all 64 articles
A fundamental parameter of polluted insulator online monitoring is the leakage current, which has already been shown to be well-related to the pollution discharge of insulators. In this article, in an effort to quantitatively reflect the discharge intensity and the discharge status by the leakage current, we carried out an experimental study on artificial pollution discharge of insulators. A high-speed photographic apparatus was utilized to capture the entire process of local arcs on a porcelain insulator surface, including the arc generation, the arc development, and the flashover, for which the associated leakage current of insulators was synchronously digitized. A comparative analysis of the relation between the two-dimensional discharge image and the leakage current waveform in the process of arc generation and development shows that if the arc area on the insulator surface is relatively small and the leakage current passes through zero, the arc might completely become extinct, whereas this phenomena will not occur if the arc area is larger. In addition, the amplitude of the discharge arc area is found to be roughly proportional to the square of leakage current over the range of leakage current amplitude from 0 to 150 mA. Our results can provide an important guidance for judgment of the discharge status and the discharge intensity on insulator surfaces using the leakage current of insulators.
Transmission line insulators are exposed to the natural environment during their long operation period, and the pollutants floating in the air are easily deposited on insulator surfaces under the influence of various external forces, leading to pollution of the insulators (Liu et al., 2020; Shen et al., 2020; Yang et al., 2021; Shen et al., 2021; Shen et al., 2021). Under severe weather conditions, such as fog, dew, and drizzle, the flashover might occur even at normal operating voltage, resulting in serious threats to the safe and stable operation of the power system (Yang et al., 2019; Yang et al., 2020; Shen and Raksincharoensak, 2021). Generally, the pollution flashover will experience four stages: the pollution deposition, the wetting, the dry band formation, and the local arc generation and flashover development. A discharge arc will be generated before flashover (Yang et al., 2019; Shen et al., 2020; Zhu et al., 2020; Noman et al., 2021; Shen and Pongsathorn, 2021). Meanwhile, the leakage current is associated with the whole operation process of insulators and is able to reflect the generation, development, extinction of the arc and, if possible, the full flashover. The leakage current, whose amplitude is affected by the pollution level, the humidity, the discharge strength, etc., may also be used to reflect the insulator surface condition, the climatic condition, and the applied voltage condition. In recent years, many efforts have been devoted to determining the discharge status using the leakage current (Yang and Di, 2018; Zhang and Luo, 2018; Bakeer Abualkasim et al., 2021; Li et al., 2021; Nayak et al., 2021).
There is a belief that the leakage current waveform of insulators can be well-related to the arc condition (Gencoglu and Cebeci, 2009; Du et al., 2012; Cong and Li, 2014). The leakage current can be used to distinguish three different discharge statuses of insulators, namely, no discharge, arc discharge, and continuous arc discharge (Ahmadi–Joneidi et al., 2013). If the discharge is weak and invisible, the amplitude of leakage current, in a form of sine wave, is relatively small. When a filamentous discharge occurs, the leakage current is featured with small pulses with a triangular shape; furthermore, if there exists a small amount of weak arcs, a distorted triangular waveform will be presented. However, if the discharge becomes intense, the leakage current pulse will be larger in amplitude and will occur more frequently, the waveform being distorted as well, with a shape of an inhomogeneous sine wave (Kumagai and Yoshimura, 2004; Pylarinos et al., 2012; Moula et al., 2013). The length and strength of the resultant discharge arc will also periodically change along with the variation of the alternating leakage current flowing through the equipment surface, and hence, whether the arc quenches or reignites can be determined through the observation of the leakage current waveform (Claverie and Porcheron, 2007).
Although many studies have been carried out to correlate the discharge status of insulators with the leakage current, due in part to the complex relationship between each, this issue has not been fully solved. To our knowledge, until now, the discharge status of insulators is still in the stage of qualitative description, and the relations between the pollution discharge status, the discharge strength of the insulator, and the leakage current are not clear. Therefore, it is urgent to build a quantitative relation between the discharge strength and the leakage current.
In the present work, an experimental study on artificial pollution discharge is conducted in an artificial fog room. A high-speed photographic apparatus was utilized to capture the entire process of local arcs on a porcelain insulator surface, including the arc generation, the arc development, and the flashover, for which the associated leakage current of insulators was synchronously digitized. We discuss the relationship between the leakage current and the arc area.
The structure and parameters of the test XP-70 insulator are presented in Table 1. The schematic diagram of the artificial pollution test is shown in Figure 1. The test is conducted in a pollution chamber with a width of 2 m, a length of 2 m, and a height of 4 m. The power supply of the test object, seven pieces of XP-70 insulators in this article, is supplied by a transformer cascade. The system frequency is 50 Hz. The transformer cascade, with a maximum output voltage and rated capacity of 500 kV and 1 MVA, respectively, is equipped with two test transformers of divided high voltage winding, and its primary voltage is adjusted by a regulating transformer. The voltage is applied to the test object via the bushings of the pollution chamber. For the measurement of the applied high voltage, a capacitive voltage divider, with a ratio of 1:1920, is used. Voltage and leakage current signals are simultaneously digitized in a leakage current measurement system, with a sampling rate of 100 kHz.
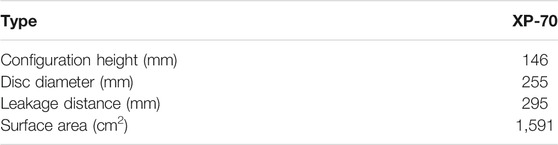
TABLE 1. Structure figure and parameters of the XP-70 insulator.
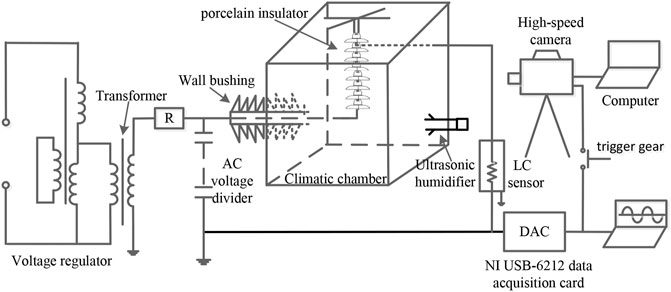
FIGURE 1. Schematic diagram of the artificial pollution test.
The predeposit method is adopted as the pollution procedure, as recommended in IEC 60507-2013 (IEC, 1991; IEC, 2004). This method is based on coating the test object with a conductive suspension of diatomite in water. The conductivity of the suspension is adjusted by salt (NaCl). Depending on the pollution class, the artificial pollution test is performed with different intensities of pollution. The pollution content required in each string of the test object was calculated according to the salt deposit density and the non-soluble deposit density required by the test object and surface area of the insulator. The test insulators were cleaned by washing with tap water and then the coating of the test insulators was made by flow coating. They were dried for 24 h to ensure a thermal equilibrium with the ambient conditions in the pollution chamber. Based on the IEC60507-1987 standard, equivalent salt deposit density (ESDD) = 0.3 mg/cm2 is applied to the experiment, and the non-soluble deposit density (NSDD) is set to 1.0 mg/cm2.
The test object was hanged in the center of the pollution chamber, which was closed during the test. Two pieces of diagonally arranged steam-fog equipment, of which the delivered fog amount can be adjusted, were used to produce cold fog to humidify the pollutants on the insulator surface. However, fog supply should be terminated when the water droplets appear on the insulator surface.
The relation between the leakage current flowing through the insulator surface and the discharge arc is investigated in this study. The discharge development process with the uniform step-up method is relatively faster than that with subsequent applications of the test voltage, which is held constant, and helpful for the synchronous monitoring of the leakage current and discharge phenomenon (Lambeth, 1988). As a result, the uniform step-up method was adopted in the test. Thus, the voltage was applied at uniform speed after the pollutants on the insulator surface were totally wetted until the full flashover occurred.
In the test, the self-developed leakage current measurement system was adopted to perform acquisition of the leakage current, with a sampling rate of 100 kS/s. High-speed video frames showing the development of the arc were recorded using a Photron SA1.1 high-speed camera operating at a framing rate of 1 kfps (kiloframes per second), with 640 pixels × 640 pixels. The high-speed camera was positioned approximately 1 m from the test object. Both the data acquisition card for measurement of the leakage current and the high-speed camera had external triggered function. In order to obtain synchronous recorded data, the synchronized trigger technology of the switch was used.
The white part of the discharge arc image is arc, and its size changes with discharge strength. According to the aforementioned characteristics, image processing technology is utilized to quantify the discharge arc, and the image processing block diagram is shown in Figure 2. The arc image of the whole insulator surface collected by the high-speed camera is the RGB image. First, the RGB image is converted into a gray image and noise processing is performed on it. Second, arc information is enhanced with the image enhancement technique, and the image is converted into a binary image with threshold segmentation, thus extracting the arc area and segment arc from the image. As the edge of the segmented photo is not smooth, the edge detection operator is used to detect the arc edge. Finally, a filling algorithm is applied to fill the arc edge image to get the arc area (Chaou et al., 2015; Zhang et al., 2021).

FIGURE 2. Block diagram of image processing.
The image through the foregoing processing is the binary image. It consists of 1 and 0, where 1 stands for the discharge arc and 0 for the background. The arc area can be obtained by calculating the number of points whose pixel is 1 in a 2D image. The mathematical expression of pixel point number calculation is as follows:
where,
The area of the discharge arc is the number of pixel point, so the unit of area defined in this article is pixel (Chaou et al., 2015). In the formula, i and j represent the position coordinates of the pixel in the image.
A discharge RGB color image in Figure 3A is transformed to a gray image in Figure 3B; the discharge region is brighter than the background image. Next, noise processing and image enhancement technique are performed on it; the enhanced image is shown in Figure 3C. Then, the threshold segmentation algorithm is used to convert the gray image into a binary image, when the threshold value is set to 190; the binary image is shown in Figure 3D. The edge of the image is the place where the pixel gray scale changes, carrying a wealth of arc image information, in order to accurately depict the outline of the arc image. In order to accurately depict the contour of the arc image, the edge must be extracted accurately. A Canny operator is a multistage optimization operator with filtering, enhancement, and detection (Mason et al., 1975; Lambeth, 1988; Zhang et al., 2021). The Canny operator uses the Gaussian filter to smooth the arc image to reduce the influence of noise on the arc edge detection. In order to find the gradient magnitude maximum and suppress the non-maximum value, the finite difference of the first-order partial derivative is used to calculate the amplitude and direction of the gray gradient of the pixel point. The results of the edge detection using the Canny operator is shown in Figure 3E, which is filled with a connected region seed-filling algorithm for the closed bounded arc image. Starting from any pixel of the polymorphic interior, we judge the adjacent pixels from left to right and from top to bottom. If it is not the boundary pixel point and not been filled, it is filled up and its gray value is changed to 1. Then, the previous process is repeated until all pixels arc circle regions are filled. The filled image is shown in Figure 3F.
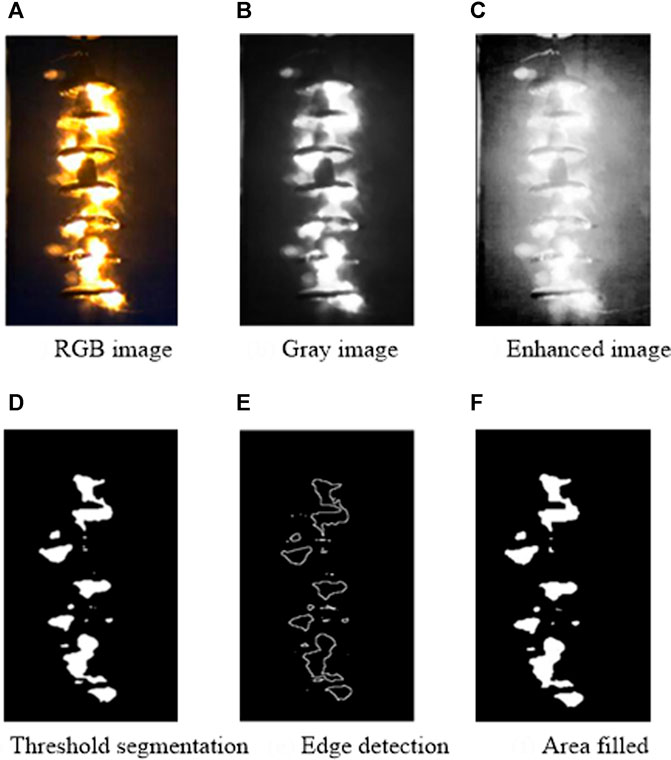
FIGURE 3. Image after digital processing.
Figure 4 shows the time-synchronized waveform of current and arc area variation for an entire arc discharge process, from the arc generation to the full flashover. During 0–0.447 s, 0.520–1.193 s, 1.39–1.974 s, 2.337–2.467 s, and 2.859–3.059 s, the amplitudes of leakage current were evenly above 50 mA, and the local arc, although relatively weak in luminosity, appeared on the insulator surface. During 3.809–4.334 s, the amplitude of the leakage current was averaged at 100 mA, with a maximum value of 150 mA, and the arc area increased accordingly. During 4.554–7.005 s, the amplitude of leakage current was suddenly increased, and the arc area was also featured with a sudden increase along with the leakage current. In other time however, the amplitudes of leakage current were generally small, and the insulator surface was not featured with any arc discharges. To the naked eye, it seems that there exists a good relationship between the leakage current and the associated arc area.
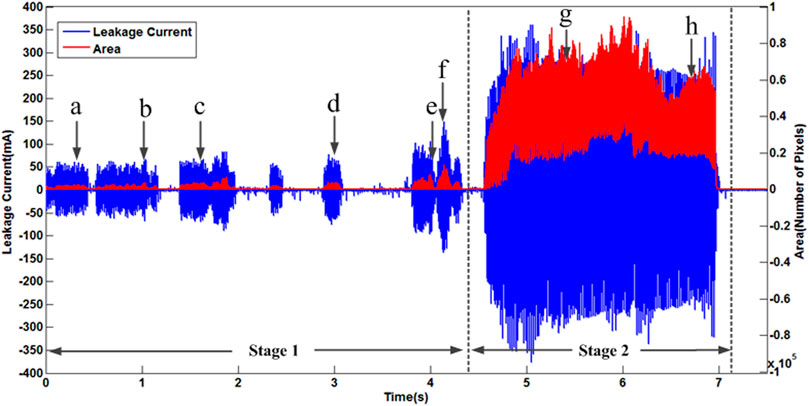
FIGURE 4. Leakage current and the discharge area.
The leakage current waveforms and the corresponding arc discharge area variation at different times of the developing process of discharge were chosen to conduct a further analysis. To compare the arc area and current data with the same temporal resolution, the current record was preprocessed by a subsection average procedure, with a 1 ms window width. The corresponding current value with a temporal resolution of 1 ms was calculated by averaging 100 original current data.
The discharge arcs in Figures 5A,B sporadically disperse on the insulator surface. The amplitudes of the resultant leakage current were about 50 mA, with very slight variations in the first and second half waves in one period. The “zero-crossing” phenomenon is relatively weak, similar to the triangular waveform for which the two-side part is relatively large and the middle part is relatively small. The corresponding arc area also presents a feature of being relatively large in the two-side part and relatively small in the middle part. Compared with Figures 5A,B, the discharge strength in Figure 5C increases and the leakage current amplitudes are mostly above 50 mA. Accordingly, the arc area, to a certain degree, also increases. The “zero-crossing” phenomenon is quite weak for the leakage currents shown in Figures 5A–C, in which when the electrical degree is about 60°, a phenomenon of faint current flicker occurs, and the corresponding arc area decreases abruptly and then increases abruptly.
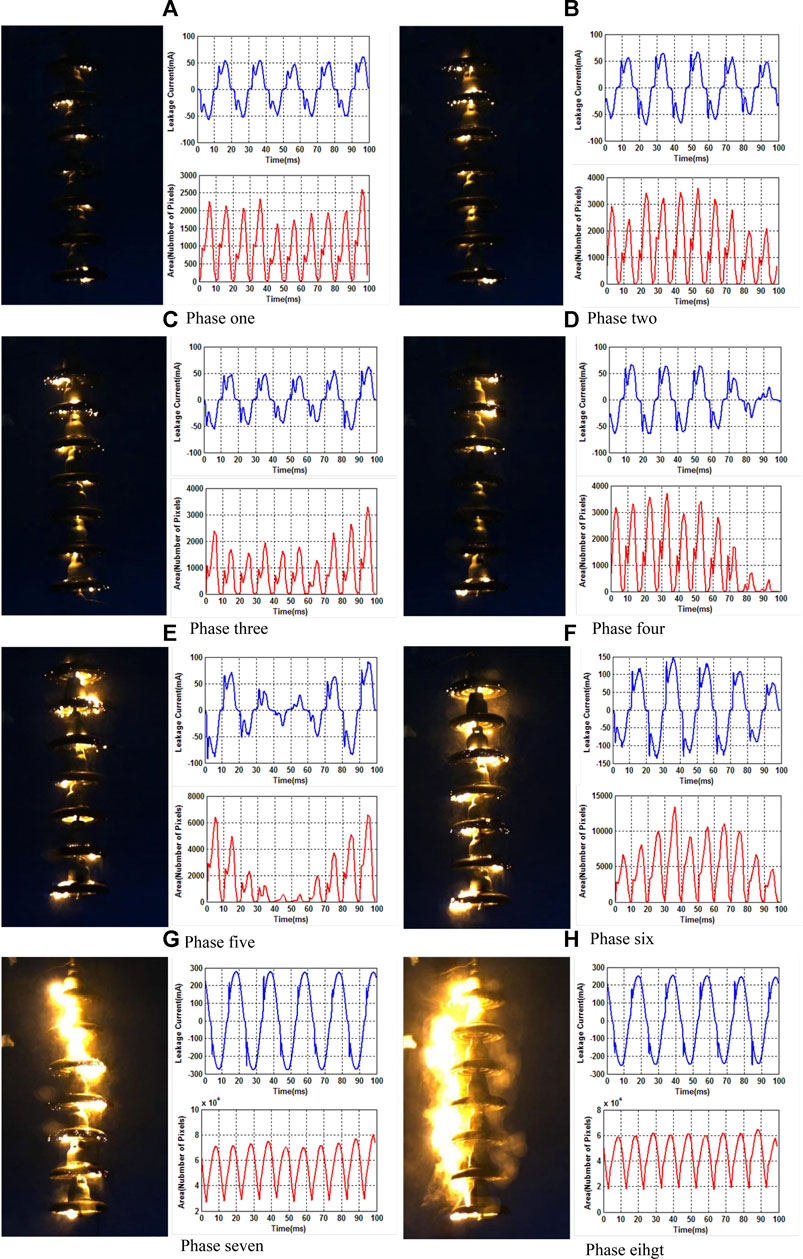
FIGURE 5. Leakage current waveform and the arc area.
The discharge spark in Figure 5D becomes intense and bright in luminosity. For the second piece of the insulator, the arcs on its upper surface and those on the lower one have a tendency to connect with each other. Meanwhile, the leakage current amplitude is mostly larger than 50 mA. The discharge spark in Figure 5E is larger in area, and the arcs in the upper surface and those in the lower one of the second piece of the insulator have been already connected. The discharges on the surface of several insulators between the top and bottom of the insulator are also obviously strengthened. In addition, the amplitudes of the first and second half waves in one period are featured with large variations, the maximum amplitude being about 100 mA. Waveforms in Figures 5D,E have severe distortion with the distinct “zero-crossing” phenomenon, and the discharge is quite weak when this current “zero-crossing” phenomenon occurs, the arc area being quite small.
A more intense discharge spark on the insulator surface is shown in Figure 5F. The amplitude of the corresponding leakage current is quite large, about 150 mA, and the amplitudes of the first and second half waves in one period are featured with large variations, with a trend of abrupt increase or of abrupt decrease. Compared with the last stage, the “zero-crossing” phenomenon is relatively weaker. However, the current flicker phenomenon is still obvious.
Comparing with Figures 5A–F, a sudden increase in the arc area can be found in Figures 5G,H. The arcs on most of the insulators in Figure 5G are connected, and those in Figure 5H are completely connected in two terminals. In this case, the leakage current rapidly increases, amplitudes being larger than 250 mA. The leakage current, with a waveform similar to the sine wave, has very slight variations in amplitudes of the first and second half parts in one period. In this case, the current “zero-crossing” phenomenon disappears, and the current flicker becomes weaker. The arc area also features with the sinusoidal variation trend, although the arc area variations do not pass zero. As is evident from the previous analyses, although the leakage current wave shapes for various discharge processes are different, a strong correlation can be found between the leakage current and the corresponding arc area. For example, when the leakage current reaches its positive or negative peak, the corresponding arc area will reach its maximum value, and when the leakage current passes through zero, the corresponding arc area will reach its minimum value. Moreover, it should be noted that the arc extinction occurs per half wave in one period in stage 1 (indicated in Figure 4). This can be probably interpreted as the fact that the smaller arc on the insulator surface, together with the smaller leakage current, corresponds to less stored energy and also shorter time required for the completion of deionization (Yang et al., 2014; Albano et al., 2016). In stage 2 (also indicated in Figure 4), possibly due to the fact that larger leakage current corresponds to more input energy and longer time required for deionization (Wang et al., 2014; Chaou et al., 2015), when the leakage current passes through zero, no arc extinctions will occur.
In the following analyses, the two simplest relationships, a linear correlation for the leakage current versus the arc area and for the leakage current squared versus the arc area, will be compared for the entire discharge process shown in Figure 5. Figure 6 presents the scatterplots of the current versus the arc area for six discharge processes given in Figure 5. We first use the simplest linear model to correlate the leakage current and light intensity, as directly shown in Figure 6. The correlation coefficients for five cases, shown in Figures 6A,C–H, are larger than 0.9, and only one case, shown in Figure 6B, is lower than 0.9. Moreover, the slopes of the regression lines in Figure 6 vary in a wide range, from 39.94 to 165.55. Furthermore, the intercepts of the regression lines also vary considerably. Figure 7 shows the scatterplots of the instantaneous value of leakage current squared versus the arc area shown in Figures 5A–H. Note that the regression lines in Figure 7 are constrained to pass through the origin. Although the resulting correlation coefficients in Figure 7 are, to a certain degree, larger than those in Figure 6, we cannot tell which relationship is more compelling only by comparing the correlation coefficients. The slopes of the regression lines in Figures 7A–F with current amplitudes below 150 mA are however found to be more or less constant (around 0.8) for different discharge processes. If we combine the results from Figures 7A–H, it appears that when the leakage current is smaller than 150 mA, a rough linear relationship exists between the leakage current squared and the arc area. When the leakage current is larger than 150 mA, the relation between the arc area and leakage current becomes complicated. We choose to leave that analysis for a later study.
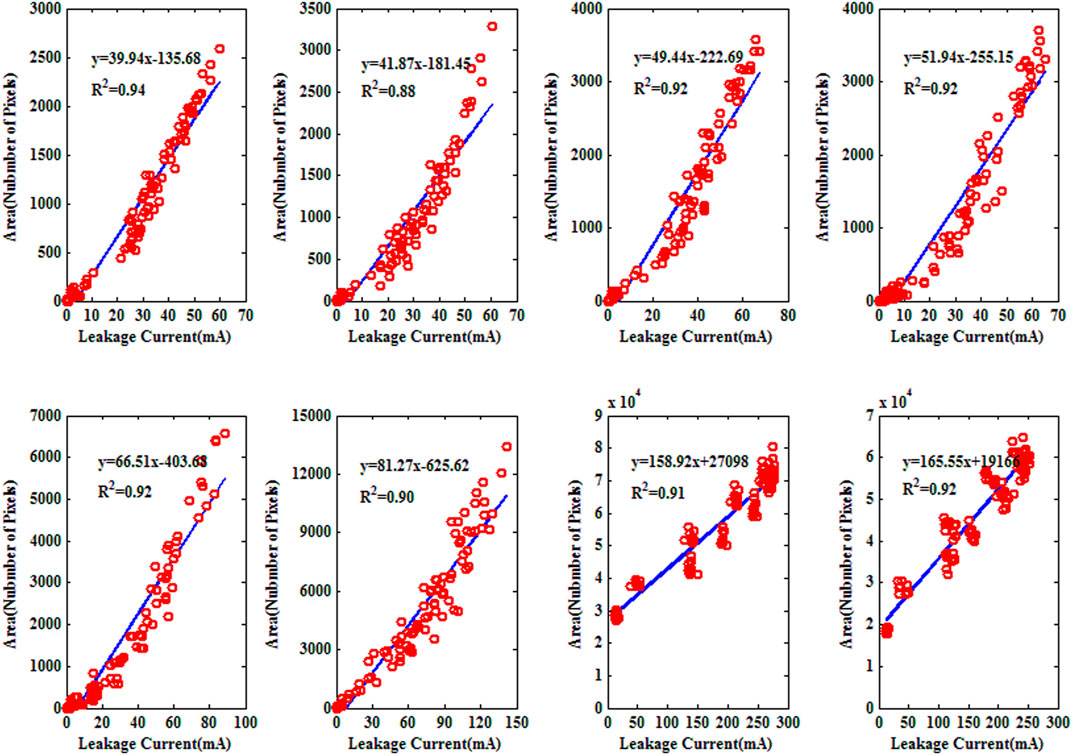
FIGURE 6. Relation between leakage current and the arc area.
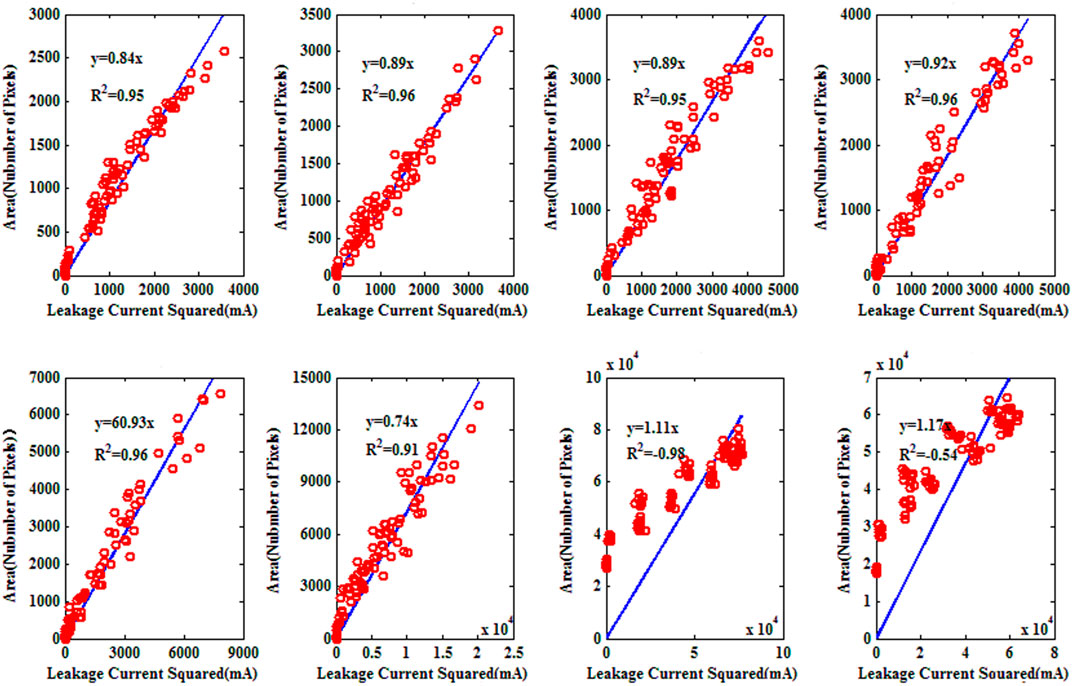
FIGURE 7. Relation between leakage current squared and the arc area.
1) When the leakage current reaches its positive or negative peak, the corresponding arc area will reach to its maximum value, and when the leakage current passes through zero, the corresponding arc area will reach to its minimum value. A strong correlation can be found between the leakage current and the corresponding arc area.
2) In the case that the arc on the insulator surface is relatively small, if the leakage current passes through zero, complete arc extinction may occur. In the case when the arc is relatively larger, even if the leakage current passes through zero, complete arc extinction will not occur.
3) A rough linear relationship exists between the leakage current squared and the arc area if the leakage current is smaller than 150 mA. This conclusion can be used as a proxy for judging the discharge strength using the leakage currents of insulators.
The original contributions presented in the study are included in the article/Supplementary Material; further inquiries can be directed to the corresponding author.
CF, JW, and CD conceived the idea and designed the experiments. CF and CD led the experiments. YT, LH, and MZ contributed to data analysis and interpretation. CF, YT, YG, and YW wrote the manuscript. All authors read and approved the final manuscript.
This paper is supported by the National Natural Science Foundation of China (Grant No. 51807110).
The authors declare that the research was conducted in the absence of any commercial or financial relationships that could be construed as a potential conflict of interest.
All claims expressed in this article are solely those of the authors and do not necessarily represent those of their affiliated organizations, or those of the publisher, the editors, and the reviewers. Any product that may be evaluated in this article, or claim that may be made by its manufacturer, is not guaranteed or endorsed by the publisher.
Ahmadi-Joneidi, I., Majzoobi, A., Shayegani-akmal, A. A., Mohseni, H., and Jadidian, J. (2013). Aging Evaluation of Silicone Rubber Insulators Using Leakage Current and Flashover Voltage Analysis. IEEE Trans. Dielect. Electr. Insul. 20, 212–220. doi:10.1109/TDEI.2013.6451360
Albano, M., Waters, R. T., Charalampidis, P., Griffiths, H., and Haddad, A. (2016). Infrared Analysis of Dry-Band Flashover of Silicone Rubber Insulators. IEEE Trans. Dielect. Electr. Insul. 23, 304–310. doi:10.1109/tdei.2015.005026
Bakeer, A., Salama, H. S., and Vokony, I. (2021). Integration of PV System with SMES Based on Model Predictive Control for Utility Grid Reliability Improvement. Prot. Control. Mod. Power Syst. 6. doi:10.1186/s41601-021-00191-1
Chaou, A. K., Mekhaldi, A., and Teguar, M. (2015). Elaboration of Novel Image Processing Algorithm for Arcing Discharges Recognition on HV Polluted Insulator Model. IEEE Trans. Dielect. Electr. Insul. 22, 990–999. doi:10.1109/TDEI.2014.00454910.1109/tdei.2015.7076800
Claverie, P., and Porcheron, Y. (1973). How to Choose Insulators for Polluted Areas. IEEE Trans. Power Apparatus Syst. PAS-92, 1121–1131. doi:10.1109/TPAS.1973.293679
Cong, W., and Li, T. (2014). Study of Composite Insulator Leakage Current Characteristics in Contamination and Humidity Conditions. 2014 IEEE Conference on Electrical Insulation and Dielectric Phenomena. doi:10.1109/ceidp.2014.6995783
Du, B. X., Han, T., Cheng, X. X., Li, J., and Ma, Z. L. (2012). Characterization of Surface Discharge as Indicator for Hydrophobicity Evaluation of Silicone Rubber Insulators. IEEE Trans. Dielect. Electr. Insul. 19, 1708–1714. doi:10.1109/TDEI.2012.6311519
Gencoglu, M. T., and Cebeci, M. (2009). Computation of AC Flashover Voltage of Polluted HV Insulators Using a Dynamic Arc Model. Euro. Trans. Electr. Power 19, 689–701. doi:10.1002/etep.249
Kumagai, S., and Yoshimura, N. (2004). Leakage Current Characterization for Estimating the Conditions of Ceramic and Polymeric Insulating Surfaces. IEEE Trans. Dielect. Electr. Insul. 11, 681–690. doi:10.1109/TDEI.2004.1324357
Lambeth, P. J. (1988). Variable-voltage Application for Insulator Pollution Tests. IEEE Trans. Power Deliv. 3, 2103–2111. doi:10.1109/61.194022
Li, Z., Jiang, W., Abu-Siada, A., Li, Z., Xu, Y., and Liu, S. (2021). Research on a Composite Voltage and Current Measurement Device for HVDC Networks. IEEE Trans. Ind. Electron. 68, 8930–8941. doi:10.1109/TIE.2020.3013772
Liu, Y., Yang, N., Dong, B., Wu, L., Yan, J., Shen, X., et al. (2020). Multi-Lateral Participants Decision-Making: A Distribution System Planning Approach with Incomplete Information Game. IEEE Access 8, 88933–88950. doi:10.1109/ACCESS.2020.2991181
Mason, D., Lauder, I., Rutovitz, D., and Spowart, G. (1975). Measurement of C-Bands in Human Chromosomes. Comput. Biol. Med. 5, 179–201. doi:10.1016/0010-4825(75)90004-9
Moula, B., Mekhaldi, A., Teguar, M., and Haddad, A. (2013). Characterization of Discharges on Non-uniformly Polluted Glass Surfaces Using a Wavelet Transform Approach. IEEE Trans. Dielect. Electr. Insul. 20, 1457–1466. doi:10.1109/TDEI.2013.6571469
Nayak, P. C., Prusty, R. C., and Panda, S. (2021). Grasshopper Optimization Algorithm Optimized Multistage Controller for Automatic Generation Control of a Power System with FACTS Devices. Prot. Control. Mod. Power Syst. 6. doi:10.1186/s41601-021-00187-x
Noman, M., Li, G., Wang, K., and Han, B. (2021). Electrical Control Strategy for an Ocean Energy Conversion System. Prot. Control. Mod. Power Syst. 6. doi:10.1186/s41601-021-00186-y
Pylarinos, D., Theofilatos, K., Siderakis, K., Thalassinakis, E., Vitellas, I., Alexandridis, A. T., et al. (2012). Investigation and Classification of Field Leakage Current Waveforms. IEEE Trans. Dielect. Electr. Insul. 19, 2111–2118. doi:10.1109/TDEI.2012.6396971
Shen, X., Ouyang, T., Khajorntraidet, C., Li, Y., Li, S., and Zhuang, J. (2021a). Mixture Density Networks-Based Knock Simulator. Ieee/asme Trans. Mechatron., 1. doi:10.1109/TMECH.2021.3059775
Shen, X., Ouyang, T., Yang, N., and Zhuang, J. (2021b). Sample-Based Neural Approximation Approach for Probabilistic Constrained Programs. IEEE Trans. Neural Netw. Learn. Syst., 1–8. doi:10.1109/TNNLS.2021.3102323
Shen, X., and Raksincharoensak, P. (2021). Pedestrian-aware Statistical Risk Assessment. IEEE Trans. Intell. Transport. Syst., 1–9. doi:10.1109/TITS.2021.3074522
Shen, X., and Raksincharoensak, P. (2021). Statistical Models of Near-Accident Event and Pedestrian Behavior at Non-signalized Intersections. J. Appl. Stat., 1–21. doi:10.1080/02664763.2021.1962263
Shen, X., Zhang, X., Ouyang, T., Li, Y., and Raksincharoensak, P. (2020b). Cooperative Comfortable-Driving at Signalized Intersections for Connected and Automated Vehicles. IEEE Robot. Autom. Lett. 5, 6247–6254. doi:10.1109/LRA.2020.3014010
Shen, X., Zhang, Y., Sata, K., and Shen, T. (2020a). Gaussian Mixture Model Clustering-Based Knock Threshold Learning in Automotive Engines. Ieee/asme Trans. Mechatron. 25, 2981–2991. doi:10.1109/TMECH.2020.3000732
Wang, S., Lv, F., and Liu, Y. (2014). Estimation of Discharge Magnitude of Composite Insulator Surface corona Discharge Based on Ultraviolet Imaging Method. IEEE Trans. Dielect. Electr. Insul. 21, 1697–1704. doi:10.1109/TDEI.2014.004358
Yang, H., Zhou, J., Li, Y., Pang, L., Yang, X., Zhang, Q., et al. (2014). Effect of Profiles on Ac Contamination Flashover Performance of Large-Tonnage Suspension Disc Insulators. IEEE Trans. Dielect. Electr. Insul. 21, 2476–2485. doi:10.1109/TDEI.2014.004530
Yang, N., and Di, Y. (2018). Research on Modelling and Solution of Stochastic SCUC under AC Power Flow Constraints. IET Generation, Transm. Distribution 12, 3618–3625. doi:10.1049/iet-gtd.2018.5151
Yang, N., Huang, Y., Hou, D., Liu, S., Ye, D., Dong, B., et al. (2019). Adaptive Nonparametric Kernel Density Estimation Approach for Joint Probability Density Function Modeling of Multiple Wind Farms. Energies 12, 1356. doi:10.3390/en12071356
Yang, N., Liu, S., Deng, Y., and Xing, C. (2020). An Improved Robust SCUC Approach Considering Multiple Uncertainty and Correlation. IEEJ Trans. Elec Electron. Eng. 16 (1), 21–34. doi:10.1002/tee.23265
Yang, N., Yang, C., Wu, L., Shen, X., Jia, J., Li, Z., et al. (2021). Intelligent Data-Driven Decision-Making Method for Dynamic Multi-Sequence: An E-Seq2Seq Based SCUC Expert System. IEEE Trans. Ind. Inf., 1. doi:10.1109/TII.2021.3107406
Zhang, L., and Luo, Y. (2018). Combined Heat and Power Scheduling: Utilizing Building-Level Thermal Inertia for Short-Term Thermal Energy Storage in District Heat System. IEEJ Trans. Elec Electron. Eng. 13, 804–814. doi:10.1002/tee.22633
Zhang, L., Xie, Y., Ye, J., Xue, T., Cheng, J., Li, Z., et al. (2021). Intelligent Frequency Control Strategy Based on Reinforcement Learning of Multi-Objective Collaborative Reward Function. Front. Energ. Res. 9. doi:10.3389/fenrg.2021.760525
Keywords: discharge arc, leakage current, mapping relation, polluted insulator, online monitoring
Citation: Fang C, Tao Y, Wang J, Ding C, Huang L, Zhou M, Gu Y and Wang Y (2021) Mapping Relation of Leakage Currents of Polluted Insulators and Discharge Arc Area. Front. Energy Res. 9:777230. doi: 10.3389/fenrg.2021.777230
Received: 15 September 2021; Accepted: 11 October 2021;
Published: 12 November 2021.
Edited by:
Xun Shen, Tokyo University of Agriculture and Technology, JapanReviewed by:
Xiang Nianwen, Hefei University, ChinaCopyright © 2021 Fang, Tao, Wang, Ding, Huang, Zhou, Gu and Wang. This is an open-access article distributed under the terms of the Creative Commons Attribution License (CC BY). The use, distribution or reproduction in other forums is permitted, provided the original author(s) and the copyright owner(s) are credited and that the original publication in this journal is cited, in accordance with accepted academic practice. No use, distribution or reproduction is permitted which does not comply with these terms.
*Correspondence: Yuning Tao, dGFveXVuaW5nMTJAMTYzLmNvbQ==
Disclaimer: All claims expressed in this article are solely those of the authors and do not necessarily represent those of their affiliated organizations, or those of the publisher, the editors and the reviewers. Any product that may be evaluated in this article or claim that may be made by its manufacturer is not guaranteed or endorsed by the publisher.
Research integrity at Frontiers
Learn more about the work of our research integrity team to safeguard the quality of each article we publish.