 Wasif Farooq
 Imtiaz Ali
 Salman Raza Naqvi
 Mohd Sajid
 Hassnain Abbas Khan
 Sagir Adamu1,5
- 1Department of Chemical Engineering, King Fahd University of Petroleum and Minerals (KFUPM), Dhahran, Saudi Arabia
- 2Department of Chemical and Materials Engineering, King Abdulaziz University, Rabigh, Saudi Arabia
- 3School of Chemical and Material Engineering (SCME), National University of Science and Technology (NUST), H-12, Islamabad, Pakistan
- 4King Abdullah University of Science and Technology (KAUST), Clean Combustion Research Center (CCRC), Physical Science and Engineering Division (PSE), Thuwal, Saudi Arabia
- 5Interdisciplinary Research Center for refining and Advance Chemicals, Dhahran, Saudi Arabia
This study investigates the efficacy of a prepared Ni/θ-Al2O3 catalyst during the pyrolytic conversion of Parachlorella kessleri HY-6 and compares the results with non-catalytic conversion. The catalyst was characterized by techniques such as Brunauer–Emmett–Teller (BET) for surface area, acidity, and X-ray powder diffraction (XRD). Isoconversional and combined kinetic methods were used to study the pyrolytic kinetics of the process. Ni/θ-Al2O3 was used at 10, 20, and 30% of the algal biomass. The addition of Ni/θ-Al2O3 facilitated the conversion by lowering the mean activation energy during pyrolysis. The catalytic effect was more pronounced at lower and higher conversions. The presence of the catalyst facilitated the pyrolysis as indicated by the lower value of activation energy and ∆H, and ∆G. Gases evolved during pyrolysis were qualitatively analyzed by FTIR to see the effect of catalyst on evolved gas composition during the pyrolysis process.
Introduction
The search for an appropriate alternative energy solution to fossil fuel is still in the research and development stage (Xu et al., 2020). Biomass, being a sustainable energy resource, has been under consideration for the past few decades. To date, the use of 1st and 2nd generation biomass (lignocellulosic and edible materials) is limited due to more land requirements, food vs. fuel concerns, and seasonal variations (Sekar et al., 2021). Microalgae is a potential third-generation biofuel as it can proliferate on unarable land using wastewater. The growth of microalgae offers the advantage of wastewater treatment and CO2 fixation. It has a higher per unit area yield of lipids for biodiesel than terrestrial plants (Lee et al., 2020). Microalgae is a unicellular microorganism composed of lipids, proteins, and carbohydrates found in the aquatic environment and proliferate (Gong et al., 2020).
Microalgae can be converted into multiple biofuels such as biodiesel and jet oil through three main thermochemical conversion routes such as gasification, pyrolysis, and hydrothermal liquefaction (Fan et al., 2020). Pyrolysis converts biomass to an intermediate liquid product which is later refined for drop-in hydrocarbon biofuels, oxygenated fuel additives, and petrochemical alternatives (Zhao et al., 2013). Pyrolysis is a widely used thermochemical conversion process where organic material is chemically dissociated by heating in the lack of oxygen (Naqvi et al., 2018; Chen et al., 2021). Pyrolysis occurs in the absence of oxygen at a particular temperature (300–700°C). The final product is obtained mainly as bio-oil and biochar, along with some non-condensable gaseous components. Pyrolysis is generally classified as slow, fast, and flash pyrolysis based on heating rates. The prediction of product type and its properties depends on the kind of microalgae, operating conditions, reactor types, and conversion mechanism (Chen et al., 2021). Usually, the bio-oil obtained from slow and fast pyrolysis has a noticeable amount of oxygen which can adversely affect the stability and quantity of the product (Azizi et al., 2018). The solution to this problem is the use of catalysts. The use of catalysts also helps to modify the reaction process for the production of upgraded fuels. The catalysts can be used along with biomass feed as well as in catalytic bed form. The utilization of catalysts in the pyrolysis process improves the quality of biofuels by reducing their acidity and viscosity (Babich et al., 2011). Catalysts influence the yield and composition of pyrolysis products, i.e. bio-oil, gas, and char. Various materials have been used as effective catalysts, such as zeolite, nickel, platinum, magnesium, and cobalt (Babich et al., 2011).
HZSM-5 is widely investigated because of its ability to improve bio-oil quality through deoxygenation. However, HZSM-5 has little effect on the nitrogen content of bio-oil (Mustapha et al., 2021). Bio-oil yield and its quality depend on the type of catalyst and temperature used during catalytic pyrolysis (Guo et al., 2012). Among these catalysts, Ni-based catalysts perform better during the pyrolysis due to their activity for decarboxylation or decarbonylation reactions during the hydride oxygenation process (Sekar et al., 2021). Alumina-supported Ni catalyst enhanced the cracking and reforming of volatile and tars during the gasification of biomass (Díaz-Rey et al., 2015). Silica-supported nickel phosphide catalyst improved the boil-oil yielded with low content of oxygen content (Zeng et al., 2013). Like many non-noble metals, Ni-based catalysts are ideal for pyrolysis catalysts because of their low cost and availability instead of noble metals (Rahemi et al., 2013). Nickle base catalysts were investigated for the deoxygenation process of triglycerides (Zhao et al., 2013).
However, many studies are available on the catalytic degradation of microalgae via pyrolysis processes to optimize biofuel production (Zhao et al., 2021). But still, it is difficult to establish its industrial-scale employment due to the lack of deep understanding of pyrolysis mechanism, conversion rate, the extent of conversion, and kinetic behavior (Ali et al., 2021). Kinetic modeling is a mathematical interpretation of how the reaction mechanism proceeds and determines the kinetic parameters. Typically, two types of kinetic approaches are available to measure the kinetic and thermodynamic parameters to evaluate the reaction path and behavior. One is a model-fitting approach that is based on the reaction mechanism. While the model-free approach is based on different heating rates, it is also called the isoconversional method (Naqvi et al., 2018). Knowing the kinetic and thermodynamic parameters of these reactions during thermal degradation will help design, optimize, and establish process conditions at the commercial level as kinetics help understand the reaction rate. At the same time, thermodynamics gives information about the equilibrium state of the reaction.
Thus, this work investigated the impact of Ni/θ-Al2O3 catalyst on the pyrolysis of Parachlorella kessleri HY-6 algae and focused on evolved gas analysis during pyrolysis. Results of catalytic conversion were compared with non-catalytic conversion. Isoconversional and combined kinetic methods are used to study the pyrolytic kinetics of the process. Ni/θ-Al2O3 is used at 10, 20, and 30% of the algal biomass. Knowing kinetic and thermodynamic parameters from these reaction models during thermal degradation will help design, optimize, and establish process conditions at the commercial level. The gases that evolved during the process were analyzed to assess the impact of the catalyst on the pyrolysis process.
Materials and Methods
Microalgae Biomass
Microalgae Parachlorella kessleri HY-6 was used in this research. Microalgae biomass was produced using modified Bold’s Basal Medium (BBM) as reported (Wadood et al., 2020)and briefly described here. Composition of BBM follows; 3.386 NaNO3, 0.170 CaCl2·2H2O, 0.304 MgSO4·7H2O, 0.054 KH2PO4, 0.049 K2HPO4, 0.428 NaCl, 0.185 H3BO3, EDTA solution (in mM) which contained 0.171 Na2EDTA·2H2O, 0.554 potassium hydroxide, ferric solution (in μM) having 17.9 FeSO4·7H2O. Trace metals solution (in μM) was composed of 7.28 MnCl2·4H2O, 30.7 ZnSO4·7H2O, 1.680 Co(NO3)2·6H2O, and 6.290 CuSO4·5H2O. The photobioreactor having a capacity of 4.0 L was used to conduct the growth at 25 ± 1°C under the continuous illumination of 60 μmol m−2 s−1. The aeration flow rate was 2.0 vvm with 3.5% CO2 in a batch series. The harvest period for microalgal cells was 16 days per batch via centrifugation process under the condition of 7,000 rpm for 4 min. After centrifugation, the sample was rinsed using distilled water and vacuum dried at 105°C. Biomass was ground in a kitchen grinder before its thermogravimetric analysis. Ultimate analysis of biomass was done using the elemental analyzer model Euro Vector EA 3000. Proximate and ultimate analysis of biomass is given in Table 1. ASTM standard methods E1756-08, E1755-01, and D3174-12 were used to obtain moisture, volatile matter, and ash contents, respectively.
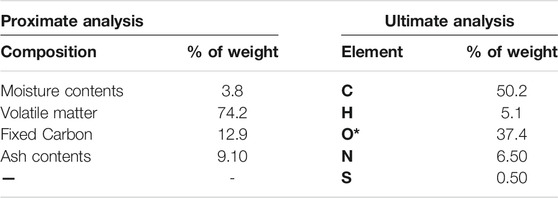
TABLE 1. Ultimate and proximate analyses of Parachlorella kessleri HY-6.
Synthesis of Catalyst
The catalyst (Ni/θ-Al2O3) was synthesized using a certain amount of metal precursors (nickel nitrate hexahydrate Ni(NO3)2·6H2O) onto commercial θ-alumina support through the incipient wetness impregnation method. Synthesis was done by adding 5 wt% of nickel precursor at each run to attain the anticipated 20 wt% Ni loading using syringe under vacuum and at room temperature. The paste was dried for 25 h, at laboratory conditions. The catalyst paste was reduced in a gaseous stream of 10% hydrogen in helium at 750°C in a vertical quartz glass tube, placed in a Thermcraft furnace. The detailed preparation is described in our preceding study (Adamu et al., 2018).
Thermogravimetric Analysis and Evolved Gas Analysis of Biomass Under Catalytic and Non-catalytic Conditions
The TGA of microalgae biomass with and without catalyst was carried out under 100 ml/min of nitrogen flow rate and at the temperature range of 50–700°C. Thermogravimetric experiments for kinetics analysis were conducted under three different heating rates, i.e., 5, 10, and 20°C/min using SDT Q600 equipment. During the non-catalytic process, about 7.0 mg of microalgae biomass was positioned in an alumina crucible and heated to 700°C at each heating rate. Under the catalytic process, biomass and catalyst samples were tested at 10% catalyst loadings using the same experimental conditions as non-catalytic processes. The percentage of weight loss and the differential weight loss with respect to temperature data were verified and evaluated in the results and discussion segment. Evolved gases were analyzed by TGA-FTIR as described (Abdul Jameel et al., 2017). Briefly, the evolved gases from TGA passed to IR cell (maintained at 200°C) via a heated line kept at 190°C with a built-in Swagelock 15 μm filter. The evolved gases spectra were recorded by FTIR equipment (Thermo Scientific Nicolet iS10) connected to the iZ10 interface. Pyrolysis reaction for evolved gas analysis was conducted from 25 to 950°C.
Catalyst Characterizations
Surface Properties of the Nickel Catalyst on an Alumina Support
The Micromeritics ASAP 2020 instrument measured surface properties via N2 as the probe molecule at 77 K. The catalyst sample was vented for 2.5 h at 300°C to eradicate contamination or bound moisture. The N2 adsorption/desorption experiments were performed to obtain the relevant data to compute the BET pore volume and surface area.
X-Ray Diffraction and SEM Analysis
A Rigaku Miniflex diffractometer functioning at 40 kV and 15 mA was used to inspect the crystalline properties of the Nickel/alumina catalyst. The scanned rate was 5°/min every 0.08° for a 2θ angle of 10°–90° for each run. The Joint Committee on Powder Diffraction Standards (JCPDS) data was applied in identifying the peaks at which the elements and stages exist. SEM image for the catalyst prepared was obtained using MIRA3 TESCAN high-resolution scanning electron microscope. The sample was coated with gold to 5 nm thickness using Ion Sputter Q 150 R S, from Quorum Technologies.
Temperature Program Desorption
NH3-TPD was done in a Micromeritics’ Autochem II 2920 analyzer to estimate the catalyst’s acidic value and examine the NH3 desorption kinetics of the catalyst as reported previously (Adamu et al., 2018). Briefly, about 0.10 g of sample was sited in a U-shaped quartz tube reactor. The catalyst was heated to 500°C in steps under reducing conditions (i.e., a gaseous mixture of H2 and helium in the ratio of 1:9) tracked by a 2 h isothermal degassing under the argon atmosphere. Catalyst samples were then flooded for 1 h with a gaseous mixture of 94.48% helium and 5.52% NH3 at 50 ml/min to soak the catalyst at 120°C. The reactor was heated to 750°C at the rate of 10 C/min. Ammonium desorption from the surface of the catalyst was watched by a thermal conductivity detector (TCD).
Kinetic Analysis
Under pyrolytic conditions, algal biomass is converted to volatiles and biochar. The following differential rate equation can describe this conversion.
where
where
Isoconversional Methods
Various analytical solutions of Eq. 2 in differential and integral forms are used to describe the kinetics of the conversion. Friedman and Kissinger-Akahira-Sunose (KAS) are commonly used differential and integral isoconversional solutions of the rate equation.
Estimation of the minimum energy for a conversion
Combined Kinetics
Combined kinetics offers a linearized rate equation for a single-step reaction. The reaction mechanism is described by a generalized form
Thermodynamic of Activation
The following correlations can describe thermodynamic parameters, such as changes in enthalpy, Gibbs free energy, and entropy.
where
Results and Discussion
Biomass Characterization
Results on ultimate and proximate analysis of biomass are summarized in Table 1.
Sufficient hydrocarbons and volatile matters coupled with lower moisture content indicate better quality and high yield of biofuels. Similarly, lower sulfur content is desirable from the environmental point of view. Nitrogen is an element of protein that is a major component of microalgal biomass. Besides these major components of microalgae biomass, a sufficiently higher amount of metals (K, Na, Mg, Ca) is also present due to growth media. The presence of high metal contents makes the microalgae biomass unique from lignocellulosic biomass. These metals can act as a catalyst as well during the pyrolysis process (López-González et al., 2014). Pyrolysis of microalgae is a complex process than lignocellulosic biomass because of the presence of various proteins, carbohydrates, lipids, and pigments along with metals.
Catalyst Characterization
Figures 1A,B shows the N2–adsorption desperation isotherms and the corresponding pore size distribution of the catalysts. The BET surface area, total pore volume, and average pore diameter are given in Table 2. The BET surface area is 65.63 m2/g. According to the IUPAC classification, the nitrogen adsorption-desorption isotherms for the catalyst show a typical type IV isotherm with H3 hysteresis loop (observed in P/Po 0.83–0.95), which indicated that the sample has a mesoporous texture with slit-like spores. The pore volume of the prepared catalyst is 0.52 cm3/g. It is believed that larger pore volumes tend to help store more reactants, and interconnected porous networks facilitate the transportation of reactant molecules and products, resulting in higher reaction rates (Khan et al., 2020).
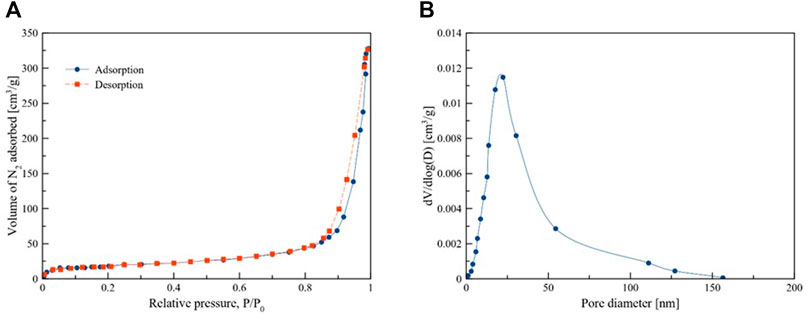
FIGURE 1. N2 adsorption-desorption (A) BJH desorption branch pore size distribution (B).

TABLE 2. Physical properties and surface chemical composition of Ni/θ -Al2O3 pristine catalyst.
Figure 2 shows the XRD patterns of θ-Al2O3 support and Ni/θ-Al2O3 supported catalysts. The peaks at theta values of 20.2, 32.8, 36.7 38.9, 46.2, 66.9 correspond to (201), (400), (202), (111), (311), (512) planes of pure θ-Al2O3 depending on the intensities of planes to corresponding 2θ values (JCPDS Card No. 35–0121). The peaks at 24.2, 33.8 37.7 45.0, and 59.6 assigned to the (005), (101), (015), (018), and (110) planes are in good agreement with the planes of α-nickel hydroxide (JCPDS 380715) (Sánchez-De la Torre et al., 2013). The 2θ values of 44.09°, 51.70°, and 76.09° are associated with the (111), (200), and (220) lattice planes of nickel (PCPDF-04–0850). Unidentified peaks could be due to the presence of nickel-aluminate (Jiménez-González et al., 2013).
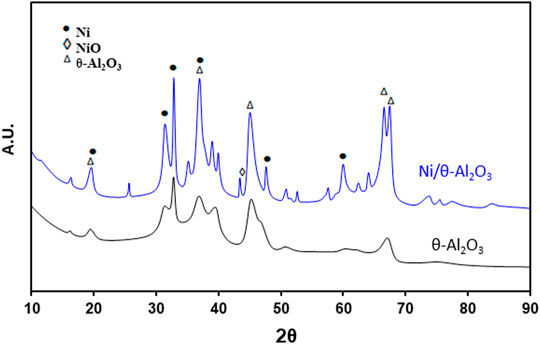
FIGURE 2. XRD of θ-Al2O3 and Ni/θ-Al2O3.
One the main challenges with the application of nickel-based catalyst in thermo-catalytic conversions of biomass is their fast deactivation due to sintering, coking and morphological changes especially during catalyst preparation or during reaction above 600°C (Adamu et al., 2018). Therefore we conducted SEM to ascertain the morphology of the of the nickel particles on the alumina support after preparation. Supplementary Figure S1 shows the SEM image of the catalysts, with highly dispersed nickel species on the surface of the catalyst. Since the catalyst was calcined at 750°C, it will be very stable against sintering during the biomass pyrolysis at the present reaction conditions. In particular, two types of nickel particles were observed on the theta-alumina surface. One type consist of approximately spherical particles with slight deformation and relaxed contours, connected by successive metal impregnation and annealing protocol (Adamu et al., 2019). These grains belong to NiO particles, while the much smaller sized particles represent the Ni nanoparticles (Sánchez-De la Torre et al., 2013). The observed stable (post-calcination) morphology suggest that sufficiently strong metal-support interaction was achieved due to the synthesis protocol adopted for the Ni/Al2O3 catalysts which was aimed to tackle sintering, as well as carbon deposition (Goula et al., 2015; Adamu et al., 2017).
Thermogravimetric Analysis
The pyrolytic conversion of Parachlorella kessleri HY-6 is described by three stages in Figure 3. Differential thermogravimetric (DTG) and conversion rate at three different heating rates (5,10,20 C/min) and three different catalyst loadings (10, 20, 30 wt%) are tested. The higher heating rate increased the conversion rate. However, due to heat and mass transfer hindrance, the peaks shifted to higher temperatures with increasing heating rates without affecting the shape or reaction mechanism.
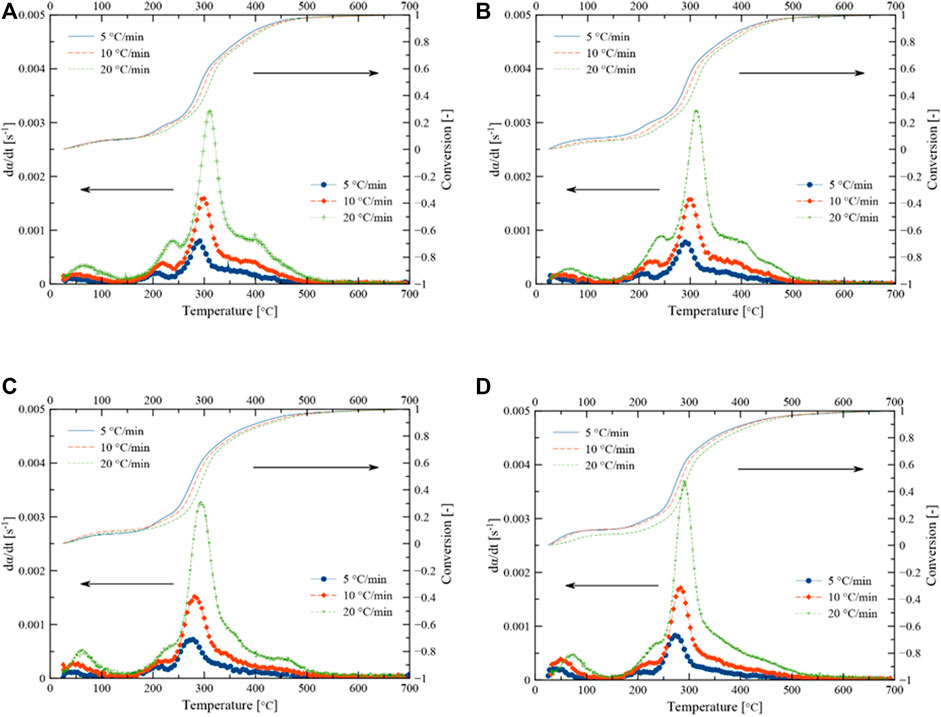
FIGURE 3. (D) TG curves of Parachlorella kessleri HY-6, (A) without catalyst, (B) with 10% catalyst, (C) with 20% catalyst, and (D) with 30% catalyst.
Most of the moisture was removed below 150°C during non-catalytic and catalytic pyrolysis. The primary degradation occurred in the temperature range of 150–500°C, resulting in a significant mass loss which is also shown by the high content of volatile matters. In this temperature range, at least three peaks are convoluted in the form of overlapping conversions, indicating complex interactions and degradations. Weight loss due to the decomposition of these structural microalgae components occurs between 200–500°C (Vuppaladadiyam et al., 2019). Carbohydrates and part of proteins, and lipids decomposed through devolatilization during the main pyrolysis step (Xu et al., 2020). Carbohydrates, proteins, lipids, and pigments undergo severe cracking in the active pyrolysis zone. As a result, various hydrocarbons, oxygen-rich, and nitrogen-containing organic compounds are formed alongside simpler non-condensable gases such as CH4, CO, CO2, H2, etc.
The last stage is at > 500°C where mineral matter and carbon material are decomposed further. The effect of catalytic activity is evident from an additional peak between 200–300°C. Weight loss was almost stable after 600°C during non-catalytic pyrolysis of biomass. However, weight loss around 800°C was observed during catalytic pyrolysis. The residual solid mass remained at 15.9 and 19.24% at the end of non-catalytic and catalytic pyrolysis, respectively. Different decomposition patterns during catalytic pyrolysis might be due to heat and mass transfer limitations in the presence of the catalyst and its catalytic activity. At a higher catalyst dose, the left and right shoulders around the main peak almost disappeared. The corresponding increased conversion rate can be seen at a catalyst dose of 30%, reaching a peak maximum conversion rate of 0.00369 s−1 at 20°C/min.
Pyrolysis of microalgae is a complex process due to various types of constituent lipids, proteins, and carbohydrates. Each constituent of microalgae has a different pyrolysis mechanism. The presence of all three in one system makes the process very complicated. Lipids are made of triglycerides (TAG), phosphor- and glycolipids (Farooq et al., 2013), and their relative amount depends on the growth conditions (Farooq, 2021). They decomposed through decarboxylation, decarbonylation, and fragmentation process. Lipids decomposed at 200–450°C. Proteins are made of amino acids and decomposed via dehydration, deamination, and decarboxylation reaction. Carbohydrates are decomposed by dehydration, glycosidic bond cleavage, and rearrangement (Wang et al., 2017). Generally, microalgae decomposed between the temperature range of 200–450°C. The temperature of the maximum mass loss peaks followed the order: lipid > protein > carbohydrate (Wang et al., 2017).
Isoconversional Kinetics for Activation Energy Measurement
Friedman and KAS methods were used to estimate the activation energy profiles of Parachlorella kessleri HY-6 during pyrolytic conversion. Average activation energy without catalyst was recorded at 253.54 (±58.81)kJ/mol from the Friedman method and 241.91 (±53.05) kJ/mol from the KAS method. Below 0.2 and above 0.8 are considered uncertain conversion ranges because of heterogeneity and therefore excluded from the kinetic analysis. Table 3 summarizes the activation energies of various microalgae during pyrolysis estimated from different isoconversional methods without any catalyst.
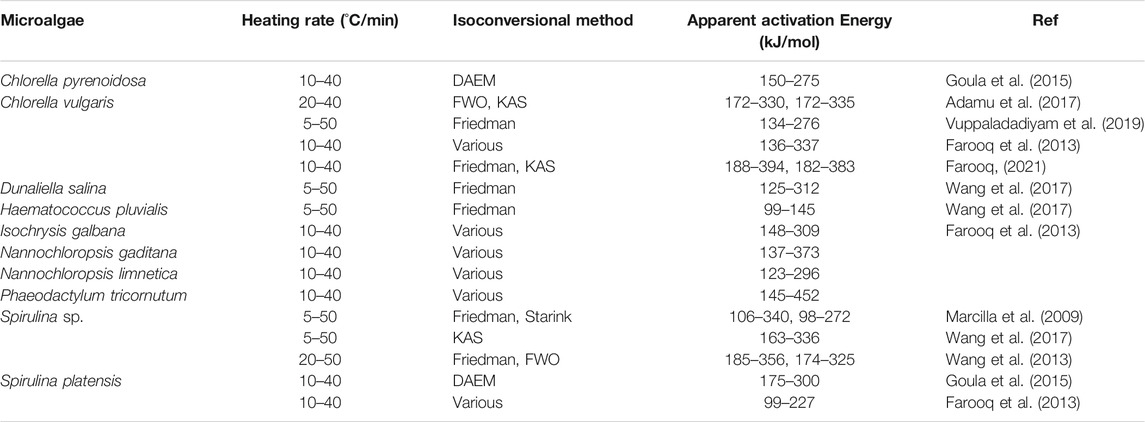
TABLE 3. Isoconversional activation energies of different microalgal species during pyrolysis without catalyst published during 2018–2020.
With the addition of 10% catalyst, the mean activation energy dropped to 202.88 (±30.95) kJ/mol as estimated from the Friedman method and 186.40 (±43.46) kJ/mol from the KAS method. At 20% of the catalyst dosage, the average activation energy remained at 214.75 (±30.95) kJ/mol as determined by the Friedman method and 190.81 (±49.75) kJ/mol from the KAS method. With 30% of catalyst dose, the activation energy decreased further to 186.29 (±16.42) kJ/mol for the Friedman method and 166.81 (±30.54) kJ/mol for the KAS method. The recorded average activation energy was least at 30% less with catalyst dosage.
Figure 4 indicates the evolution of activation energy along the conversion path of Parachlorella kessleri HY-6 pyrolysis. Significant changes can be observed at lower and higher conversions. They were showing that the catalyst is effective at the lower as well as at the elevated temperature. The middle section seemed barely affected by the catalyst.
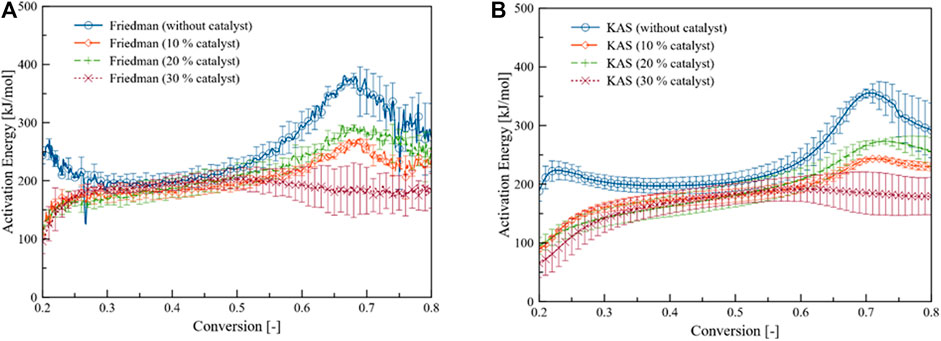
FIGURE 4. (A) Friedman, and (B) KAS activation energy profiles of Parachlorella kessleri HY-6 pyrolytic conversion with and without catalyst.
Combined Kinetics
Linearized rate law uses a generalized model function to retrieve the kinetic parameters through the maximization of R2 under the assumption of a single reaction. Figure 5 compares the kinetic parameters of the pyrolytic conversion of Parachlorella kessleri HY-6 with and without catalyst determined via combined kinetics. Kinetic parameters obtained from the combined kinetic analysis elaborated the thermodynamic characteristics of the conversion as given in Table 4.
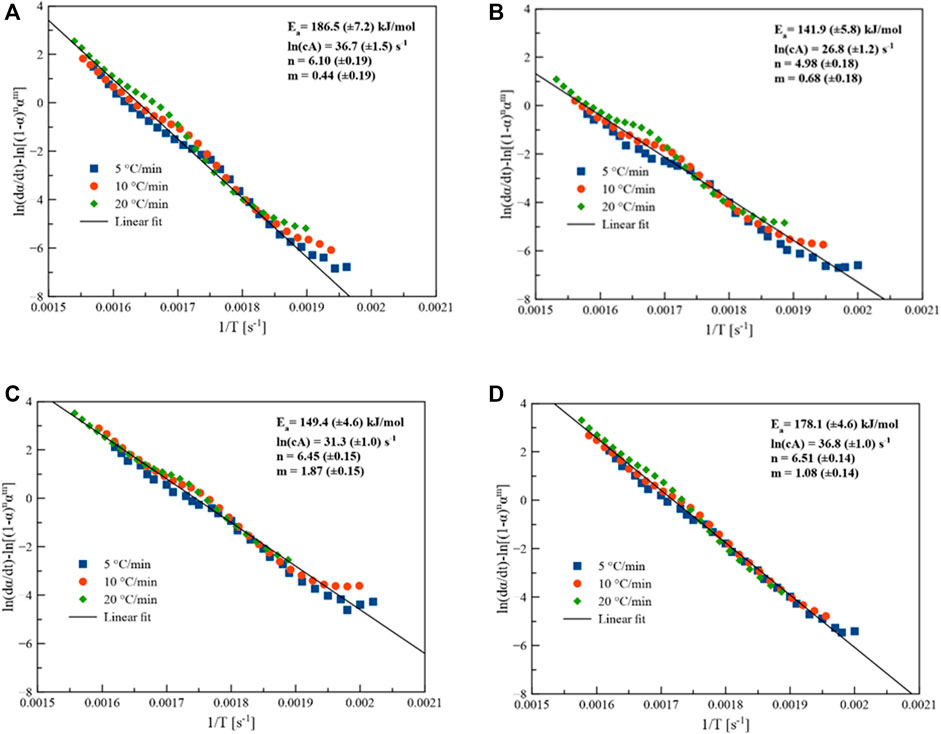
FIGURE 5. Combined kinetics of Parachlorella kessleri HY-6, (A) without catalyst, (B) with 10% catalyst, (C) with 20% catalyst, and (D) with 30% catalyst.
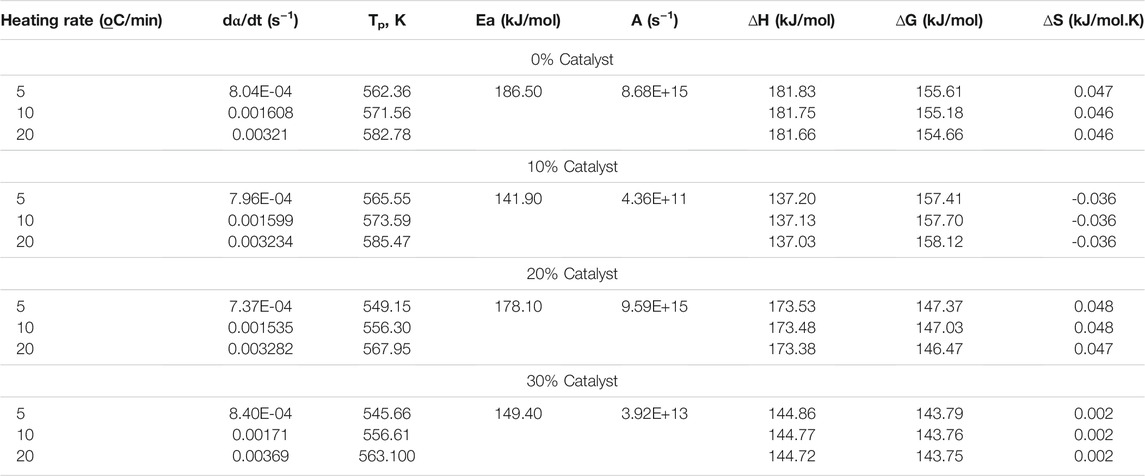
TABLE 4. Kinetic and thermodynamic parameters of pyrolytic conversion of Parachlorella kessleri HY-6.
Positive ∆H and ∆G values indicate that the conversion of Parachlorella kessleri HY-6 under pyrolytic conditions with or without a catalyst is endothermic and non-spontaneous. However, the difference in Ea and ∆H is below 5 kJ/mol, which shows that a small amount of energy in excess is needed to form an activated complex. Hence, the conversion can be considered favorable.
Evolved Gas Analysis by TGA-FTIR
The relative amount of pyrolysis products (solid, liquid and gas) is affected by the composition of raw material, pyrolysis process and its experimental conditions such as temperature, heating rate, catalyst, type of catalyst, and gas flow rate. TGA coupled with FTIR is a helpful technique for analyzing the composition of evolved gases. Microalgae biomass decomposed via dehydration and depolymerization of carbohydrate fraction and produced various low molecular weight products such as CO, CO2, aldehyde, ketones, and alcohols at the temperature range of 150–300°C (López-González et al., 2014). Their characteristic bands from FTIR help to identify the primary compounds. The maximum concentration of evolved gases given by the normalized Gram-Schmidt (GS) curve coincides with the DTG curve. Normalization was carried out by dividing the Gram-Schmidt intensity with the mass of the sample without catalyst. The delay in the peak of the GS curve compared to the DTG is due to the travel time of gases from the pyrolysis reactor to the analyzer (Abdul Jameel et al., 2017). The GS shows the different decomposition mechanisms during catalytic pyrolysis compared to non-catalytic. However, a detailed investigation of liquid and solid fractions is required to elucidate the pyrolysis mechanism, especially for catalytic pyrolysis.
The decomposition of microalgae biomass (MB) without a catalyst is shown in Figure 7 for three different decomposition steps during pyrolysis.
Figure 7A shows the IR spectra for the dehydration step, which is dominant at a temperature <200°C. The bands around 1,500 cm−1 and 3,500–4,000 cm−1 showed bending and plane stretching of -OH groups. The results are consistent with reported results for non-catalytic pyrolysis of microalgae (Marcilla et al., 2009). The IR spectra of the evolved gases during the second and most important decomposition step are given as three overlapping peaks at 291, 326, and 461°C in Figure 6B. It showed a complex degradation process. This figure showed different chemical bonds or functional groups via absorbance of vibrational modes of each functional group at the corresponding temperature vs wavelength (Marcilla et al., 2009). The majority of vibrational modes contributed to the bands at 1800–1,200 cm−1. Water is still being produced at 3,500–4,000 cm−1. Strong stretching on the C=O band appeared at 1870–1,540 cm−1 could be the carbonylic compounds like aldehyde etc. The band at 1,700–1,800 cm−1 represents the esters. Bands at 2,900–2,800 cm−1 described vibration of C-H bands as methyl group and methylene groups.
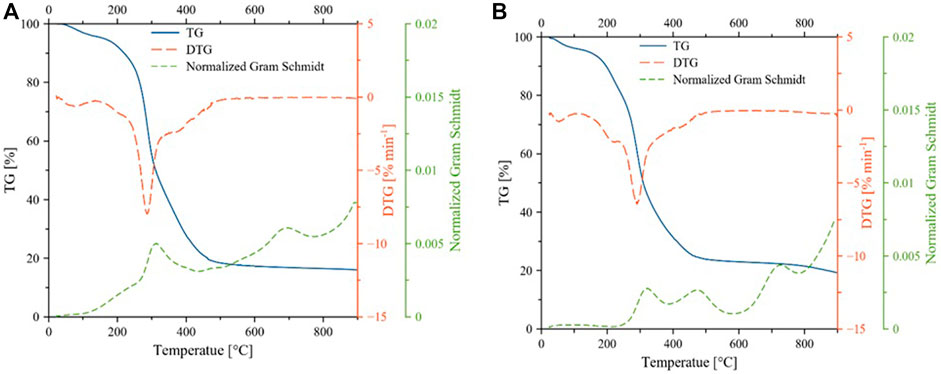
FIGURE 6. Thermogravimetric curves for decomposition of microalgae during non-catalytic (A) and catalytic (B) pyrolysis.
Higher CO2 and water formed during the last stage of pyrolysis of microalgae. Microalgae decomposition in the presence of Ni/θ-Al2O3 catalyst is given in Figure 7 (a',b' and c'). The IR scan of evolved gases during catalytic pyrolysis significantly changed during the second and main decomposition stage. The evolution of water is minor during the first and second stages compared to the non-catalytic process. The intensity of all gases during the last and second stages is also reduced during the catalytic process. These patterns showed a different reaction mechanism than non-catalytic pyrolysis. It can be seen from the spectra that the release of the gases takes place at all temperatures. Release rate of CO2 was intermittently in the temperature ranges of 300–450°C and 650–950°C. Absorption peaks in the range of 4,000–3,500 cm−1 and 1,600–1,300 cm−1 were due to the release of H2O from the decomposition of oxygen-containing compounds (Liu et al., 2008; Wang et al., 2013). The absorption peak between 3,100 and 2,675 cm−1 indicated the emission of CH4.
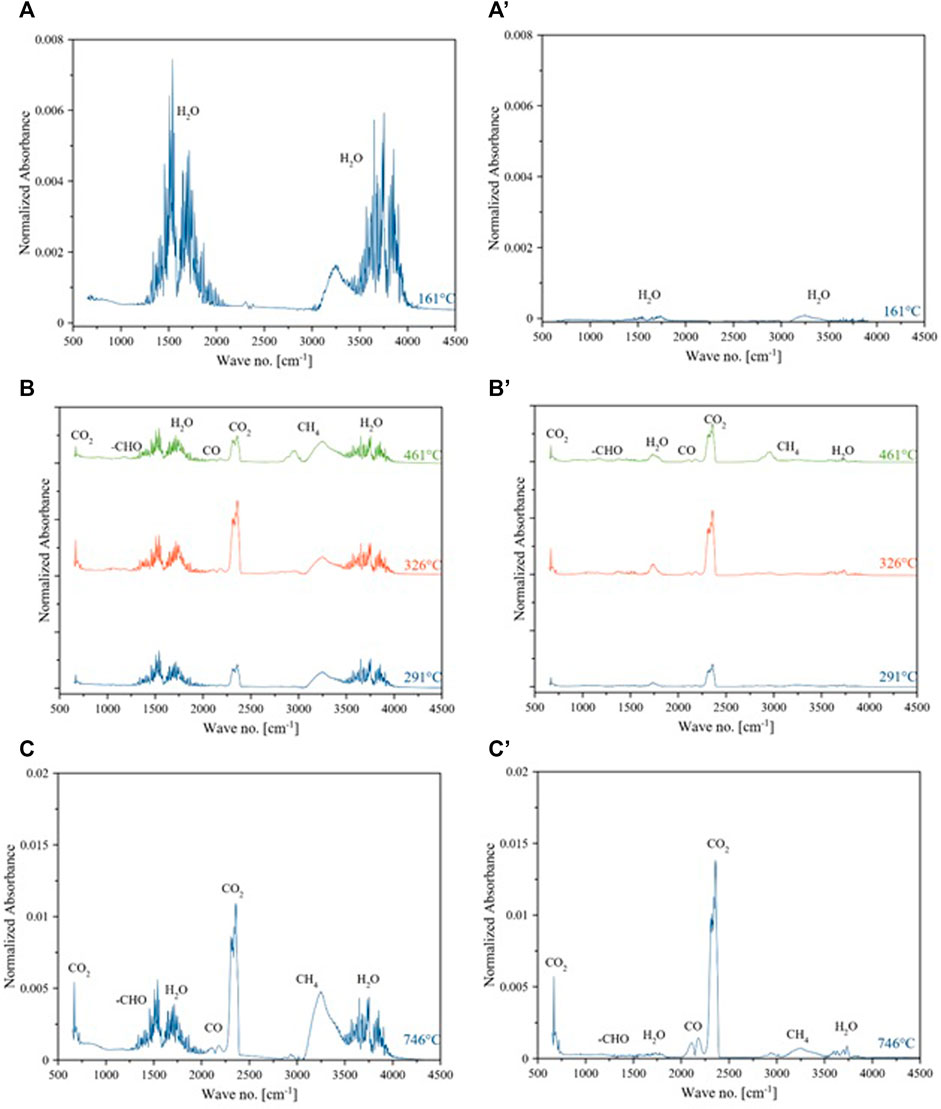
FIGURE 7. IR spectra of evolved gases from catalytic and non-catalytic pyrolysis of microalgae. Dehydration step (A) (a and a’), main decomposition (B) (b and b’), solid residue decomposition (C) (c and c’).
The release of methane was mainly from the cracking of the methoxy (–O–CH3) group-containing compounds (Yang et al., 2007). The peaks around 2,400–2,240 cm−1 and 680–660 cm−1 are the characteristic peaks of CO2, which are mainly produced from the degradation of carbonyl (C=O) and carboxyl (COOH) containing compounds. The peaks between 2,240 and 2060 cm−1 were because of the CO emission, resulting from the cracking of organic compounds containing ether (C–O–C) and carbonyl (C=O) functional groups (Yang et al., 2007). The absorption band in the wavenumber range of 1,900–1,600 cm−1 can be associated with the release of aldehydes (Gong et al., 2020). The evolved gases from the pyrolysis of MB were water, CH4, CO2, CO, and -HCO. According to the peak intensity, since the intensity of the peaks corresponds to the concentration of the gases (Fan et al., 2020), the concentration of evolved gases is in the descending order as H2O > CH4 > CO2>-CHO > CO. Gas yield increased with temperature due to secondary cracking of char and pyrolysis vapors (Hu et al., 2013). The presence of Ni in the catalyst was reported to decrease the yield of water and tar (Lu et al., 2020). Gas yield during the pyrolysis of biomass depends on temperature and nature of catalyst as well (Durak, 2016).
Figure 8 shows the intensity of evolved gases during the pyrolysis of microalgae biomass at 10 wt% Ni/θ-Al2O3 catalyst. The intensity of peaks in Figure 8B at wave no. 1,000–1,500 and 3,000–3,600 cm−1 are reduced compared to non-catalytic pyrolysis, as shown in Figure 8A. Relative contents of evolved gases are different for both non-catalytic and catalytic pyrolysis, as shown in Figures 8C,D, and the significant portion of evolved gas composed of CO2. The increase in CO2 content could be primarily from the cracking of oxygenated organic compounds at higher temperatures (Abhijeet et al., 2020). The comparison of Figure 8D with Figure 8C clearly showed the variation in the composition of evolved gases as evidence of the catalytic activity of the catalyst. The intensity of all gases was lower during catalytic pyrolysis at all temperatures. CO2 yield decreased during catalytic pyrolysis along with the composition of all the other gases. The increase in CO2 content at higher temperatures could be primarily from the cracking of oxygenated organic compounds. Gas formation increased in the presence of a catalyst at a higher temperature, as reported earlier (Aysu et al., 2016). The likely reason for increase in CO2 and CH4 might be char gasification and reforming reactions (Vuppaladadiyam et al., 2019).
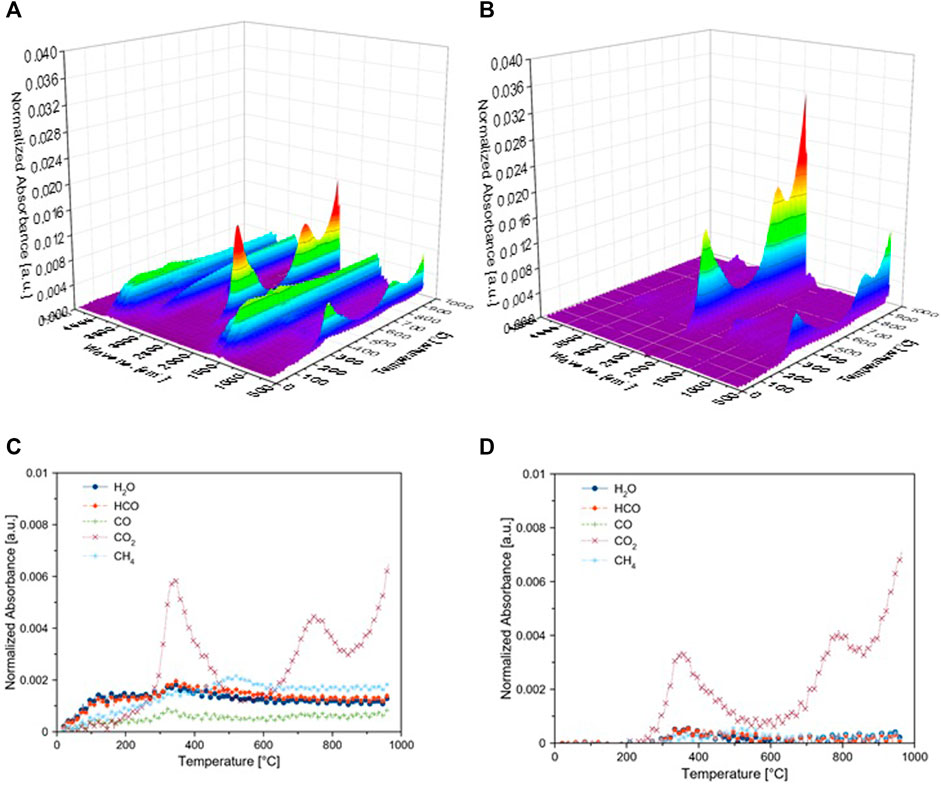
FIGURE 8. Evolved gases intensity during pyrolysis of microalgae biomass (MB) during non-catalytic (A–C) and catalytic pyrolysis (B, D) using TGA-FTIR (A, B) 3D FTIR spectra, (C, D) Gases evolved at different temperatures.
CO2 decreased first and then increased at a temperature higher than 750°C compared to the non-catalytic process (Chattopadhyay et al., 2011). Secondary decomposition reactions become dominant at temperature >600°C leading to higher gas yield. Moreover, the presence of inorganic (K, Na, Mg and Ca, etc.) facilitated the carboxylation reaction and enhanced the CO2 production during the decomposition of carbohydrate (Aysu and Sanna, 2015). Figure 8 shows a clear difference between catalytic and non-catalytic pyrolysis. However, the mechanism of pyrolysis cannot be described by variation in evolved gas analysis. Variation in solid residue and the liquid fraction must also be monitored along with gases. During pyrolysis, solid, liquid, and gas yield depends on temperature, heating rate, active metal, and nature of catalytic support (Kar et al., 2019). Alumina tends to form more char due to its acidity. At higher temperature, the bio-oil and char products are converted to gas product because of secondary cracking reactions (Durak et al., 2019). However, at this point, the unavailability of data on solid and, mainly, liquid fraction is the limitation of this work that will be addressed in future studies.
Conclusion
This study reports the application of Ni/θ-Al2O3 catalyst during the pyrolysis of Parachlorella kessleri HY-6. Kinetic analysis shows the efficacy of Ni/θ-Al2O3 in lowering the mean activation energy of Parachlorella kessleri HY-6 during pyrolysis. The influence of the catalyst at lower and higher conversion was significant. Thermodynamic analysis indicates the process’s non-spontaneity and endothermicity; the conversion was still favorable with less than 5 kJ/mol of energy required to form activated complexes. FTIR analysis of evolved gases along with TGA profile showed that microalgae degrade in three important steps. The catalyst was active in accelerating the decomposition process by lowering the activation energy. The composition of the evolved gases differed with temperature and the presence of a catalyst during the pyrolysis process.
Data Availability Statement
The raw data supporting the conclusions of this article will be made available by the authors, without undue reservation.
Author Contributions
WF and SR write and conceptualize the work. IA obtained the funding and did kinetics analysis. MS and HA did TGA and gas analysis. SA synthesizes the catalyst. All authors reviewed the manuscript.
Funding
The authors extend their appreciation to the Deputyship for Research and Innovation, Ministry of Education, Saudi Arabia for funding this research work through the project number (IFPIP:778-829-1442) and King Abdul Aziz University, DSR, Jeddah, Saudi Arabia.
Conflict of Interest
The authors declare that the research was conducted in the absence of any commercial or financial relationships that could be construed as a potential conflict of interest.
Publisher’s Note
All claims expressed in this article are solely those of the authors and do not necessarily represent those of their affiliated organizations, or those of the publisher, the editors and the reviewers. Any product that may be evaluated in this article, or claim that may be made by its manufacturer, is not guaranteed or endorsed by the publisher.
Supplementary Material
The Supplementary Material for this article can be found online at: https://www.frontiersin.org/articles/10.3389/fenrg.2021.775037/full#supplementary-material
References
Abdul Jameel, A. G., Han, Y., Brignoli, O., Telalović, S., Elbaz, A. M., Im, H. G., et al. (2017). Heavy Fuel Oil Pyrolysis and Combustion: Kinetics and Evolved Gases Investigated by TGA-FTIR. J. Anal. Appl. Pyrolysis 127, 183–195. doi:10.1016/j.jaap.2017.08.008
Abhijeet, P., Swagathnath, G., Rangabhashiyam, S., Asok Rajkumar, M., and Balasubramanian, P. (2020). Prediction of Pyrolytic Product Composition and Yield for Various Grass Biomass Feedstocks. Biomass Conv. Bioref. 10, 663–674. doi:10.1007/s13399-019-00475-5
Adamu, S., Binous, H., Razzak, S. A., and Hossain, M. M. (2017). Enhancement of Glucose Gasification by Ni/La 2 O 3 -Al 2 O 3 Towards the Thermodynamic Extremum at Supercritical Water Conditions. Renew. Energ. 111, 399–409. doi:10.1016/j.renene.2017.04.020
Adamu, S., Razzak, S. A., and Hossain, M. M. (2018). Fluidizable Ni/Ce-Meso-Al2O3 for Gasification of Glucose: Effect of Catalyst Reduction on Hydrogen Selectivity. J. Ind. Eng. Chem. 64, 467–477. doi:10.1016/j.jiec.2018.04.008
Adamu, S., Xiong, Q., Bakare, I. A., and Hossain, M. M. (2019). Ni/Ce Al2O3 for Optimum Hydrogen Production from Biomass/tar Model Compounds: Role of Support Type and Ceria Modification on Desorption Kinetics. Int. J. Hydrogen Energ. 44, 15811–15822. doi:10.1016/j.ijhydene.2018.12.136
Ali, I., Tariq, R., Naqvi, S. R., Khoja, A. H., Mehran, M. T., Naqvi, M., et al. (2021). Kinetic and Thermodynamic Analyses of Dried Oily Sludge Pyrolysis. J. Energ. Inst. 95, 30–40. doi:10.1016/j.joei.2020.12.002
Aysu, T., Abd Rahman, N. A., and Sanna, A. (2016). Catalytic Pyrolysis of Tetraselmis and Isochrysis Microalgae by Nickel Ceria Based Catalysts for Hydrocarbon Production. Energy 103, 205–214. doi:10.1016/j.energy.2016.02.055
Aysu, T., and Sanna, A. (2015). Nannochloropsis Algae Pyrolysis with Ceria-Based Catalysts for Production of High-Quality Bio-Oils. Bioresour. Technol. 194, 108–116. doi:10.1016/j.biortech.2015.07.027
Azizi, K., Keshavarz Moraveji, M., and Abedini Najafabadi, H. (2018). A Review on Bio-Fuel Production from Microalgal Biomass by Using Pyrolysis Method. Renew. Sustain. Energ. Rev. 82, 3046–3059. doi:10.1016/j.rser.2017.10.033
Babich, I. V., van der Hulst, M., Lefferts, L., Moulijn, J. A., O’Connor, P., and Seshan, K. (2011). Catalytic Pyrolysis of Microalgae to High-Quality Liquid Bio-Fuels. Biomass and Bioenergy 35, 3199–3207. doi:10.1016/j.biombioe.2011.04.043
Chattopadhyay, J., Son, J. E., and Pak, D. (2011). Preparation and Characterizations of Ni-Alumina, Ni-Ceria and Ni-Alumina/Ceria Catalysts and Their Performance in Biomass Pyrolysis. Korean J. Chem. Eng. 28, 1677–1683. doi:10.1007/s11814-011-0027-3
Chen, W.-H., Farooq, W., Shahbaz, M., Naqvi, S. R., Ali, I., Al-Ansari, T., et al. (2021). Current Status of Biohydrogen Production from Lignocellulosic Biomass, Technical Challenges and Commercial Potential through Pyrolysis Process. Energy 226, 120433. doi:10.1016/j.energy.2021.120433
Díaz-Rey, M. R., Cortés-Reyes, M., Herrera, C., Larrubia, M. A., Amadeo, N., Laborde, M., et al. (2015). Hydrogen-Rich Gas Production from Algae-Biomass by Low Temperature Catalytic Gasification. Catal. Today 257, 177–184. doi:10.1016/j.cattod.2014.04.035
Durak, H., Genel, S., and Tunç, M. (2019). Pyrolysis of Black Cumin Seed: Significance of Catalyst and Temperature Product Yields and Chromatographic Characterization. J. Liquid Chromatogr. Relat. Tech. 42, 331–350. doi:10.1080/10826076.2019.1593194
Durak, H. (2016). Pyrolysis ofXanthium Strumariumin a Fixed Bed Reactor: Effects of boron Catalysts and Pyrolysis Parameters on Product Yields and Character. Energy Sourc. A: Recovery, Utilization, Environ. Effects 38, 1400–1409. doi:10.1080/15567036.2014.947446
Fan, L., Zhang, H., Li, J., Wang, Y., Leng, L., Li, J., et al. (2020). Algal Biorefinery to Value-Added Products by Using Combined Processes Based on Thermochemical Conversion: A Review. Algal Res. 47, 101819. doi:10.1016/j.algal.2020.101819
Farooq, W., Lee, Y.-C., Ryu, B.-G., Kim, B.-H., Kim, H.-S., Choi, Y.-E., et al. (2013). Two-Stage Cultivation of Two Chlorella Sp. Strains by Simultaneous Treatment of Brewery Wastewater and Maximizing Lipid Productivity. Bioresour. Technol. 132, 230–238. doi:10.1016/j.biortech.2013.01.034
Farooq, W. (2021). Sustainable Production of Microalgae Biomass for Biofuel and Chemicals through Recycling of Water and Nutrient within the Biorefinery Context: A Review. GCB Bioenergy 13, 914–940. doi:10.1111/gcbb.12822
Gong, Z., Fang, P., Wang, Z., Li, Q., Li, X., Meng, F., et al. (2020). Catalytic Pyrolysis of Chemical Extraction Residue from Microalgae Biomass. Renew. Energ. 148, 712–719. doi:10.1016/j.renene.2019.10.158
Goula, M. A., Charisiou, N. D., Papageridis, K. N., Delimitis, A., Pachatouridou, E., and Iliopoulou, E. F. (2015). Nickel on Alumina Catalysts for the Production of Hydrogen Rich Mixtures via the Biogas Dry Reforming Reaction: Influence of the Synthesis Method. Int. J. Hydrogen Energ. 40, 9183–9200. doi:10.1016/j.ijhydene.2015.05.129
Guo, D.-L., Wu, S.-B., Liu, B., Yin, X.-L., and Yang, Q. (2012). Catalytic Effects of NaOH and Na2CO3 Additives on Alkali Lignin Pyrolysis and Gasification. Appl. Energ. 95, 22–30. doi:10.1016/j.apenergy.2012.01.042
Hu, Z., Zheng, Y., Yan, F., Xiao, B., and Liu, S. (2013). Bio-Oil Production through Pyrolysis of Blue-green Algae Blooms (BGAB): Product Distribution and Bio-Oil Characterization. Energy 52, 119–125. doi:10.1016/j.energy.2013.01.059
Jiménez-González, C., Boukha, Z., de Rivas, B., Delgado, J. J., Cauqui, M. Á., González-Velasco, J. R., et al. (2013). Structural Characterisation of Ni/alumina Reforming Catalysts Activated at High Temperatures. Appl. Catal. A: Gen. 466, 9–20. doi:10.1016/j.apcata.2013.06.017
Kar, T., Keleş, S., and Kaygusuz, K. (2019). Comparison of Catalytic and Noncatalytic Pyrolysis and Product Yields of Some Waste Biomass Species. Int. J. Energ. Res. 43, 2032–2043. doi:10.1002/er.4383
Khan, H. A., Hao, J., and Farooq, A. (2020). Catalytic Performance of Pd Catalyst Supported on Zr:Ce Modified Mesoporous Silica for Methane Oxidation. Chem. Eng. J. 397, 125489. doi:10.1016/j.cej.2020.125489
Lee, X. J., Ong, H. C., Gan, Y. Y., Chen, W.-H., and Mahlia, T. M. I. (2020). State of Art Review on Conventional and Advanced Pyrolysis of Macroalgae and Microalgae for Biochar, Bio-Oil and Bio-Syngas Production. Energ. Convers. Manage. 210, 112707. doi:10.1016/j.enconman.2020.112707
Liu, Q., Wang, S., Zheng, Y., Luo, Z., and Cen, K. (2008). Mechanism Study of wood Lignin Pyrolysis by Using TG-FTIR Analysis. J. Anal. Appl. Pyrolysis 82, 170–177. doi:10.1016/j.jaap.2008.03.007
López-González, D., Fernandez-Lopez, M., Valverde, J. L., and Sanchez-Silva, L. (2014). Pyrolysis of Three Different Types of Microalgae: Kinetic and Evolved Gas Analysis. Energy 73, 33–43. doi:10.1016/j.energy.2014.05.008
Lu, Q., Li, W., Zhang, X., Liu, Z., Cao, Q., Xie, X., et al. (2020). Experimental Study on Catalytic Pyrolysis of Biomass over a Ni/Ca-Promoted Fe Catalyst. Fuel 263, 116690. doi:10.1016/j.fuel.2019.116690
Marcilla, A., Gómez-Siurana, A., Gomis, C., Chápuli, E., Catalá, M. C., and Valdés, F. J. (2009). Characterization of Microalgal Species through TGA/FTIR Analysis: Application to Nannochloropsis Sp. Thermochim. Acta 484, 41–47. doi:10.1016/j.tca.2008.12.005
Mustapha, S. I., Rawat, I., Bux, F., and Isa, Y. M. (2021). Catalytic Pyrolysis of Nutrient-Stressed Scenedesmus Obliquus Microalgae for High-Quality Bio-Oil Production. Renew. Energ. 179, 2036–2047. doi:10.1016/j.renene.2021.08.043
Naqvi, S. R., Tariq, R., Hameed, Z., Ali, I., Taqvi, S. A., Naqvi, M., et al. (2018). Pyrolysis of High-Ash Sewage Sludge: Thermo-Kinetic Study Using TGA and Artificial Neural Networks. Fuel 233, 529–538. doi:10.1016/j.fuel.2018.06.089
Rahemi, N., Haghighi, M., Babaluo, A. A., Jafari, M. F., and Estifaee, P. (2013). Synthesis and Physicochemical Characterizations of Ni/Al2O3-ZrO2 Nanocatalyst Prepared via Impregnation Method and Treated with Non-thermal Plasma for CO2 Reforming of CH4. J. Ind. Eng. Chem. 19, 1566–1576. doi:10.1016/j.jiec.2013.01.024
Sánchez-De la Torre, F., De la Rosa, J., Kharisov, B., and Lucio-Ortiz, C. (2013). Preparation and Characterization of Cu and Ni on Alumina Supports and Their Use in the Synthesis of Low-Temperature Metal-Phthalocyanine Using a Parallel-Plate Reactor. Materials 6, 4324–4344. doi:10.3390/ma6104324
Sekar, M., Mathimani, T., Alagumalai, A., Chi, N. T. L., Duc, P. A., Bhatia, S. K., et al. (2021). A Review on the Pyrolysis of Algal Biomass for Biochar and Bio-Oil - Bottlenecks and Scope. Fuel 283, 119190. doi:10.1016/j.fuel.2020.119190
Vuppaladadiyam, A. K., Liu, H., Zhao, M., Soomro, A. F., Memon, M. Z., and Dupont, V. (2019). Thermogravimetric and Kinetic Analysis to Discern Synergy during the Co-Pyrolysis of Microalgae and Swine Manure Digestate. Biotechnol. Biofuels. 12, 170. doi:10.1186/s13068-019-1488-6
Wadood, A., Rana, A., Basheer, C., Razzaq, S. A., and Farooq, W. (2020). In Situ Transesterification of Microalgae Parachlorella Kessleri Biomass Using Sulfonated Rice Husk Solid Catalyst at Room Temperature. Bioenerg. Res. 13, 530–541. doi:10.1007/s12155-019-10060-3
Wang, S., Tang, Y., Schobert, H. H., Guo, Y. n., Gao, W., and Lu, X. (2013). FTIR and Simultaneous TG/MS/FTIR Study of Late Permian Coals from Southern China. J. Anal. Appl. Pyrolysis 100, 75–80. doi:10.1016/j.jaap.2012.11.021
Wang, X., Sheng, L., and Yang, X. (2017). Pyrolysis Characteristics and Pathways of Protein, Lipid and Carbohydrate Isolated from Microalgae Nannochloropsis Sp. Bioresour. Technol. 229, 119–125. doi:10.1016/j.biortech.2017.01.018
Xu, Y., Hu, Y., Peng, Y., Yao, L., Dong, Y., Yang, B., et al. (2020). Catalytic Pyrolysis and Liquefaction Behavior of Microalgae for Bio-Oil Production. Bioresour. Technol. 300, 122665. doi:10.1016/j.biortech.2019.122665
Yang, H., Yan, R., Chen, H., Lee, D. H., and Zheng, C. (2007). Characteristics of Hemicellulose, Cellulose and Lignin Pyrolysis. Fuel 86, 1781–1788. doi:10.1016/j.fuel.2006.12.013
Zeng, Y., Zhao, B., Zhu, L., Tong, D., and Hu, C. (2013). Catalytic Pyrolysis of Natural Algae from Water Blooms Over Nickel Phosphide for High Quality Bio-Oil Production. RSC Adv. 3, 10806–10816. doi:10.1039/C3RA23453C
Zhao, C., Brück, T., and Lercher, J. A. (2013). Catalytic Deoxygenation of Microalgae Oil to Green Hydrocarbons. Green. Chem. 15, 1720–1739. doi:10.1039/C3GC40558C
Keywords: catalytic pyrolysis, pyrolysis kinetics, thermogravimetric analysis (TGA), microalgae, evolved gases analysis
Citation: Farooq W, Ali I, Raza Naqvi S, Sajid M, Abbas Khan H and Adamu S (2021) Evolved Gas Analysis and Kinetics of Catalytic and Non-Catalytic Pyrolysis of Microalgae Chlorella sp. Biomass With Ni/θ-Al2O3 Catalyst via Thermogravimetric Analysis. Front. Energy Res. 9:775037. doi: 10.3389/fenrg.2021.775037
Received: 13 September 2021; Accepted: 02 November 2021;
Published: 25 November 2021.
Edited by:
Abdul-Sattar Nizami, Government College University, PakistanReviewed by:
Ibukun Oluwoye, Murdoch University, AustraliaHalil Durak, Yüzüncü Yıl University, Turkey
Copyright © 2021 Farooq, Ali, Raza Naqvi, Sajid, Abbas Khan and Adamu. This is an open-access article distributed under the terms of the Creative Commons Attribution License (CC BY). The use, distribution or reproduction in other forums is permitted, provided the original author(s) and the copyright owner(s) are credited and that the original publication in this journal is cited, in accordance with accepted academic practice. No use, distribution or reproduction is permitted which does not comply with these terms.
*Correspondence: Wasif Farooq, d2FzaWZAa2Z1cG0uZWR1LnNh