 Ahmed Riyaz
 Pradip Kumar Sadhu1
 Mohd Tariq
 Shabana Urooj
94% of researchers rate our articles as excellent or good
Learn more about the work of our research integrity team to safeguard the quality of each article we publish.
Find out more
ORIGINAL RESEARCH article
Front. Energy Res. , 11 November 2021
Sec. Smart Grids
Volume 9 - 2021 | https://doi.org/10.3389/fenrg.2021.774408
This article is part of the Research Topic The Role of Solar Energy and Smart Grids in Achieving Carbon Neutrality View all 5 articles
Continuous power supply in an integrated electric system supplied by solar energy and battery storage can be optimally maintained with the use of diesel generators. This article discusses the optimum setting-point for isolated wind, photo-voltaic, diesel, and battery storage electric grid systems. Optimal energy supply for hybrid grid systems means that the load is sufficient for 24 h. This study aims to integrate the battery deprivation costs and the fuel price feature in the optimization model for the hybrid grid. In order to count charge–discharge cycles and measure battery deprivation, the genetic algorithm concept is utilized. To solve the target function, an ANN-based algorithm with genetic coefficients can also be used to optimize the power management system. In the objective function, a weight factor is proposed. Specific weight factor values are considered for simulation studies. On the algorithm actions, charging status, and its implications for the optimized expense of the hybrid grid, the weight factor effect is measured.
A hybrid grid (HG) is an electrical distribution network that allows the penetration of various locally produced sources with or without storage equipment (Navigant Research, 2016). Reliability and cost savings can be achieved by the use of renewable energy sources (RESs), traditional turbines, storage plants, and electricity charges, as well as the use of an HG. A hybrid grid can work in both connected and isolated modes. The HG can be linked to the main grid in the grid-connected mode via a common interconnector point and participate in energy trading as either a customer or a provider via grid receipt or power transmission.
A power management system (PMS) is also used for the most efficient use of hybrid grid units. The PMS techniques can maximize the transmission of power generation outputs from HG units and ensure economic load demand (LD), as well as monitor the frequency and voltage of HG systems. Rauf et al. (2016) outlined the latest HG-PMS architecture and the different power and heat generation systems and electric cars, as well as the core functionality and limitations of HG-PMS and the use of optimization technology. Photovoltaic (PV) and wind power are the most commonly used sources of renewable energy in HGs. However, because of the intermittent nature of renewable energy sources, it is recommended that it be assisted by appropriate storage units and optimally integrated into the HG scheme. In terms of the maximum use of the battery storage (BS) in the HG, several studies were carried out for optimal delivery of HG generation and storage devices. For this reason, many advanced methods of optimization were published. A combined hybrid supply of energy and a battery source multimedia problem is solved with multi-target integral linear programming (Mathieu et al., 2013). Fuzzy logic control (FLC) determines the charging and discharge of the battery. Capital and maintenance expenditures, fuel prices, electricity costs, and carbon sanctions are the target functions to be minimized. The PMS solution for GC-HG is combined with the energy storage system (ESS) and local generation (PS) in a genetic algorithm (Rauf et al., 2016). The proposed PMS would determine how much HG electricity will be added to the ESS and how much will be replaced on the main grid. The primary aim is to maximize profits from power grid trade. Kasis et al. (2017a) investigated the planning of battery and HG generation plants. The system is modeled on a stochastic framework, and the PMS is solved using a deep Q-learning algorithm. In the study by Kasis et al. (2017b), we examined a dynamic dispatch in the HG of BS. The objective function of the problem is designed to maximize the battery operational benefit. To solve the battery management issue, a reinforcement study is proposed in combination with a search of Monte-Carlo trees. In the study by Schuitema et al. (2017), FLC was proposed to control the BS level of the state of charge (SOC) limited to the minimum and maximum limits. Moreover, a backtracking search algorithm is introduced to determine an optimum battery SOC control to allow for smooth BS operation throughout the time and to minimize the overloading and unchanging capacity. In the study by Books and Barooah (2019), an optimum power send for the GCHG was introduced with PV units and battery deactivators in the programming algorithm. The proposed goal is to maximize the amount of PV, minimize operating costs, and trade electricity costs with the grid. In the study by Kim et al. (2016), for a day-long plan, an optimal PMS solution was tested. The problem of optimization is modeling so that the operating costs for HG generation units are minimized and the consumption of renewable sources maximized. The optimization problem is fixed by convection programming, and a rolling horizon-predictive controller in combination with a predictive model determines the best environment for a BS. In the study by Aduda et al. (2018), the PMS of an isolated HG was targeted using a cuckoo-search algorithm with RES, DG, and BS. The target problem feature is to decrease overall costs and reduce gas emissions. Applying a GA achieves an economic advantage by using RES (Lin et al., 2015). The device studied is an isolated HG, BS, and DG with renewable sources. The goal feature proposed is to minimize capital and to maintain HG units, fuel costs, and pollution costs. In the GC-HG floral pollination algorithm (Chen et al., 2017), integrated RES, micro turbines, fuel cells, and BS are examined for the solution of PMS. The aim is to minimize BS operating costs, energy produced costs, the energy expenses of the grid exchanged, and costs for the demand response. In the study by Vrettos et al. (2016), an amended algorithm to check the ideal operating condition of BS in a population HG was proposed in a particle swarm optimization (PSO). An effective battery charging and discharge feature is added. Most of these research works do not take into account the objective purpose of reducing battery life. As shown, the loading and unloading processes have a major influence on BS lifetime. This article includes one of the objective functions that should be reduced, which is lifecycle deprivation costs. The genetic algorithm is used for charging and discharging cycles and quantifying the cost of battery deprivation (BDC). In order to resolve the unit engagement of a grid-connected HG, the effectiveness of the artificial neural network with genetic algorithms has been demonstrated. This study uses the ANN-GA algorithm for solving a problem of 48-h programming for isolated rural HG units. The following is an overview of the article. HG Modeling discusses modeling of HG devices; PMS Problem Formulation deals with proposed PMS, including potential objective functions and devices; ANN With Genetic Application deals with application of the ANN and genetic algorithms in the PMS; Discussion on Simulation Outcomes deals with the simulation and discussion; and Conclusion ends the article.
The hybrid grid (HG) includes RES, wind turbine (WT), BS, and DGs with PV panels.
In a simplified model, the solar irradiation is proportional to the photovoltaic module’s performance, which can be calculated as follows (Chen et al., 2017):
where
The total energy output can be defined as given for a number of PV modules:
where
Wind speed (WS) at the hub height is proportional to the WG’s energy output, which can be expressed mathematically as follows (Chen et al., 2017):
where
The per hour wind speed can be expressed mathematically as follows (Silva and Santiago, 2018):
where
For a certain number of WGs, the total energy output can be expressed below:
where
A diagram of the BS is shown in Figure 1. The power of the battery can be described as follows in the battery mode:
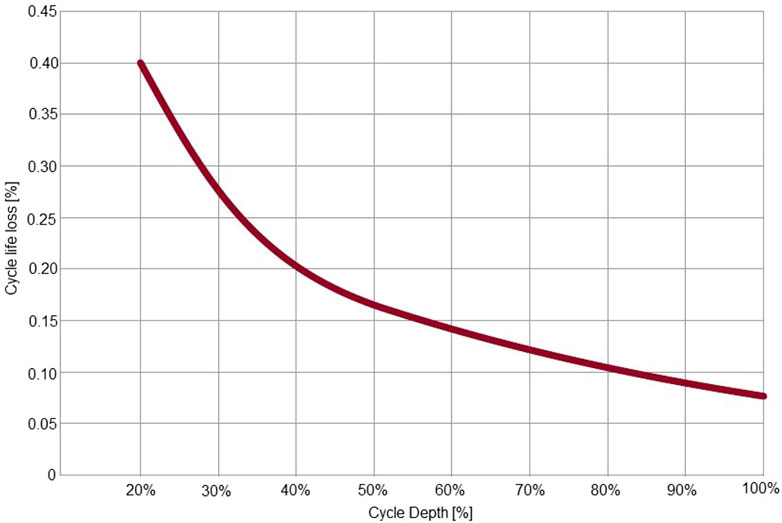
FIGURE 1. Cycle life vs. DOD of a lithium-ion battery.
The grid power delivered to the PBS is denoted by PG, and the load is denoted by PL. The battery power PB and the power consumed by the BS controller PC are covered by PBS. As a result, the grid power may be expressed as follows:
The BS controller provides power conversion and control. It is reasonable to presume that it is proportionate to the power flow.
The energy produced by photovoltaic (PV) and wind turbines (WTs), among the energy sources in the studied hybrid grid (HG), is dependent on environmental conditions and has no cost to produce, in contrast to DG, which needs fuel to generate electricity. The FC of the DGs is therefore defined in the following:
where
A quadratic function of the DG output power is used to model fuel costs for each DG in a timely manner, expressed as follows [182]:
where
Battery power control is primarily used in this study to implement load-side power factor control (PFC). At the same time, we would like to retain the battery’s state of charge (SOC) around a given level, say 80 percent. As a result, the battery power
The grid power in Eq. 2 becomes the following:
The BS control will satisfy the criterion
The linear and step response droop are the two droop control systems recognized by the North American Electric Reliability Corporation (NERC) (Zhao et al., 2014). The battery power is regulated in the following way:
where
where
where
As a result, the battery power equation is as follows:
Figure 1 depicts the relationship between regular battery life loss and DOD, with cycle loss increasing with cycle depth.
Here, we propose a method to evaluate the battery energy lost in the PFC operation. The energy exchange,
where
where
where
A model of the battery energy efficiency presented in the study by Ohmori et al. (2016) is used as follows:
where Re, Rp0, and α are the model parameters identified experimentally.
The power flow limit that all HG energy sources, considering PV and WTs, BS, and DGs, fulfil the demanded power by load side of HG naturally for each hour is expressed as follows:
where
The PV and WG output must be kept at the t′ time interval within the following minimum and highest power restrictions because the RES power generated depends on the setting (Zhao et al., 2014):
where
Under the lowest and highest power restrictions, the output power can be expressed as follows (Chen et al., 2017):
where
The power delivered by the DGs is also constrained by physical limitations for starting and closing, as expressed by ramp rate limits and expressed by Chen et al. (2017) as follows:
where
The battery voltage should be within the specified power limit and can be expressed as follows:
where
At all times, the battery’s energy storage level must be kept between the minimum and maximum limits:
where
The SOC heights have a significant impact on battery life; as a result, battery SOC levels should be kept within the predefined limits:
The forward propagation in each ANN-layer is expressed as follows (Kang et al., 2012), (Lu et al., 2010) and (Eftekhari, 2017):
where
where
The GA algorithm propagates the error from the output of the MLP-layer. Let l = 1 for the input layer and l = L for the output layer. Assume that QL is the number of classes in the output, for a given input vector; let its target be [t1,…..,
The delta error,
Therefore, the regular back propagation from the first MLP layer to the last ANN layer is performed as follows:
After performing the first back propagation from layer (l+1) to current layer l, the GA may carry to the input delta of ANN layer l,
where
The GA of delta error
where rev (.) is used for array reversing and conv1Dz (…) is used for full 1D convolution performing with zero-padding.
The derivative of the error with respect to weight and bias may be expressed as follows:
The weights and biases can be updated with learning rate
This study considers the costs of battery deprivation and the cost of fuel for traditional generators. A combination of two ANNs and genetic algorithms is used to solve PMS problems. The objective function is optimized using the ANN, while the genetic algorithm for the search is used to establish the BDC. Figure 2 and Figure 3 show the flood map of the overall implementation of the ANN and the genetic algorithm for the PMS issue.
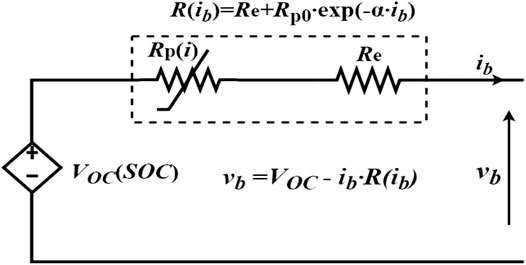
FIGURE 2. Battery circuit model.
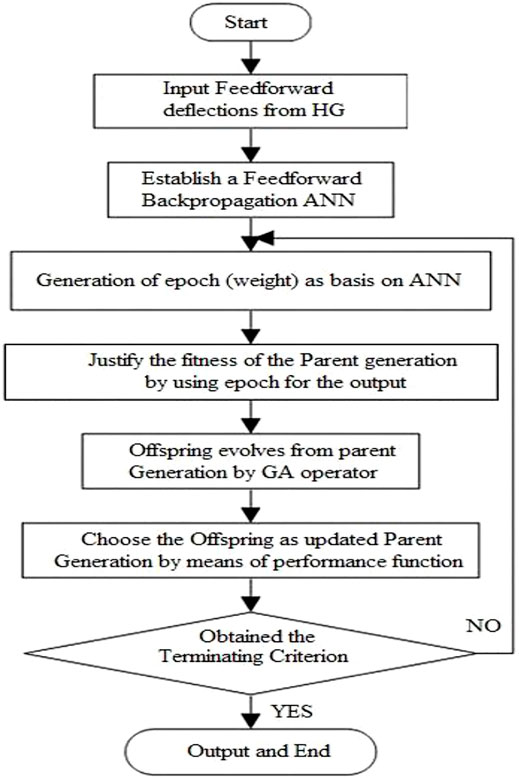
FIGURE 3. Flowchart of the ANN and the genetic algorithm.
An isolated HG with PV panels, a WT, a charger, and two DGs was used to test the suggested objective feature using the ANN. The judgement variables in this study are as follows:
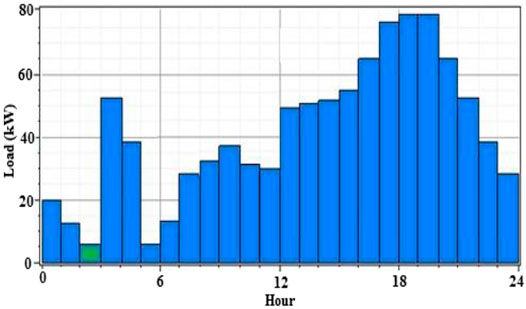
FIGURE 4. Load demand of an isolated hybrid grid throughout a day.
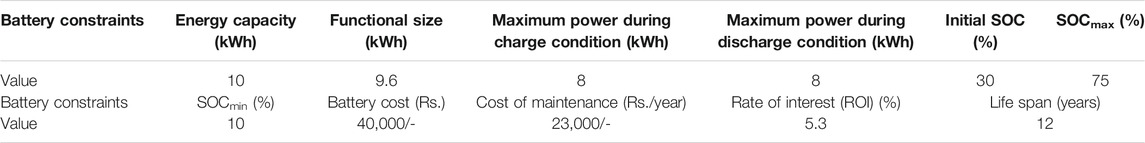
TABLE 1. Battery specifications.
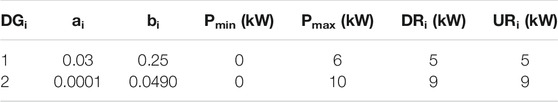
TABLE 2. Diesel generator specifications.
The ANN-GA solves the energy dispatching (ED) dilemma where 50 is the population size and 100 is the cumulative number of iterations. The better costs, using different weighting criteria, the worse cost, and the mean cost of the proposed goal feature are used to evaluate its efficacy.
In the objective role of simulation research, various WF importances are taken into account to assess the effect of a given WF goal and to see its impact on the HG approach. The impact of the WF on the algorithm behavior, battery SOC status, and optimized cost-activity functions is thus analyzed. The ED problem is solved by the ANN. To examine the accuracy and effectiveness of the proposed ANN protective algorithm, two other conventional methods are used for comparisons which are neural networks (ANNs) and fuzzy neural networks (FNNs); the structure of these methods is shown in Table 2. The accuracy of testing results is computed for the proposed method and for the two other methods. The test results are used to check the accuracy by measuring the F1 score, which is the harmonic mean between precision and recall (Fleer and Stenzel, 2016). Table 2 shows that the accuracy of the proposed method has high identification accuracy from the other two methods and with the same total MSE of 0.001, the proposed method is convergent with less than 2,550 epochs, as compared with the convergence epoch numbers of the ANN and the FNN. This proves that the performances of the proposed ANN algorithm are effective and perform higher classification accuracy. The learning of the total MSE with the number of epochs for the proposed ANN algorithm and the other two methods is shown in Figures 5–7.
FIGURE 5. Wind turbine output power throughout a day.
FIGURE 6. PV output power throughout a day.
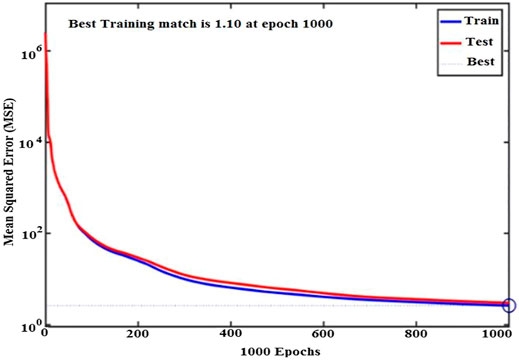
FIGURE 7. Mean square error with number of epochs.
To avoid overcharging and over-discharging, the battery’s state of charge (SOC) is used as a restriction on the ED issue. The effect of WF on battery SOC activity is depicted in Figure 8. A range of WF values are assessed with the objective feature (0, 250, and 1,000). If the battery does not get drained, numerous charge and discharge cycles are clearly shown, which indicate that the battery provides considerable energy in the HG. If further charging loops, however, are prevented and a battery life extension is possible, then the goal intersects with the relationship among the two goals. This graph demonstrates that the SOC condition is sustained more consistently and load times are shortened. The number of mutual batteries with HGs is also smaller, and the cost function is higher than in Table 3.

FIGURE 8. Impact of the weight factor value, that is, e = 0.250, 1,000 on the battery SOC behavior.
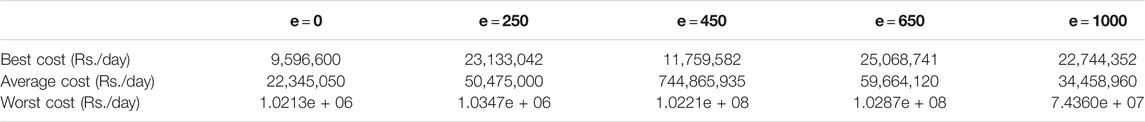
TABLE 3. For 1,000 test runs using the ANN-GA algorithm, objective output was measured using different weight values.
In order to maintain the trade-offs among the two goals, the next ED problem simulation result of HG units is conducted for e = 250. Using the ANN algorithm, the maximum power of both installed DGs can be calculated. The results of high performance at night and low morning output of both DGs during the simulation stage are seen in Table 4. The optimum power exchange between the HG and the battery is shown in Table 5 using the ANN-GA algorithm. The best power generation RGs of the ANN-GA algorithm also appear in Table 6. As PV and WT generators begin electricity production, they generate renewable energy that helps sustain DG generation. For charging the tank, most RE industries are used.
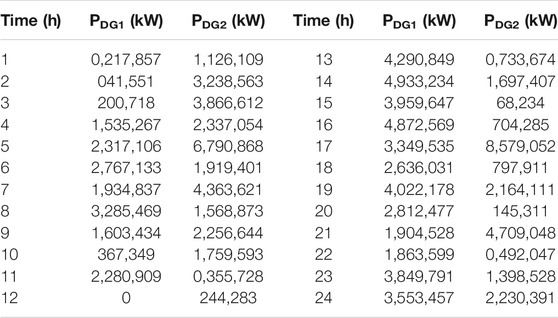
TABLE 4. Diesel generators generate optimal power
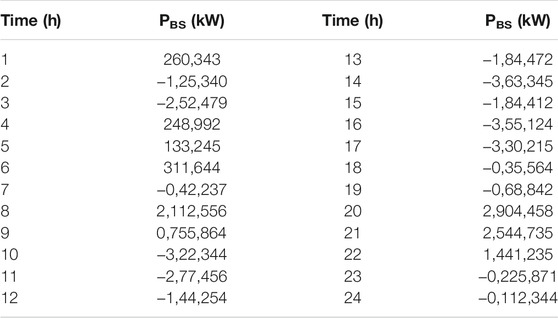
TABLE 5. Battery produces optimal power using the ANN for e = 250.
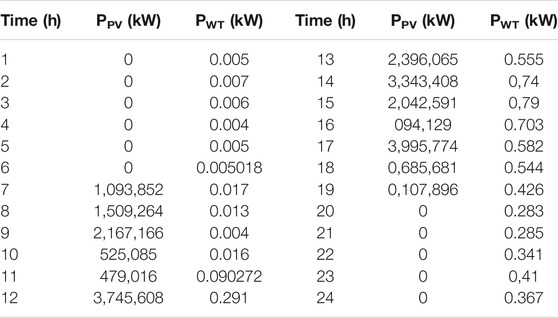
TABLE 6. Renewable generators generate optimal power and express by
Figure 9 shows the optimum ED solution for HG devices over a period of 24 h as seen in Tables 4–6. Both HG units are specifically participating in the satisfaction of the LD. The battery charges due to the lower LD and DGs are reduced to minimal until the panel and the WT generator start generating electricity. As described in the article, the HG charges the pile while the battery delivers power to the HG, if positively. The surplus power can be supplied to the battery where the energy given by the RE or by the DGs is lower. Then the DGs and the battery should cooperate in order for the LD to fulfill the need when the RE supply is limited and LD energy demands more in the night.

FIGURE 9. Resulting ED solution of HG generation units.
This article expresses a 24-h horizon energy transmission cycle of an isolated HG with battery storage. In addition to the fuel cost, the objective feature proposes battery depletion costs. The question of energy transmission was to reduce the FC of DG and BDC to a minimum. In the proposed target function, a WF is implemented. The ANN-GA addresses the energy supply issue in order to ensure the best supply of isolated HGs such as the WT engine, PV, two DGs, and batteries. The results show that it is necessary to select the appropriate value of WF for the best cost function. WF also affects the state of the SOC battery. The results show that the SOC battery with WF equal to 250 remains more robust and the charging cycles decreased. The ED problem of HG generating units is performed on e = 250 in order to resolve the trade-off between the BDC and FC. The ANN-GA adds all HG units together to satisfy the LD
The original contributions presented in the study are included in the article/Supplementary Material; further inquiries can be directed to the corresponding authors.
All authors listed have made a substantial, direct, and intellectual contribution to the work and approved it for publication.
This research was funded by the Deanship of Scientific Research at Princess Nourah bint Abdulrahman University through the Fast-track Research Funding Program.
The authors declare that the research was conducted in the absence of any commercial or financial relationships that could be construed as a potential conflict of interest.
All claims expressed in this article are solely those of the authors and do not necessarily represent those of their affiliated organizations, or those of the publisher, the editors, and the reviewers. Any product that may be evaluated in this article, or claim that may be made by its manufacturer, is not guaranteed or endorsed by the publisher.
Aduda, K. O., Labeodan, T., and Zeiler, W. (2018). Towards Critical Performance Considerations for Using Office Buildings as a Power Flexibility Resource-A Survey. Energy and Buildings 159, 164–178. doi:10.1016/j.enbuild.2017.10.096
Alizadeh, M., Chang, T.-H., and Scaglione, A. (2012). “Grid Integration of Distributed Renewables through Coordinated Demand Response,” in Proceeding of the IEEE 51st Annu. Conf. Decis. Control (CDC), Maui, HI, USA, Dec. 2012 (IEEE), 3666–3671. doi:10.1109/cdc.2012.6426122
Barooah, P. (2019). Virtual Energy Storage from Flexible Loads: Distributed Control with QoS Constraints, Smart Grid Control. Cham, Switzerland: Springer, 99–115. doi:10.1007/978-3-319-98310-3_6
Brooks, J., and Barooah, P. (2018). Consumer-aware Distributed Demand-Side Contingency Service in the Power Grid. IEEE Trans. Control. Netw. Syst. 5 (4), 1987–1997. doi:10.1109/tcns.2017.2781368
Brooks, J., and Barooah, P. (2019). Coordination of Loads for Ancillary Services with Fourier Domain Consumer QoS Constraints. IEEE Trans. Smart Grid 10 (6), 6148–6155. doi:10.1109/tsg.2019.2897231
Chen, K., Zhou, F., Yin, L., Wang, S., Wang, Y., and Wan, F. (2018). A Hybrid Particle Swarm Optimizer with Sine Cosine Acceleration Coefficients. Inf. Sci. 422, 218–241. doi:10.1016/j.ins.2017.09.015
Chen, Y., Hashmi, M. U., Mathias, J., Bušić, A., and Meyn, S. (2017). Distributed Control Design for Balancing the Grid Using Flexible Loads, IMA Volume on the Control of Energy Markets and Grids. New York, NY, USA: Springer, 1–26.
Douglass, P. J., Garcia-Valle, R., Nyeng, P., Østergaard, J., and Togeby, M. (2011). “Demand as Frequency Controlled reserve: Implementation and Practical Demonstration,” in Proceeding of the 2nd IEEE PES Int. Conf. Exhibit. Innov. Smart Grid Technol., Manchester, UK, Dec. 2011 (IEEE), 1–7. doi:10.1109/isgteurope.2011.6162711
Eftekhari, A. (2017). Energy efficiency: A critically important but neglected factor in battery research. Sustain. Energy Fuels 1, 2053–2060. doi:10.1039/C7SE00350A
Fleer, J., and Stenzel, P. (2016). Impact Analysis of Different Operation Strategies for Battery Energy Storage Systems Providing Primary Control reserve. J. Energ. Storage 8, 320–338. doi:10.1016/j.est.2016.02.003
Huerta, J. M. E., Castelló-Moreno, J., Fischer, J. R., and García-Gil, R. (2010). A Synchronous Reference Frame Robust Predictive Current Control for Three-phase Grid-Connected Inverters. IEEE Trans. Ind. Electron. 57 (3), 954–962. doi:10.1109/tie.2009.2028815
Kang, J., Yan, F., Zhang, P., and Du, C. (2012). A Novel Way to Calculate Energy Efficiency for Rechargeable Batteries. J. Power Sourc. 206, 310–314. doi:10.1016/j.jpowsour.2012.01.105
Kasis, A., Devane, E., Spanias, C., and Lestas, I. (2017). Primary Frequency Regulation with Load-Side Participation-Part I: Stability and Optimality. IEEE Trans. Power Syst. 32 (5), 3505–3518. doi:10.1109/tpwrs.2016.2636286
Kasis, A., Devane, E., Spanias, C., and Lestas, I. (2017). Primary Frequency Regulation with Load-Side Participation-Part II: Beyond Passivity Approaches. IEEE Trans. Power Syst. 32 (5), 3519–3528. doi:10.1109/tpwrs.2016.2636284
Kim, Y.-J., Fuentes, E., and Norford, L. K. (2016). Experimental Study of Grid Frequency Regulation Ancillary Service of a Variable Speed Heat Pump. IEEE Trans. Power Syst. 31 (4), 3090–3099. doi:10.1109/tpwrs.2015.2472497
Lin, Y., Barooah, P., Meyn, S., and Middelkoop, T. (2015). Experimental Evaluation of Frequency Regulation from Commercial Building HVAC Systems. IEEE Trans. Smart Grid 6 (2), 776–783. doi:10.1109/tsg.2014.2381596
Lu, R., Yang, A., Xue, Y., Xu, L., and Zhu, C. (2010). Analysis of the Key Factors Affecting the Energy Efficiency of Batteries in Electric Vehicle. World Electr. Veh. J. 4 (2), 9–13. doi:10.3390/wevj4010009
Mallada, E., Zhao, C., and Low, S. (2017). Optimal Load-Side Control for Frequency Regulation in Smart Grids. IEEE Trans. Automat. Contr. 62 (12), 6294–6309. doi:10.1109/tac.2017.2713529
Mathieu, J. L., Koch, S., and Callaway, D. S. (2013). State Estimation and Control of Electric Loads to Manage Real-Time Energy Imbalance. IEEE Trans. Power Syst. 28 (1), 430–440. doi:10.1109/tpwrs.2012.2204074
Ohmori, H., Iwai, H., Itakura, K., Saito, M., and Yoshida, H. (2016). Numerical Prediction of System Round-Trip Efficiency and Feasible Operating Conditions of Small-Scale Solid Oxide Iron-Air Battery. J. Power Sourc. 309, 160–168. doi:10.1016/j.jpowsour.2016.01.090
Rauf, S., Rasool, S., Rizwan, M., Yousaf, M., and Khan, N. (2016). Domestic Electrical Load Management Using Smart Grid. Energ. Proced. 100, 253–260. doi:10.1016/j.egypro.2016.10.174
Schuitema, G., Ryan, L., and Aravena, C. (2017). The Consumer's Role in Flexible Energy Systems: An Interdisciplinary Approach to Changing Consumers' Behavior. IEEE Power Energ. Mag. 15 (1), 53–60. doi:10.1109/mpe.2016.2620658
Sedghi, M., Ahmadian, A., and Aliakbar-Golkar, M. (2016). Optimal Storage Planning in Active Distribution Network Considering Uncertainty of Wind Power Distributed Generation. IEEE Trans. Power Syst. 31 (1), 304–316. doi:10.1109/TPWRS.2015.2404533
Shi, Y., and Eberhart, R. (1998). “A Modified Particle Swarm Optimizer,” in Evolutionary Computation Proceedings, 1998. IEEE World Congress on Computational Intelligence., The 1998 IEEE International Conference on, Anchorage, AK, USA, May 1998 (IEEE), 69–73.
Silva, H. B. d., and Santiago, L. P. (2018). On the Trade-Off between Real-Time Pricing and the Social Acceptability Costs of Demand Response. Renew. Sustain. Energ. Rev. 81 (1), 1513–1521. doi:10.1016/j.rser.2017.05.219
Sufyan, M., Abd Rahim, N., Tan, C., Muhammad, M. A., and Sheikh Raihan, S. R. (2019). Optimal Sizing and Energy Scheduling of Isolated Microgrid Considering the Battery Lifetime Degradation. PloS one 14 (2), e0211642. doi:10.1371/journal.pone.0211642
Ting-Yu Chang, C.-T., and Chang, T.-Y. (1994). An Improved Hysteresis Current Controller for Reducing Switching Frequency. IEEE Trans. Power Electron. 9 (1), 97–104. doi:10.1109/63.285499
Vardakas, J. S., Zorba, N., and Verikoukis, C. V. (2015). A Survey on Demand Response Programs in Smart Grids: Pricing Methods and Optimization Algorithms. IEEE Commun. Surv. Tutorials 17 (1), 152–178. doi:10.1109/comst.2014.2341586
Vrettos, E., Oldewurtel, F., and Andersson, G. (2016). Robust Energy-Constrained Frequency Reserves from Aggregations of Commercial Buildings. IEEE Trans. Power Syst. 31 (6), 4272–4285. doi:10.1109/tpwrs.2015.2511541
Zhao, C., Yin, H., Yang, Z., and Ma, C. (2014). “A Quantitative Comparative Study of Efficiency for Battery-Ultracapacitor Hybrid Systems,” in Proceedings, 2014 40th Annual Conference of the IEEE Industrial Electronics Society, Dallas, TX, USA, Nov. 2014 (IEEE), 3076–3082. doi:10.1109/iecon.2014.7048949
HG hybrid grid
RES renewable energy source
GC grid-connected
PMS power management system
LD load demand load demand
BS battery storage
FLC fuzzy logic control
GA genetic algorithm
LD load demand load demand
CM maintenance costs
ARF annual recovery factor
ESS energy storage system
SOC state of the charge
PSO particle swarm optimization
BDC battery deprivation cost
ANN- artificial neural network
WT wind turbine
WS wind speed wind speed
DOD depth of discharge
TLL total life lost,
WS wind speed wind speed
CBat cost of purchasing the batteries
CSD self-degradation cost
Keywords: hybrid grid energy system, hybrid energy source, battery deprivation cost, genetic algorithm, ANN
Citation: Riyaz A, Sadhu PK, Iqbal A, Tariq M, Urooj S and Alrowais F (2021) Power Management of Hybrid Grid System With Battery Deprivation Cost Using Artificial Neural Network. Front. Energy Res. 9:774408. doi: 10.3389/fenrg.2021.774408
Received: 11 September 2021; Accepted: 27 September 2021;
Published: 08 November 2021.
Edited by:
Sudhakar Babu Thanikanti, Chaitanya Bharathi Institute of Technology, IndiaReviewed by:
Mohammad Amir, Jamia Millia Islamia, IndiaCopyright © 2021 Riyaz, Sadhu, Iqbal, Tariq, Urooj and Alrowais. This is an open-access article distributed under the terms of the Creative Commons Attribution License (CC BY). The use, distribution or reproduction in other forums is permitted, provided the original author(s) and the copyright owner(s) are credited and that the original publication in this journal is cited, in accordance with accepted academic practice. No use, distribution or reproduction is permitted which does not comply with these terms.
*Correspondence: Mohd Tariq, dGFyaXEuZWVAemhjZXQuYWMuaW4=; Shabana Urooj, c211cm9vakBwbnUuZWR1LnNh
Disclaimer: All claims expressed in this article are solely those of the authors and do not necessarily represent those of their affiliated organizations, or those of the publisher, the editors and the reviewers. Any product that may be evaluated in this article or claim that may be made by its manufacturer is not guaranteed or endorsed by the publisher.
Research integrity at Frontiers
Learn more about the work of our research integrity team to safeguard the quality of each article we publish.