 Guoying Lin1,2
 Shaoyong Hong
 Zhixian Ni
94% of researchers rate our articles as excellent or good
Learn more about the work of our research integrity team to safeguard the quality of each article we publish.
Find out more
ORIGINAL RESEARCH article
Front. Energy Res., 10 November 2021
Sec. Process and Energy Systems Engineering
Volume 9 - 2021 | https://doi.org/10.3389/fenrg.2021.773805
This article is part of the Research TopicAdvanced Technologies for Planning and Operation of Prosumer Energy SystemsView all 111 articles
Electricity theft behavior has serious influence on the normal operation of power grid and the economic benefits of power enterprises. Intelligent anti-power-theft algorithm is required for monitoring the power consumption data to recognize electricity power theft. In this paper, an adaptive time-series recurrent neural network (TSRNN) architecture was built up to detect the abnormal users (i.e., the electricity theft users) in time-series data of the power consumption. In fusion with the synthetic minority oversampling technique (SMOTE) algorithm, a batch of virtual abnormal observations were generated as the implementation for training the TSRNN model. The power consumption record was characterized with the sharp data (ARP), the peak data (PEA), and the shoulder data (SHO). In the TSRNN architectural framework, a basic network unit was formed with three input nodes linked to one hidden neuron for extracting data features from the three characteristic variables. For time-series analysis, the TSRNN structure was re-formed by circulating the basic unit. Each hidden node was designed receiving data from both the current input neurons and the time-former neuron, thus to form a combination of network linking weights for adaptive tuning. The optimization of the TSRNN model is to automatically search for the most suitable values of these linking weights driven by the collected and simulated data. The TSRNN model was trained and optimized with a high discriminant accuracy of 95.1%, and evaluated to have 89.3% accuracy. Finally, the optimized TSRNN model was used to predict the 47 real abnormal samples, resulting in having only three samples false predicted. These experimental results indicated that the proposed adaptive TSRNN architecture combined with SMOTE is feasible to identify the abnormal electricity theft behavior. It is prospective to be applied to online monitoring of distributed analysis of large-scale electricity power consumption data.
With the increasing scale of the power grid, the power consumption is becoming larger year by year. People are concerning on the economic operation of power network, saving of electric resources, reduction of grid line loss, and structural optimization on power consumption (Dileep, 2020). However, the customer’s behavior of stealing electricity comes in non-stopping emergence. This infraction phenomenon has seriously affected the normal operation of power grid and the economic benefits of power enterprises (Li et al., 2019; Zhang et al., 2020). The electricity theft rate in developing countries is as high as 30%, and the social power supply and consumption has also been greatly influenced. According to rough statistics, China’s power enterprises lose as much as 20 billion CNY every year due to power theft. Therefore, power enterprises must carry out efficient anti-electricity-theft work, in order to guarantee the reasonable power supply and rational use of electricity, thus to reduce economic losses as much as possible (Aryanezhad, 2019).
The traditional detection methods of power theft mainly rely on the scheduled operations of technicians who work in power supply enterprises. The operation goes with reading the electricity meter and then recording, counting, and performing manual analysis and calculation. In the hardware aspect, there are multifaceted operations that can prevent energy theft, such as to install the specialized watt-hour metering box, to implement a kind of conductor that closes the low-voltage outlet to the metering device, to add anti-thief function to the watt-hour meter, and to improve the application rate of electrical acquisition system (Jokar et al., 2016). However, most of these traditional anti-theft detection methods focus on the improvement of power devices. There is a lack of sufficient anti-power-stealing algorithms to analyze massive historical power consumption data, so it is difficult to find the power consumption characteristics of power-stealing users and detect the power-stealing behavior realized by advanced attack means (Ahmad et al., 2015). Therefore, the development of power industry needs to strengthen the development of new artificial intelligence and information and automation technology. With the continuous improvement of dynamic monitoring and acquisition technology of power consumption data of power grid users, it is of great engineering significance to study the intelligent anti-power-theft algorithm based on the big data of the power consumption to identify the power theft behavior (Ren et al., 2020; Zhang et al., 2021).
At present, the most popular scheme is to lay out the smart grid detection architecture and framework, then to collect the power consumption data, and upload them to the centralized data processing center through the terminal smart meter, and successively, the centralized data can be further analyzed by intelligent algorithms to detect electricity theft. The prevalent anti-power-stealing data mining algorithms include clustering, BP neural network, and local outlier detection algorithm (Al-Dahidi et al., 2019; Li Y. et al., 2021). Many practical experiments have been studied in previous research works. A typical load curve is extracted from the power consumption data by applying the adaptive K-means clustering algorithm to realize load forecasting and load control (Zhu et al., 2016). The situation of abnormal point detection method was proposed based on a fuzzy neural network to deal with various data, which provides a new idea for mining abnormal data from the power consumption records (Mozaffar et al., 2018). The flying anomaly factor detection and analysis method was investigated to detect an electric energy meter flying anomaly (Li et al., 2016). A novel detection method of power theft was constructed based on the one-class SVM algorithm. A calibration model was established by analyzing a large number of historical data. If the current data are inconsistent with the model, it is considered that there is a possibility of power theft (Dou et al., 2018). Also, the RBF neural network was proposed to detect the electricity-stealing behavior, which used the data characteristics of voltage, current, and power factor to detect electricity theft, to make a positive detection on electricity stealing (Cao et al., 2018).
Due to the wide layout of the power grid, the large-scale deployment of smart meters should consume a lot of resources. In order to save the energy consumption of distributed terminal nodes, and reduce the non-essential data transmission, it is necessary to study modern data mining technology, in integration with machine learning algorithms (Wang et al., 2020; Li Z. et al., 2021). The application of indirect data anomaly detection as well as some preprocessing and analyzing technologies is much necessary to achieve the online detection of power theft. However, data-driven power theft detection is a special type of anomaly detection, which has a serious class imbalance problem (Avila et al., 2018). Actually, the number of normal power consumption users is much larger than the number of abnormal users. The inherent imbalance of data will affect the performance of traditional machine learning methods. Until now, only a few studies have considered the category imbalance in power theft detection (Zhang et al., 2019). The solutions of these works are mainly performed with undersampling and oversampling methods in the aspects of data analytical algorithm. They were keen on simultaneously implementing the random oversampling and undersampling techniques, to select the best detection effect by testing different sampling ratios. Otherwise, they focus on increasing the misclassification cost of abnormal users to improve the detection rate of electricity theft, by setting penalty parameters for support vector machine misclassification of normal and abnormal users (Hu et al., 2019).
Generally, the electricity theft monitoring data are a kind of time-series data. The difficulty of data analysis lies in how to find the abnormal data from the constantly updated dynamic data flow, so as to accurately predict the theft users. The fact that the data are extremely imbalance is the first-of-all analytical difficulty. Many experiments have proved that oversampling is a solution to the category imbalance problem. In essence, the random oversampling method increases the weight in the sample set by randomly copying a few samples. It does not increase classification accuracy but is easy to cause over-fitting (He and Garcia, 2019). Synthetic minority oversampling technique (SMOTE) is an unbalanced data recall method that is improved from the linear interpolation calculation methodology. It uses the local prior distribution information of samples to improve the accuracy of minority samples, to solve the data imbalance problem (Zhu et al., 2017). Furthermore, the recurrent neural network (RNN) is an effective intelligent machine learning method that is especially effective for monitoring and analyzing time-series dynamic data flow. The RNN is derived from the conventional fully connected neural network (FCNN) model. Its core operation is to compute the result of each neuron not only from its input data (similar to the FCNN) but also from the historical variables from its former calculations (different from the FCNN). The RNN model is widely used in addressing the tasks of sequential data processing (Liu et al., 2020). The running of the RNN structure is to produce a neuron output by combined fusing of the current status data with the previous status data of the system. The RNN is able to automatically learn the time correlation of the input data without specifying any lag observations (Cossu et al., 2021). It is well known that the traditional time-series analytical methods (such as auto-correlation) need to identify the seasonality and stability from the time-series data. The effectiveness of identification may vary according to the network structure and the calculation speed, and it needs to be adjusted for each simulation (Chen et al., 2018; Farjaminezhad et al., 2021). The characteristic of the RNN is to create a closed-loop calculation in the hidden layer, which forms a circulating adaptive model to capture the internal hidden historical state features in the way of iterative update, and thus to complete the process of error level accumulation in the training stage. In effect, the RNN model is enforced to adapt the error accumulation and improve the model robustness (Ståhl et al., 2019).
This paper is aimed at designing a data-driven adaptive parameter optimization time-series RNN (TSRNN) architecture, for intelligent machine learning to solve the problem of abnormal monitoring of power consumption. The TSRNN architecture with an adaptive training strategy is constructed by monitoring, collecting, and analyzing the observed data of a stage. Then, the non-linear features of the observed data can be extracted by developing a hyperparametric optimization mode of RNN, in fusion with a SMOTE solvation of data imbalance. On this algorithmic basis, the power-stealing users with abnormal characteristics are identified in a large number of power user samples. In structural detail, grid search is designed for the parameter selection of the RNN linking weights, and also, a fault-tolerance iteration mechanism is adopted for parameter optimization in the closed-loop training stage, to control the error accumulation in model prediction, so as to enhance the model robustness. In this way, the proposed intelligent TSRNN architecture with data-driven adaptive parameter optimization is validated through data training and prediction. The optimized model is effective for accurate extraction of the data features of power-stealing behavior. The establishment of the intelligent TSRNN model is expected to overcome the costly, laborious, and time-consuming problems of the traditional methods for monitoring electricity theft. It is feasible to speed up to locate the abnormal watt-hour meter terminals and accurately identify the power-stealing users. The proposed method helps promote the development of artificial intelligence and information analysis technology in the field of power grid operation and maintenance.
In this section, we discuss the basic structure of the TSRNN architecture and the algorithmic progress of SMOTE balancing. The energy theft detection model is established and further optimized by fusion of TSRNN and SMOTE. And the discriminant indicators are introduced based on the confusion matrix for the quasi-qualitative recognition of the abnormal user data.
The SMOTE algorithm is an oversampling method based on synthetic sampling proposed by Chawla (Chawla et al., 2002). In geometric sense, the SMOTE method firstly observes the minority samples and connects them and a batch of their surrounding samples. Then, it produces new samples by random insertion on the connecting lines. The connection and insertion operation can reduce the imbalance of sample space and simultaneously prevent the over-fitting phenomenon by suppressing too large repetition of the original minority samples (Fernández et al., 2018; Chen et al., 2021). The schematic diagram for generating new samples by the SMOTE algorithm is shown in Figure 1. Specifically, the SMOTE sample-generating procedures are described in the following steps:
Step 1: Let
Step 2: Search
Step 3: Randomly select
Step 4: To generate a set of new samples by random linear interpolation computation, the new samples are denoted as
with
Step 5: The newly generated samples
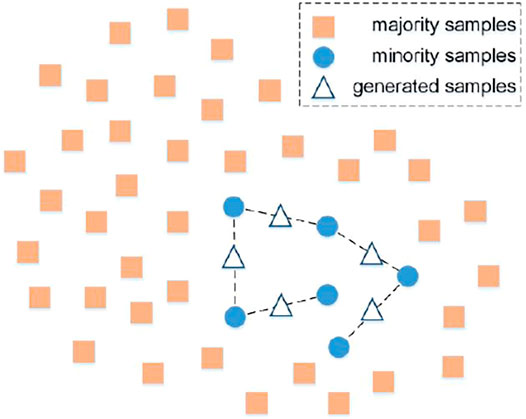
FIGURE 1. Schematic diagram of the SMOTE algorithm.
The SMOTE algorithm makes artificial synthesis of minority samples by random interpolation. Compared with the traditional methods of random replication, SMOTE reduces redundant information of newly generated minority samples and effectively avoids the phenomenon of over-fitting in the subsequent data mining processes. In algorithm, SMOTE shows its uncertainty in part of selecting the nearest neighborhood of the original minority samples, namely, the number of neighbor samples (i.e., the number of
The data-driven time-series analysis problem is theoretically described as a general ordinary differential model (Li and Yang, 2021), formulated as
where
An FCNN module is traditionally applied as a black box to directly transform the input data to the hidden layer and then to get the output. The generated data acquired at each neuron node are described as
The TSRNN architecture is built up with circulation computation of the hidden layer. To unfold the circulation ring, the TSRNN structure is introduced as shown in Figure 2. As is shown in Figure 2, the TSRNN architecture is supposed to be constructed along a time variance axis. At the starting of time, the power consumption user data are input into the network and delivered to the first hidden layer (H1) while
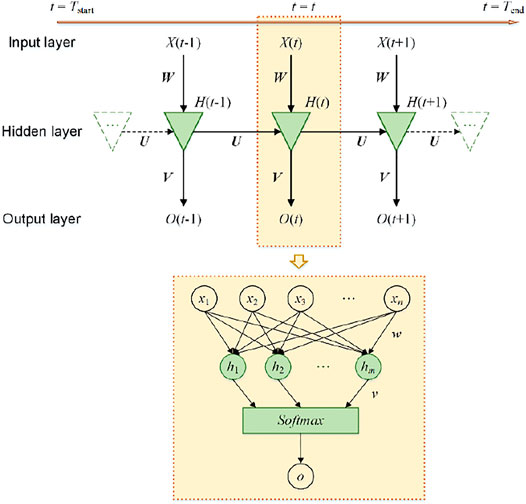
FIGURE 2. Structural design of the time-series RNN (TSRNN) architecture.
Figure 2 also presents a simple TSRNN cell structure at the instant moment of time
where the function
Successively, data
where
The Mahalanobis distance between any two of the
where
Finally, the Mahalanobis-based k-means clustering results of the TSRNN-extracted feature data are used for further calculation of the discriminant indicators, thus to help identify the abnormal users from all of the electric power consumption data.
The power consumption data are originally imbalanced because the normal electricity users are much larger than the electricity thieves. It is expensive to identify the abnormal users. In our algorithmic designs, SMOTE is functional to alleviate the data imbalance, and the adaptive TSRNN model extracts the feature of power consumption data for improving the model discrimination accuracy with the k-means Mahalanobis measure. The model should be evaluated with quantitative indicators. The confusion matrix is a basic tool to evaluate the model performance (see Table 1). Then, the indicators of each model are verified based on the matrix table.
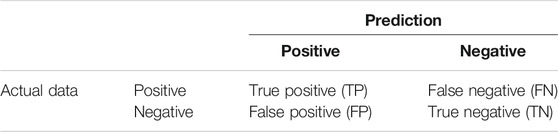
TABLE 1. Confusion matrix for evaluation of the discrimination/classification models.
By definition of the confusion matrix, the normal power consumption users are distinguished as the negative records, while the abnormal users are taken as positive. Thus, the table markers are interpreted with the following information:
- TP indicates that the abnormal user (positive) is accurately predicted as abnormal (positive),
- TN indicates that the normal user (negative) is accurately predicted as normal (negative),
- FP indicates that the actual normal user (negative) is predicted false as abnormal (positive),
- FN indicates that the actual abnormal user (positive) is predicted false as normal (negative).
Multiple indicators are further calculated according to the confusion matrix, such as the classification accuracy (
These indicators are used to evaluate the model performance of the adaptive parametric-scaling TSRNN architecture. It is learnt from Eqs. 7–9 that the higher the TP and TN are, the better the model performance is.
For fault-tolerant analysis, the model prediction results can be monitored at every moment of the dynamic changing time series. By data export, there are a series of prediction results acquired for the model classification of normal and abnormal users. Then, the frequency of identification of abnormal is counted for each user over the whole time-series axis, thus to provide an extra confirmation of the model predictions.
A total of 929 electricity/power consumption users were monitored continuously from January 1, 2017, to March 31, 2019, with the minimum time changing unit of 1 day; thus, we recorded 820 instant moments in the long time series spanning 25 months. Their electricity use data were collected in different partitions of time periods of hours according to the total usage amount. In detail, the electricity used during the hours of 00:00–08:00 is named the off-peak data (denoted as OPE for short), during 08:00–12:00 as the peak data (PEA), during 18:00–22:00 as the sharp data (ARP), and during the rest hours as the shoulder data (SHO).
If the electricity users are taken as the analytical samples, the power consumption characteristics of the 929 samples are demonstrated by the recorded data of OPE, PEA ARP, and SHO. There are 820 digital records for each user by time variance. As the maximum record is over thirty thousand and the minimum record is zero, the dataset should be normalized before analysis, applying the min–max normalization method (Jin et al., 2015). Then, we statistically derived the sample distribution using the average electricity consumption of the 820 time nodes (see Figure 3). As is seen from Figure 3, the users do not use electricity all along time; for example, some electricity consumption appears high in the ARP time but low or even zero in SHO, and some goes high in PEA but zero in ARP or OPE. To be specific, it is seen from the sub-figure of OPE (the blue plot) that only one user out of the 929 keeps using electricity during the OPE time period. Thus, it is recognized with statistical principles that the OPE data property hardly provides data information for discriminating the abnormal users. Then, the OPE data do not participate in the following modeling processes of SMOTE balancing and TSRNN training.
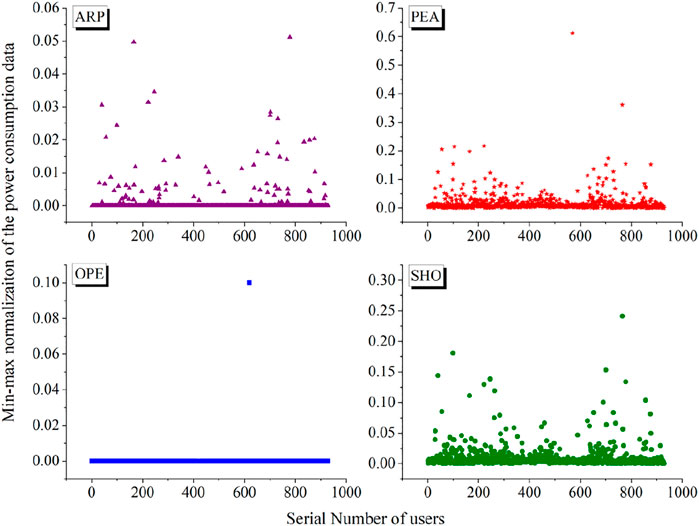
FIGURE 3. Statistical descriptive plots of the power consumption data in different time period partitions.
Practically, we have the priori target classification index for the 929 available power consumption user samples. There are originally 882 normal samples and only 47 abnormal samples. The normal samples are the majority, and the abnormal ones are the minority. The imbalance ratio of the normal over the abnormal goes to a great extent of around 19:1. The scattering distribution of the 929 samples is a plot in the 3D axis based on the three basic variables of ARP, PEA, and SHO (see Figure 4A). To ease the heavy imbalance status, the SMOTE algorithm is applied to increase the proportion of the minority samples by linear interpolations. According to the principle of the SMOTE simulation as introduced in The Principle of SMOTE, a batch of virtual samples are generated by interpolations on the original 47 abnormal samples.
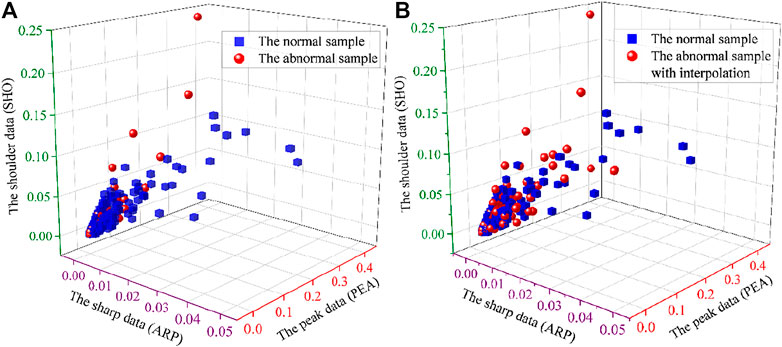
FIGURE 4. Distribution of the power consumption user samples (panel (A) is for the original 929 samples, and panel (B) is for the SMOTE-balanced output of the 1,151 samples).
Theoretically, one virtual sample is generated from the linking edge of every two samples. The 47 available samples are able to generate 1,081 (i.e.,
Hereafter, the 1,151 SMOTE-balancing samples were used to train the TSRNN model (defined in Time-Series RNN Model), as to build up an intelligent network architecture with adaptive grid optimization of parameters, for accurate recognition of the abnormal power users who are stealing electricity.
An applicable discrimination model for detecting electricity theft was trained using the TSRNN architecture based on the power consumption data of the 1,151 SMOTE-balanced samples. The recorded ARP, PEA, and SHO variables are taken as the network input. The data have a time-series record of 820 days.
The data samples were divided into two sets for model training and testing: 918 samples (∼80%) for training and 233 (∼20%) for testing. The training data were used to conduct the data-driven machine learning optimization of the TSRNN model. The model was constructed with three input neurons and one hidden neuron to produce the output results. There, we have three input-to-hidden linking weights (
In progress, the 918 training samples were introduced to the input layer at every moment of time and then delivered to compute the hidden variables. Notably, the RNN architecture is characterized with the circle of reproducing the hidden layer. The hidden variables at
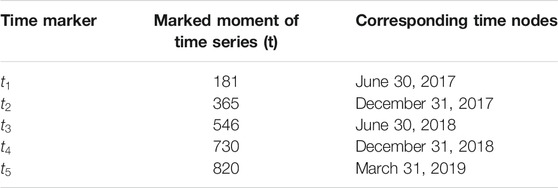
TABLE 2. Markers of the five special time nodes for investigation of the TSRNN model performance.
Based on the 918 training samples, the TSRNN model was trained with parameters’ iteration by circle improvement of the hidden neurons. We calculated the model discriminant indicators at each phase stoppage moment of
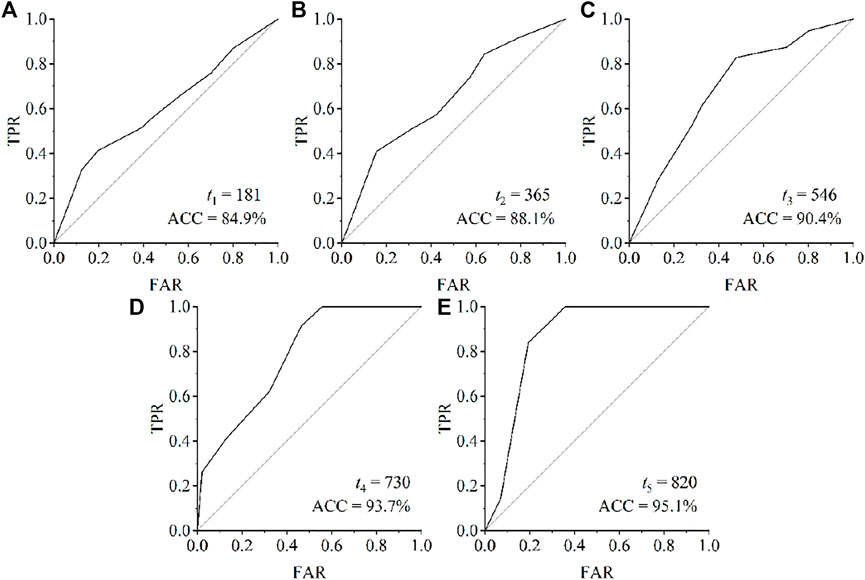
FIGURE 5. ROC curves for the evaluation of the TSRNN training effects at the five selected time markers based on the 918 training samples.
To study the machine learning progress on parameter optimization, we further investigate the running procedures of the adaptive tuning of the TSRNN linking weights. If the linking weights are denoted as a combination of
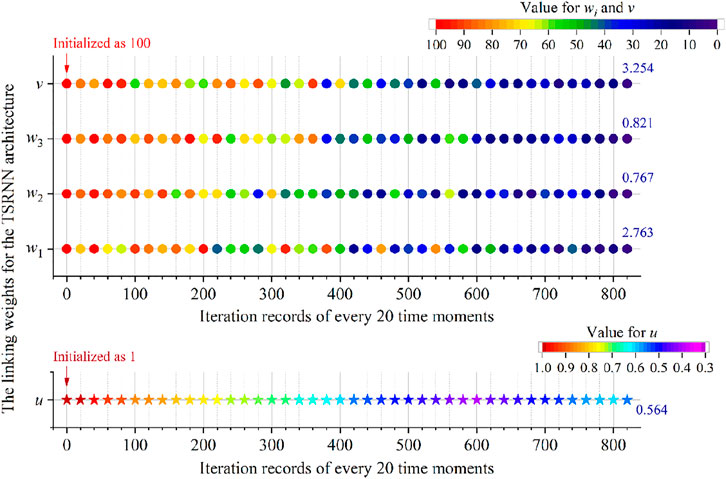
FIGURE 6. Training of linking weights in the TSRNN structure.
The predictive performance of the TSRNN discriminant model with adaptive tuning of the network weights was further evaluated by the 233 test samples, which were assumed to be “unknown” because they were not involved in the training process. We have the knowledge that there were 53 abnormal samples and 180 normal samples in the test sample set. The optimal TSRNN model is evaluated with a relative high prediction accuracy upon the quantitative metrics of the model indicators. The predictive ACC, TPR, and FAR were 89.3, 92.5, and 11.7%, respectively. The corresponding confusion matrix is shown in Table 3.
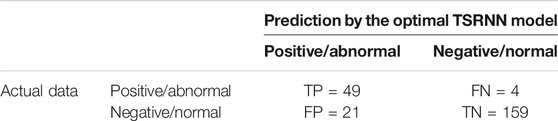
TABLE 3. Confusion matrix of the discriminating results predicted by the optimal TSRNN model for the 233 test samples.
Aiming to find out the electricity theft from the real power consumption users, the optimal model output its discriminant results for each sample (shown in Figure 7). The virtual use data which were produced by SMOTE balancing were not targeted for prediction. Thus, it is necessary to distinguish the real abnormal data from the virtual abnormal data. Practically, we used solid stars to mark the 10 real abnormal samples in the figure, and only two of them were predicted to be false. The results indicated that the adaptive TSRNN architecture is functional to predict the abnormal cases in the daily records of the power consumption data.
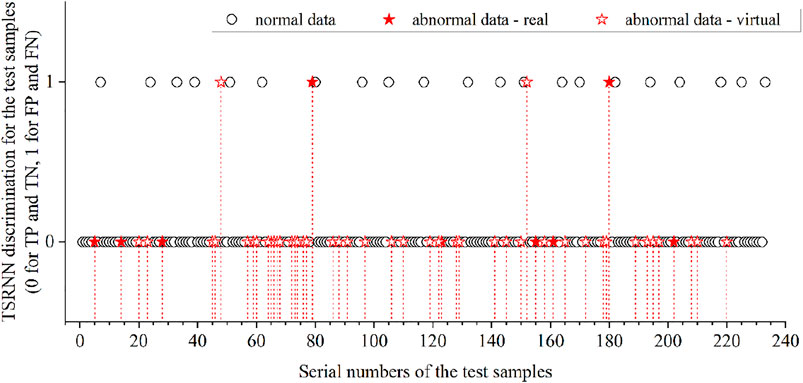
FIGURE 7. Discrimination for each test sample by the optimal TSRNN model.
Furthermore, the well-trained TSRNN architecture was utilized to monitor the time-series data from January 1, 2017, to March 31, 2019, to recognize the power consumption users who probably have electricity theft behavior. The identification of the real abnormal users is listed in Table 4. It is learnt from Table 4 that the optimal TSRNN model successfully identified 44 of the total of 47 abnormal users. The results show that the proposed adaptive TSRNN architecture combined with SMOTE sample balancing technique is able to accurately find the abnormal samples based on the analysis of the time-series–recorded power consumption data, thus to recognize the electricity theft behaviors.
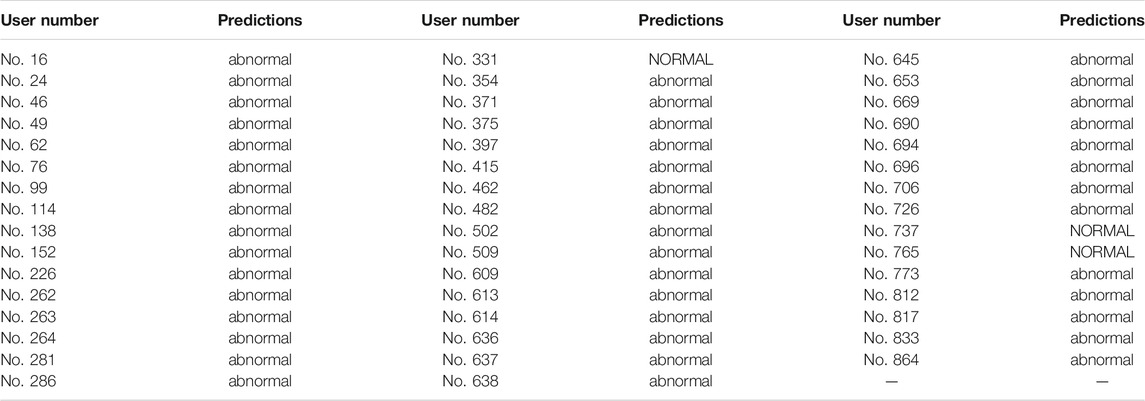
TABLE 4. Discrimination results for the 47 real abnormal data of the electricity theft users.
In this paper, an adaptive TSRNN architecture was built up to detect the electricity theft based on time-series data of the power consumption. The recorded data were monitored continuously from January 1, 2017, to March 31, 2019 (820 days in total). By monitoring the ARP, PEA, and SHO data, the users who are suspicious of stealing electricity were denoted as abnormal samples, while the other common users were denoted as normal. There, we had collected the data of 882 normal samples and 47 abnormal samples. As the abnormal users appear as the minority in all of the recorded data, the SMOTE algorithm was used to ease the data imbalance by generating 222 virtual abnormal samples, to make the ratio of the normal over the abnormal at about 3:1.
The TSRNN model was established based on the total of 1,151 user samples over the 820 time-series moments. A basic network was formed with three input nodes for receiving the data in the three variables of ARP, PEA, and SHO, and with one hidden neuron for extracting data features. Then, the network output was computed as a k-means classified result to discriminate the sample as an abnormal one or a normal one. The k-means classifier calculation was on the basis of Mahalanobis distance. As for the successive analysis of the non-stopping input time-series data, the TSRNN structure was re-formed by circulating this kind of basic network. Then, each hidden node was influenced by the input data at the current time moment and the data delivery from the time-former hidden node, and thus, the output results can be optimized by adaptively tuning the network parameters in the combination of linking weights
The experimental results indicated that the proposed adaptive TSRNN architecture in fusion with the SMOTE balancing technique is feasible to extract data features for monitoring the abnormal electricity theft behavior. The methodology framework is prospectively promoted to be used for online monitoring on big data analysis for a large scale of electricity power consumption.
The original contributions presented in the study are included in the article/Supplementary Material, and further inquiries can be directed to the corresponding author.
YL conceptualized the idea and supervised the work. GL and SH performed the methodology. GL and HW visualized the results. HW was involved in formal analysis. SH and ZN investigated the data. ZN validated the data.GL and HF wrote the original draft. HF curated the data and ran the software. XF and SH reviewed and edited the paper. XF obtained the resources.
This research was funded by the project supported by the China Southern Power Grid Corporation (Grant No. GDKJXM20185800).
The author HW was employed by Zhanjiang Power Supply Bureau of Guangdong Power Grid Co., Ltd.
The remaining authors declare that the research was conducted in the absence of any commercial or financial relationships that could be construed as a potential conflict of interest.
All claims expressed in this article are solely those of the authors and do not necessarily represent those of their affiliated organizations, or those of the publisher, the editors, and the reviewers. Any product that may be evaluated in this article, or claim that may be made by its manufacturer, is not guaranteed or endorsed by the publisher.
Ahmad, T., Hasan, D. Q. U., and Zada, S. (2015). Non-Technical Loss Detection, Prevention and Suppression Issues for AMI in Smart Grid. Ijser 6 (3), 217–228. doi:10.14299/ijser.2015.03.001
Al-Dahidi, S., Ayadi, O., Adeeb, J., and Louzazni, M. (2019). Assessment of Artificial Neural Networks Learning Algorithms and Training Datasets for Solar Photovoltaic Power Production Prediction. Front. Energ. Res. 7, 1–18. doi:10.3389/fenrg.2019.00130
Alkinani, H. H., Al-Hameedi, A. T. T., and Dunn-Norman, S. (2021). Data-driven Recurrent Neural Network Model to Predict the Rate of Penetration. Upstream Oil Gas Techn. 7, 100047. doi:10.1016/j.upstre.2021.100047
Aryanezhad, M. (2019). A Novel Approach to Detection and Prevention of Electricity Pilferage over Power Distribution Network. Int. J. Electr. Power Energ. Syst. 111, 191–200. doi:10.1016/j.ijepes.2019.04.005
Avila, N. F., Figueroa, G., and Chu, C.-C. (2018). NTL Detection in Electric Distribution Systems Using the Maximal Overlap Discrete Wavelet-Packet Transform and Random Undersampling Boosting. IEEE Trans. Power Syst. 33, 7171–7180. doi:10.1109/tpwrs.2018.2853162
Cao, M., Zou, J., Wei, L., Zhao, X., Zhang, L., and Li, P. (2018). Detection of Power Theft Behavior of Distribution Network Based on RBF Neural Network. J. Yunnan Univ. Nat. Sci. Ed. 40 (5), 872–878. doi:10.7540/j.ynu.20170426
Chawla, N. V., Bowyer, K. W., Hall, L. O., and Kegelmeyer, W. P. (2002). SMOTE: Synthetic Minority Over-sampling Technique. jair 16, 321–357. doi:10.1613/jair.953
Chen, H., Liu, X., Jia, Z., Liu, Z., Shi, K., and Cai, K. (2018). A Combination Strategy of Random forest and Back Propagation Network for Variable Selection in Spectral Calibration. Chemometrics Intell. Lab. Syst. 182, 101–108. doi:10.1016/j.chemolab.2018.09.002
Chen, W., Chen, H., Feng, Q., Mo, L., and Hong, S. (2021). A Hybrid Optimization Method for Sample Partitioning in Near-Infrared Analysis. Spectrochimica Acta A: Mol. Biomol. Spectrosc. 248, 119182. doi:10.1016/j.saa.2020.119182
Cossu, A., Carta, A., Lomonaco, V., and Bacciu, D. (2021). Continual Learning for Recurrent Neural Networks: An Empirical Evaluation. Neural Networks 143, 607–627. doi:10.1016/j.neunet.2021.07.021
Dileep, G. (2020). A Survey on Smart Grid Technologies and Applications. Renew. Energ. 146, 2589–2625. doi:10.1016/j.renene.2019.08.092
Dou, J., Liu, X., Lu, J., Wu, D., and Wang, X. (2018). Research on Electricity Anti-stealing Method Based on Power Consumption Information Acquisition and Big Data. Elec. Meas. Instrum. 55 (21), 43–49.
Farjaminezhad, R., Safari, S., and Moghadam, A. M. E. (2021). Recurrent Neural Networks Models for Analyzing Single and Multiple Transient Faults in Combinational Circuits. Microelectronics J. 112, 104993. doi:10.1016/j.mejo.2021.104993
Fernández, A., García, S., Herrera, F., and Chawla, N. V. (2018). SMOTE for Learning from Imbalanced Data: Progress and Challenges, Marking the 15-year Anniversary. jair 61, 863–905. doi:10.1613/jair.1.11192
He, H., and Garcia, E. A. (2019). Learning from Imbalanced Data. IEEE Trans. Knowl. Data Eng. 21, 1263–1284. doi:10.1109/tkde.2008.239
Hu, T., Guo, Q., and Sun, H. (2019). Nontechnical Loss Detection Based on Stacked Uncorrelating Autoencoder and Support Vector Machine. Autom. Elec. Power Syst. 43 (1), 119–127. doi:10.7500/AEPS20180630013
Jin, J., Li, M., and Jin, L. (2015). Data Normalization to Accelerate Training for Linear Neural Net to Predict Tropical Cyclone Tracks. Math. Probl. Eng. 2015. doi:10.1155/2015/931629
Jokar, P., Arianpoo, N., and Leung, V. C. M. (2016). Electricity Theft Detection in AMI Using Customers' Consumption Patterns. IEEE Trans. Smart Grid 7, 216–226. doi:10.1109/tsg.2015.2425222
Li, S., Han, Y., Yao, X., Yingchen, S., Wang, J., and Zhao, Q. (2019). Electricity Theft Detection in Power Grids with Deep Learning and Random Forests. J. Electr. Comput. Eng. 2019, 4136874. doi:10.1155/2019/4136874
Li, S., and Yang, Y. (2021). A Recurrent Neural Network Framework with an Adaptive Training Strategy for Long-Time Predictive Modeling of Nonlinear Dynamical Systems. J. Sound Vibration 506, 116167. doi:10.1016/j.jsv.2021.116167
Li, Y., Hao, G., Liu, Y., Yu, Y., Ni, Z., and Zhao, Y. (2021a). Many-objective Distribution Network Reconfiguration via Deep Reinforcement Learning Assisted Optimization Algorithm. IEEE Trans. Power Deliv., 1. doi:10.1109/tpwrd.2021.3107534
Li, Y., Song, W., Peng, F., Ding, N., and Wang, F. (2016). The Intelligent Analysis on the Trend Anomaly of the Electric Energy Meter Based on LOF Algorithm. Elec. Meas. Instrum. 53 (18), 69–73.
Li, Z., Li, Y., Liu, Y., Wang, P., Lu, R., and Gooi, H. B. (2021b). Deep Learning Based Densely Connected Network for Load Forecasting. IEEE Trans. Power Syst. 36, 2829–2840. doi:10.1109/tpwrs.2020.3048359
Liu, L., Finch, A., Utiyama, M., and Sumita, E. (2020). Agreement on Target-Bidirectional Recurrent Neural Networks for Sequence-To-Sequence Learning. jair 67, 581–606. doi:10.1613/jair.1.12008
Mozaffar, M., Paul, A., Al-Bahrani, R., Wolff, S., Choudhary, A., Agrawal, A., et al. (2018). Data-driven Prediction of the High-Dimensional thermal History in Directed Energy Deposition Processes via Recurrent Neural Networks. Manufacturing Lett. 18, 35–39. doi:10.1016/j.mfglet.2018.10.002
Ren, H., Hou, Z. J., Vyakaranam, B., Wang, H., and Etingov, P. (2020). Power System Event Classification and Localization Using a Convolutional Neural Network. Front. Energ. Res. 8, 1–11. doi:10.3389/fenrg.2020.607826
Ståhl, N., Mathiason, G., Falkman, G., and Karlsson, A. (2019). Using Recurrent Neural Networks with Attention for Detecting Problematic Slab Shapes in Steel Rolling. Appl. Math. Model. 70, 365–377. doi:10.1016/j.apm.2019.01.027
Wang, H., Cai, R., Zhou, B., Aziz, S., Qin, B., Voropai, N., et al. (2020). Solar Irradiance Forecasting Based on Direct Explainable Neural Network. Energ. Convers. Manag. 226, 113487. doi:10.1016/j.enconman.2020.113487
Zhang, C., Xiao, X., and Zheng, Z. (2019). Electricity Theft Detection for Customers in Power Utility Based on Real-Valued Deep Belief Network. Power Syst. Techn. 43 (3), 1083–1091.
Zhang, K., Zhou, B., Or, S. W., Li, C., Chung, C. Y., and Voropai, N. I. (2021). Optimal Coordinated Control of Multi-Renewable-To-Hydrogen Production System for Hydrogen Fueling Stations. IEEE Trans. Ind. Applicat., 1. doi:10.1109/TIA.2021.3093841
Zhang, Y., Ai, Q., Wang, H., Li, Z., and Zhou, X. (2020). Energy Theft Detection in an Edge Data center Using Threshold-Based Abnormality Detector. Int. J. Electr. Power Energ. Syst. 121, 106162. doi:10.1016/j.ijepes.2020.106162
Zhu, L., Lu, C., Dong, Z. Y., and Hong, C. (2017). Imbalance Learning Machine-Based Power System Short-Term Voltage Stability Assessment. IEEE Trans. Ind. Inf. 13, 2533–2543. doi:10.1109/tii.2017.2696534
Keywords: electricity theft, TSRNN, adaptive parameter tuning, intelligent learning, SMOTE, power consumption data
Citation: Lin G, Feng H, Feng X, Wen H, Li Y, Hong S and Ni Z (2021) Electricity Theft Detection in Power Consumption Data Based on Adaptive Tuning Recurrent Neural Network. Front. Energy Res. 9:773805. doi: 10.3389/fenrg.2021.773805
Received: 10 September 2021; Accepted: 04 October 2021;
Published: 10 November 2021.
Edited by:
Bin Zhou, Hunan University, ChinaReviewed by:
Huazhou Chen, Guilin University of Technology, ChinaCopyright © 2021 Lin, Feng, Feng, Wen, Li, Hong and Ni. This is an open-access article distributed under the terms of the Creative Commons Attribution License (CC BY). The use, distribution or reproduction in other forums is permitted, provided the original author(s) and the copyright owner(s) are credited and that the original publication in this journal is cited, in accordance with accepted academic practice. No use, distribution or reproduction is permitted which does not comply with these terms.
*Correspondence: Shaoyong Hong, c2h5MjAwMjAyMUAxNjMuY29t
Disclaimer: All claims expressed in this article are solely those of the authors and do not necessarily represent those of their affiliated organizations, or those of the publisher, the editors and the reviewers. Any product that may be evaluated in this article or claim that may be made by its manufacturer is not guaranteed or endorsed by the publisher.
Research integrity at Frontiers
Learn more about the work of our research integrity team to safeguard the quality of each article we publish.