 Mingxing Guo1
 Ciwei Gao
 Tao Chen
94% of researchers rate our articles as excellent or good
Learn more about the work of our research integrity team to safeguard the quality of each article we publish.
Find out more
ORIGINAL RESEARCH article
Front. Energy Res., 26 November 2021
Sec. Electrochemical Energy Storage
Volume 9 - 2021 | https://doi.org/10.3389/fenrg.2021.773149
This article is part of the Research TopicArtificial Intelligence Applications in Low Carbon Renewable Energy and Energy Storage SystemsView all 8 articles
Virtual power plant is an integrated technology and operation mode to realize air-conditioning load participating in power system operation, further benefitting low carbon renewable energy applications. However, the principle of multi-system coupling in central air-conditioning poses a challenge to normal load regulation. Besides, the uncertainties of demand-side resources bring risks to the operation of virtual power plant. In this paper, the regulation characteristics of central air conditioning are obtained by experiment, while the potential of central air conditioning is quantified by a thermodynamic model, further resulting in the central air conditioning could be transformed into a virtual unit model. Then the dynamic capacity optimization strategy is formulated based on the risk measurement theory, while the generation task decomposition strategy is also formulated based on the equal increase rate criterion, thus forming a two-tier operation strategy of virtual power plant. Finally, illustrative case study is constructed to quantitatively analyze the power generation capacity and effectiveness of the virtual power plant. The effectiveness and practicability of the proposed strategy is also verified to benefit low carbon energy applications.
In recent years, the proportion of renewable energy integrated into the power grid has been increasing, and the power load characteristics have been deteriorating. According to statistics, the air conditioning load during the peak load hours in summer has surpassed half of the total network load. This imposes higher requirements on the regulation capacity and operational efficiency of the power system. With the development of smart grid and the improvement of communication technology, demand-side resources can participate in the power system regulation, and virtual power plant (VPP), with reasonable optimization of resource allocation via control, measurement and communication technologies, has a promising future in integrating demand-side resources for low carbon renewable energy applications (Wei et al., 2013) (Pudjianto et al., 2007).
VPP is a special kind of power plant, while like conventional power plants, needs to submit technical parameters and transaction plans to the dispatching agency. Its operation strategy includes optimal dispatching strategy for flexible loads (Haputhanthri et al., 2021) and identification of technical parameters of the power plant (Xi et al., 2021) (Xi et al., 2016). Central air-conditioner (CAC), as the main generation resource of VPP, exposes VPP to risks due to its diversity in regulation methods and uncertainty in regulation potential, resulting in higher requirements for the operation strategy of VPP (Chen et al., 2021) (Yang et al., 2020) (Luo et al., 2020).
Currently, most air conditioning loads are simply regarded as interruptible loads in flexible load optimization scheduling strategies, and the load reduction method for air conditioning clusters based on direct load control is formed through measures such as pre-start, duty-cycling control, and discontinuous operation (Wang et al., 2016) (Zhu et al., 2018) (Wang et al., 2017a). A CAC load reduction model based on temperature adjustment of partial terminal devices is constructed, and a “bottom-up” control method is used to implement the CAC in response to external power signals in Ref. (Qi et al., 2015). The load curtailed by the power users is used as virtual output, and the incentive and price demand response VPP are constructed respectively according to the differences in load response mechanisms in Ref. (Niu et al., 2014). Optimal dispatch under uncertainties is also a typical application of flexible load regulation. Ref. (Fang et al., 2017) establishes a dynamic game model for VPP bidding considering the output fluctuation and the prediction error of VPP. Ref. (Wan et al., 2017) considers the randomness of renewable energy and uses a wheel control Strategy of fixed-frequency air conditioners and a fuzzy optimization strategy for energy storage units to realize the VPP load shaving objective. Risk-constrained optimal optimization is employed to handle the energy management for virtual power plants considering correlated demand response in (Liang et al., 2017). In general, less research has been done on practical VPP operation strategies for the CAC flexible regulation method, so the in-depth modeling and analysis of specific flexible loads based on actual data is necessary.
In this study, the regulation characteristics of CAC refrigeration hosts are obtained experimentally, a practical CAC virtual unit model is established, and a VPP generation task decomposition strategy is proposed, to optimize the scheduling of CAC clusters with the goal of cost minimization.
Risk measurement method is widely used in the risk-benefit analysis (Qian et al., 2017) and optimal scheduling of multiple resources (Wang et al., 2017b) by describing the probability distribution of income. Ref. (Wei et al., 2018) considers the value-at-risk, optimizes the capacity of generation resources in VPPs with the objective of minimizing investment and operating costs, and provides the optimal resource allocation scheme. Currently, multi-resource optimal scheduling based on risk measurement theory mostly aims at risk minimization (Wang et al., 2005) and pursues benefits by reducing risks to a certain level (Wang et al., 2017c). Hence, the model is built on hypotheses about the probability distribution of risk, whereas the actual uncertainties are numerous, leading to the deviation of model from reality.
This paper proposes a dynamic optimizing strategy for VPP capacity based on the risk measurement method, where risks are simulated through historical losses and updated on a rolling basis according to the operating status of VPP, the operating strategy is actively modified and the risk is averted. It not only ensures the external characteristics of VPP but also solves the optimal dispatch of resources, thus providing a theoretical basis for the participation of a large number of scattered flexible loads in the normal operation of the power system.
As a flexible load, CAC has the advantages of large volume, few owners and high controllability (Wang et al., 2016). CAC is used as the resource for VPP, and the power cut by changing its operation is treated as virtual output.
The chilled water, cooling water and air circulation systems of CAC interact in a complex way. The CAC black-box model is established via the black box method and its characteristics can be obtained using an experimental approach (Moness and Diaa-Eldeen, 2017). The chilled water outlet temperature (hereinafter referred to as water temperature) which is easy to achieve regulation in the CAC system is used as the input to the black-box model, and the cooling capacity and power are used as its output. On this basis, the CAC regulation characteristics are analyzed. The black box model is implemented for different types and brands of CACs because the basic principle of CAC is to provide cooling capacity to the room with chilled water. Figure 1 shows the CAC black-box model of the centrifugal chiller. The CAC is composed by major components of fresh air system, surface air cooler, chiller, cooling tower, cooling water pump and chilled water pump. The operation of various components of CAC is carefully designed in terms of the two cyclings of chilled water circulation and cooling water circulation. It is too complicated to model the CAC systems and in our paper the input output relation can be identified by a black-box.
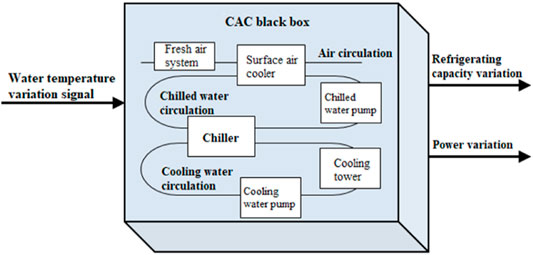
FIGURE 1. Black box model of central air conditioning.
After CAC receives the regulation instruction, the water temperature is adjusted upward, resulting in a decrease in its power and cooling capacity sent to the room. When CAC return air temperature reaches the upper limit, the water temperature is regulated back to the initial value and thus the regulation ends.
In the experiment, the adjustable range of CAC water temperature is 8°C–12°C. A relationship between the water temperature and the steady-state power of the CAC is considered to exist without considering the variation of external factors.
where Tchilled is water temperature, and PT°C is the steady-state power of the CAC when the water temperature is at time T.
Figure 2 is employed to characterize the power consumption behavior of CAC once the Water outlet temperature of chiller is adjusted. This is very important to guide the VPP operation. Since the room temperature is the major concern of the customer, while room temperature depends on how much cold it can get from the cycling water, which can be adjusted by setting the water outlet temperature. Meanwhile the power consumption will be changed as well. Therefore when we operate an VPP composed by many CACs, the temperature constraints will be respected, which could be characterized by Figure 2. The power curve adjusting the water outlet temperature from 8°C to 10°C, which is monitored by the building automation control system. As can be seen from the curve, with the water temperature at time zero being adjusted from 8°C to 10°C, CAC power from the steady-state power P8°C decline instantly, and then back to the steady-state power P10°C. Meanwhile, the return air temperature gradually increases and reaches the upper limit at time t2. The water temperature is adjusted back to 8°C, and the regulation is ended.
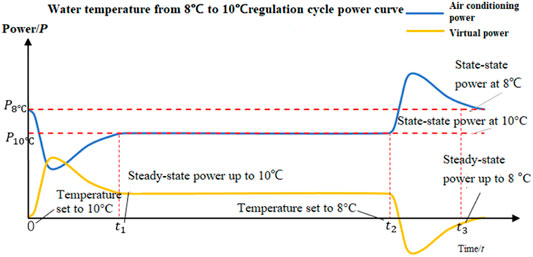
FIGURE 2. Power variation under
The CAC power reduction is calculated according to the definition of power reduction, which is shown in the following formula.
where
In the short time regulation process, the variation of the external environment is not considered. Then the power change curve for upward temperature regulation is considered the same as that for downward temperature regulation, as shown in the following equation.
The power at time t1 reaches the steady-state power at 10°C, then
Substituting Eqs. 4–6 into (Eq. 3), we get
Let t = t3, then the general expressions for the average power reduction of CAC
where
Due to the large number of rooms served by CAC, it is unavailable to measure the temperature of each room. Therefore, this paper builds a model based on the equivalent room and uses the total return air temperature to characterize the equivalent indoor temperature. The CAC receives power regulation instructions from the VPP coordinate control center and converts them into chilled water temperature regulation signals. According to the instructions, the CAC power immediately decreases, and the return air temperature gradually rises, but to ensure human comfort within the environment it should not be excessive.
The time consumed in this process is called the maximum regulation time of the CAC at the corresponding adjusted water temperature. The maximum regulation time is calculated by the thermodynamic model.
1) CAC energy consumption model.
The relationship between CAC refrigerating output Qand average power
where k and b are both constants larger than 0, as determined by the CAC performance.
2) Terminal modeling.
The CAC units in large commercial buildings provide cooling capacity to a large number of rooms with varying room temperatures. Since the total amount of cooling supply decreases and the indoor temperature of each room tends to increase during the air conditioning regulation, the upper bound of the return air temperature is used to characterize that of the regulation time. The description of the temperature and heat variation with time is available in Ref. (Xu et al., 2016). The time-varying expression for the return air temperature is obtained by solving the heat balance equation.
Where T0 is the outdoor temperature and Ti is the equivalent indoor temperature characterized by the total return air temperature. A and B are calculated according to the outdoor temperature, fresh air load, equipment cooling, building envelope and other parameters.
3) Maximum regulation time.
The room model describes the relationship between indoor heat and temperature over a period of time. To meet the requirements of human comfort, the return air temperature during the regulation period shall not exceed its maximum temperatureTimax, i.e. Ti(t)Timax. In this case Eq. 11 can be expressed as
where
Equation 12 calculates the refrigerating output that the CAC needs to provide at different times to ensure human comfort. The longer the time the more the refrigerating output needs to be provided. Timaxcan be used as the limit value, a known quantity, and T (0) is the initial return air temperature, a measured quantity.
Water temperature of CAC generally retains a certain margin for adjustment. Its adjustment degree affects power reduction and regulation time. Let the current water temperature be 8°C, then the average power reduction and regulation time curves are respectively drawn according to Eq. 8 when the water temperature is adjusted to 9–12°C, as shown in Figure 3. The relationship between the average power reduction and the regulation time during the CAC regulation can be obtained by Eqs 9, and 10, and 13.
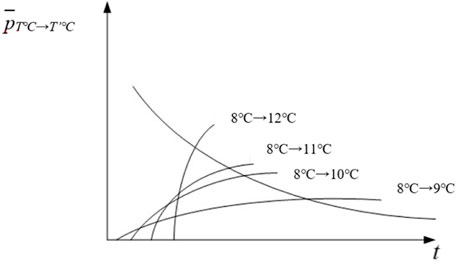
FIGURE 3. Output characteristic points of CAC virtual unit.
Equation 14 describes the power reduction relationship of air conditioning in a certain temperature range, that is, the shorter the regulation time, the greater the power can be reduced in a short time.
The maximum capacity and regulation time at each water temperature can be calculated by coupling Eq. 14 and Eq. 8, the expression of CAC regulation characteristic. They are the four intersection points in Figure 3, which are known as the output characteristic points of the CAC virtual unit.
The characteristic points
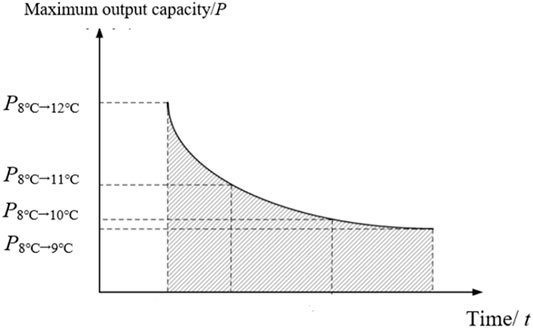
FIGURE 4. Output characteristics of a single central air conditioning virtual unit.
Since the operating status of the air conditioner may change, resulting in the output characteristics not matching the actual one, each air conditioner needs to continuously report its initial status to calculate the output characteristics curve of each virtual unit. In addition, the initial state of CAC (including start-stop state, initial water temperature, indoor temperature, etc.) will change only when an unexpected condition occurs, such as emergency shutdown or abrupt temperature change. Therefore, in this paper, the initial state is updated in a 1-h cycle.
Figure 5 is a schematic diagram of the VPP operation. Virtual power plant is composed by control center which is equipped with a control center and the CACs, the distributed resources of end users. The information collected by the control center is the status of each CACs, including the power and the associated potential of regulation according to the temperature limit, which is usually characterized by the change of power and the during time. Meanwhile, the control center will receive information from the power market and make strategic decsion for market bidding. Once the offer is accepted, the control center needs to assign the generation tasks to each CAC to satisfy its commitment of offering. Specifically, each CAC virtual unit first uploads its operation status to the coordinated control center. Then, the coordinated control center calculates the dynamic capacity parameters of the VPP and decomposes the generation tasks to each CAC virtual unit after determining them from the power market. In this paper, the operation strategy is formulated from the perspective of VPP, and the targets of strategy optimization can be divided into two levels, namely, maximizing power generation benefits and minimizing its costs.
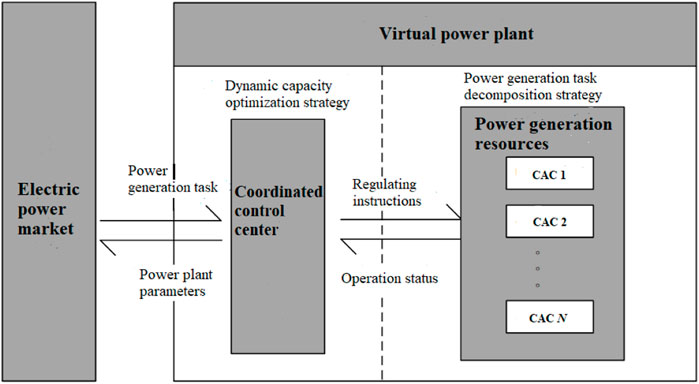
FIGURE 5. Schematic diagram of VPP operation.
Maximizing power generation benefits means that the uncertainty of CAC resources should be considered, and the power generation capacity should be fully exploited by formulating dynamic capacity parameters for the VPP. Meanwhile, the generation tasks should be reasonably decomposed according to the characteristics of each virtual unit to minimize the power generation cost. In this paper, a VPP optimal operating model is established based on the power output characteristics of a single virtual unit.
The capacity of a virtual power plant characterizes its production capacity and needs to be matched to the actual generation capacity of the VPP. Dynamic capacity optimization means that in the real environment, the VPP capacity values are adjusted according to the risk dynamics so that the economic performance of the VPP is optimized. Due to many uncertainties in the real environment, such as the reduction in the number of air-conditioning virtual units, sudden changes in outdoor temperature, and actual output not matching expectations, the VPP is penalized for failing to complete its generation tasks. In this study, the uncertainty factors are described using randomly distributed parameters, i.e., the number of air conditioning virtual units N, the outdoor temperature Tout, and the actual output
where
In this study, a CVaR risk measurement method is adopted to calculate the VPP profit at risk and to avert the risk by dynamically optimizing the VPP capacity. CVaR is the conditional mean at a given level of risk, where the loss of the decision is greater than the conditional mean of a given VaR value. It reflects the average level of excess losses. The CVaR risk measurement method avoids the requirement that risk must satisfy a normal distribution, and provides a more sufficient measurement for tail loss (Xiao, 2016). The mathematical expression is given below.
where
The calculations are simplified by constructing auxiliary functions and the loss expectation is simulated using the scenario analysis method (Rockfellar, 2010).
where
The CVaR risk measurement method avoids the assumption of the risk probability distribution by simulating loss expectations with historical losses, and achieves the risk value assessment with the current decision. When the above model is applied to describe the risk in VPP operation, the decision variable is taken as the VPP capacity P, i.e., the sum of each virtual unit capacity, as shown in Eq. 21.
The loss prediction function is the loss caused by the real-time electricity price that the VPP must bear because of its uncertainty of insufficient power output, which is written as follows.
where k is the difference between real-time electricity prices and on-grid electricity prices in the spot market.
The profit at risk R of VPP is defined using the linear weighted method, which is expressed as follows.
where
The dynamic optimizing strategy for VPP capacity identifies the risks of VPP operation using risk measurement method, and dynamically adjusts its capacity parameters based on risk preferences so that the risks can be avoided and the economics can be optimized.
The VPP has a large number of virtual generating units with different characteristics, and the generation task is decomposed to each virtual unit and the generation cost is minimized. The power generation cost for the VPP is the call compensation to the customers, and the compensation price is usually a primary function of power (Fan et al., 2015), so the total compensation
In this case, the objective function is the minimum value of the total generation cost.
After the CAC virtual unit receives the power output instruction, the power in one regulation cycle is constrained by the output characteristics of VPP in Eq. 14. Therefore, the constraint of virtual unit power is as follows.
where T is the power output time of the virtual unit and gi(T) is the fitting function of its output characteristics. The equation describes the relationship between the power Pi,t and the output time T of the virtual unit.
For the generation task required to be completed P, the generation constraint is shown in Eq. 27.
The constraint on the power limit is given in Eq. 28
The optimization model of the power generation task decomposition strategy is established through Eqs 24–28. From the equal incremental rate principle, we get that the generation cost is minimized when
All the above mentioned are the guidelines for power generation tasks allocation under a section at a certain moment. In actual operation, due to the constraints of the output characteristics, the air conditioning virtual unit is still in the output state at time t and unable to receive the regulation instruction. At this time, the air conditioning virtual units are divided into the output-occupied virtual unit group Ooccupied and the output-available virtual unit group Oavailable. The vacant power generation task Pvacant is given as
Therefore, at this time, the vacant power generation tasks Pvacant should be dispatched to the available virtual unit group Oavailable according to the equal incremental rate principle.
The power generation task decomposition strategy integrates characteristics between the power output and cost of the virtual units and decomposes the power generation task to each virtual unit to minimize the cost of power generation. The relationship between the active power and the cost of VPP generation can be obtained using this operating strategy. Combined with the dynamic capacity parameters of VPP, its external characteristics are identical to those of a conventional plant and can be easily dispatched by the system.
The algorithm flow chart of the operation strategy considering resource uncertainty and economy of the VPP is shown in Figure 6, and its operation process is as follows.
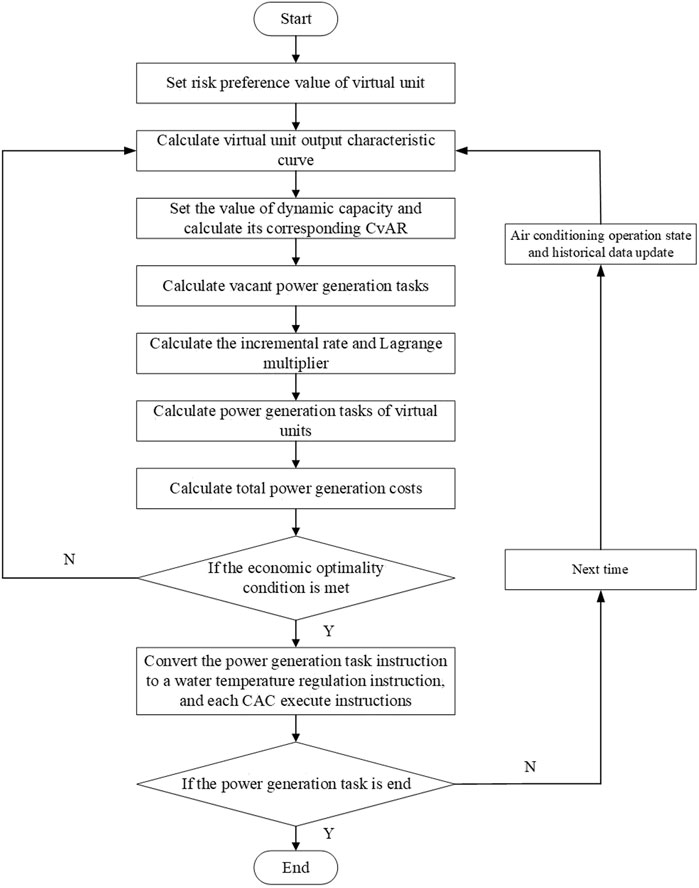
FIGURE 6. Algorithm flow chart of VPP operation strategy.
1) Determination for the dynamic capacity of VPP.
The risk level of VPP β is set according to the risk preference of the VPP operator, its CVAR value at risk is calculated based on historical operating data, and the current dynamic capacity P is determined by solving the optimization problem of (Eq. 23).
2) Analysis of CAC state and calculate vacant power generation tasks.
State quantities such as the current outdoor temperature Tout and the COP of each air conditioner are collected, the output characteristics of each CAC virtual unit shown in Eq. 14 are calculated and grouped according to their current state, and the vacant power generation task Pvacant is calculated according to Eq. 29.
3) Decomposition of power generation tasks based on incremental rate and Lagrange multiplier.
The incremental rate λ and the Lagrange multiplier γ are calculated according to the equal incremental rate principle, the vacant power generation task Pvacant is decomposed to each unit, and the generation task orders are transformed into water temperature adjustment orders combined with the output characteristics of the virtual units.
4) Calculate the overall cost and check the convergence criteria, it is not met, the dynamic capacity should be calculate again by solve the optimization problem of Eq. 23 with the new input.
5) If the convergence criteria is met, the power generation task will be assgined to each CAC by water temperature regulation instruction.
In this study, the basic data is obtained from measured data of a commercial building in Shanghai, and the centrifugal chiller CAC is used for the experiment. The relationship between water temperature and steady-state power and COP is presented in Table 1. The thermal resistance of the room model R = 0.02°C/kW, the heat capacity C = 2 kWh/°C, the outdoor temperature is 40°C, the initial room temperature is 24°C, the maximum allowed temperature is 26°C, and the heat emitted by the human body and other equipment in the room
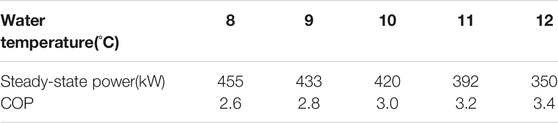
TABLE 1. Chilled water temperature and steady-state power of CAC.
The output characteristics of the CAC virtual unit were analyzed at an initial water temperature of 8°C. Figure 5 presents the power and return air temperature when the water temperature is adjusted to 9°C and 12°C.
As shown in Figure 7, when the water temperature is adjusted from 8°C to 9°C, the regulation time is 39.46 min; when it is adjusted from 8°C to 12°C, the regulation time is only 12.48 min. This reveals that the greater the water temperature adjustment, the greater the decrease of CAC power, and the shorter the time required to reach the upper-temperature limit when the water temperature rises rapidly. Figure 6 shows that the CAC low power operation in a short time can be achieved by changing the water temperature under the premise of ensuring the return air temperature. The power output characteristic points of the virtual unit are listed in Table 2. From the table, it indicates the larger the water temperature adjustment, the larger the average power reduction, but the power output time becomes smaller due to the constraints of the return air temperature.
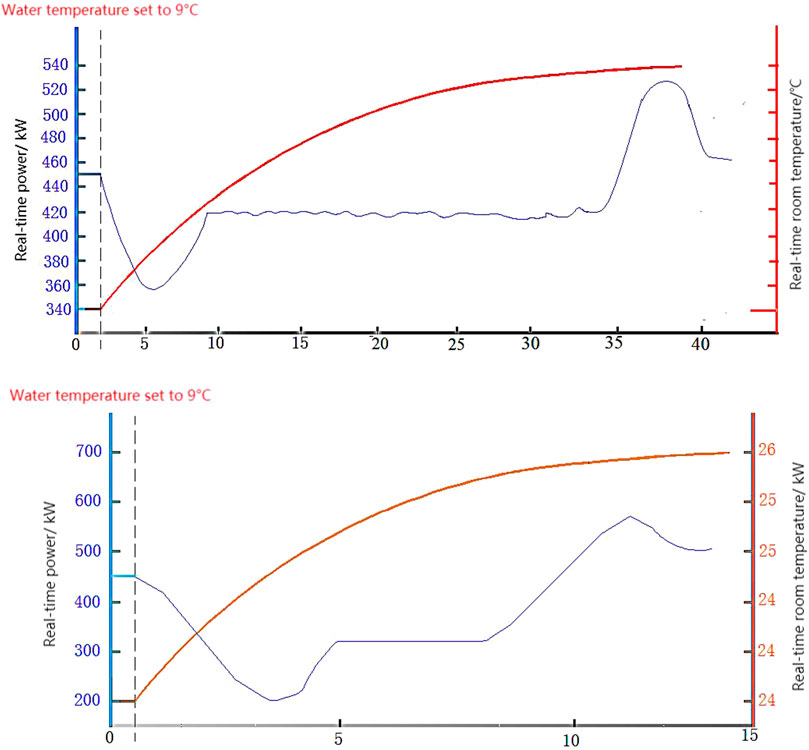
FIGURE 7. Power and return air temperature under Tchilled going to 9°C and 12°C.

TABLE 2. The output characteristic points of virtual unit.
The total output characteristic curves shown in Figure 8 are obtained by integrating 1000 CAC virtual units with different output characteristics into a VPP and superimposing their output characteristic curves.
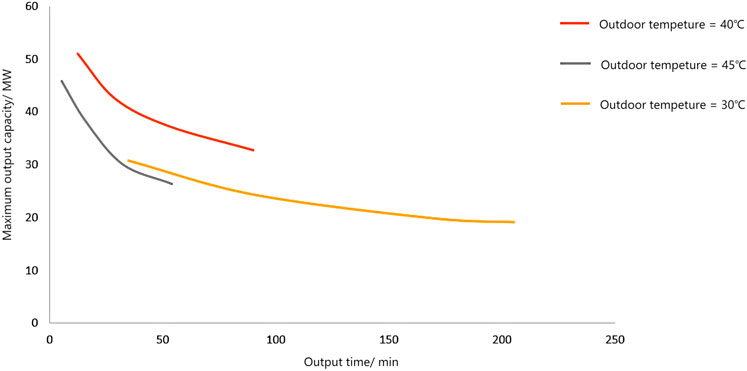
FIGURE 8. Total output characteristics of VPP under different outdoor temperatures.
Figure 8 shows the output characteristics when the outdoor temperature is 40°C, 45°C and 30°C respectively. The calculation results show that the output characteristics at outdoor temperatures of 45°C and 30°C are inferior to those at 40°C. This indicates that when the outdoor temperature is too high, the power and output time of the virtual units are affected to ensure indoor comfort; When the outdoor temperature is too low, the CAC has less power to decrease due to its low power operation, but it maintains long-term power output.
As shown in Figure 8, the maximum capacity of the VPP is ideally about 51 MW when the outdoor temperature is 40°C. However, many uncertainties of the VPP lead to risks in the actual operation. The case study introduces the main uncertainties of VPP using the scenario technique and makes the operation strategy via the proposed method to avoid the risks.
The number of virtual units in the operation state N ∼ B (500, 0.95) is defined to describe the situation where the CAC customers reject the regulation. The actual outdoor temperature Tout ∼ N (40,1) is defined to depict the prediction error of the outdoor temperature. The actual output of the virtual units
The on-grid price p = 350 yuan/MW∙ h, and the difference between the real-time spot market price and the on-grid price k = 100 yuan/MW∙ h. The call compensation for consumers is calculated according to Eq. 24, where the compensation coefficient is shown in Supplementary Appendix S1B. The risk preference value β is the weight of the risk value in the risk-benefit. Β = 1 represents the VPP decision-maker refusing to take all risks, and β = 0 represents the willingness to take any risks for the pursuit of high profits. In this paper, β = 0.05 (risk-avoiding strategy) and β = 0.01 (risk-seeking strategy) are taken for comparison and analysis, the maximum capacity of 51 MW in an ideal situation is taken as the initial value, and the dynamic capacity optimization strategy is applied for simulation. The dynamic capacity of the VPP is simulated in 1 hour, and the output characteristics of each VPP are assumed to be unchanged during this time. The results are shown in Figure 9.
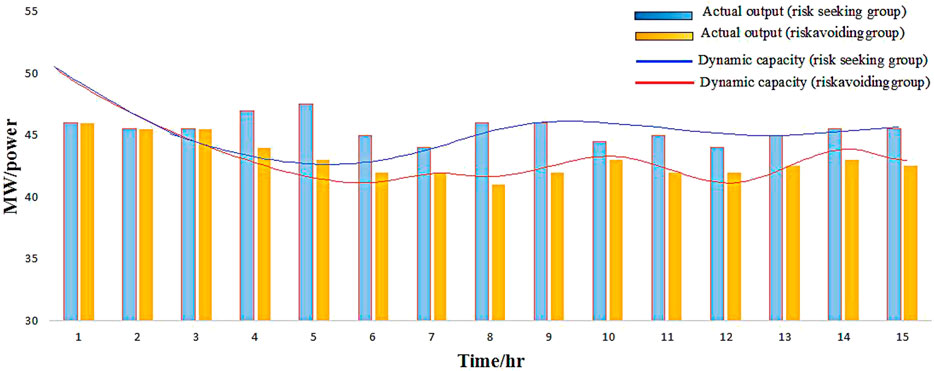
FIGURE 9. Dynamic capacity of VPP.
The following conclusions can be drawn from the dynamic capacity results.
1) From the data at times one to three, it demonstrates the actual output of VPP is unable to reach the maximum capacity of 51 MW in the ideal case due to the uncertainties. Therefore, the VPP capacity is continuously corrected until it matches the actual output, so the curves all tend to decrease at the beginning.
2) For fixed uncertainties, the dynamic capacity of VPP tends to be constant (about 41 MW for risk-avoiding strategy and about 46 MW for risk-seeking strategy). The dynamic capacity is affected by complex uncertainties in actual operation.
3) Due to lower risk preferences, a more conservative strategy is adopted and lower capacity is selected, which allows the VPP resources to meet the power generation tasks. In contrast, when the risk-seeking strategy is adopted, the dynamic capacity of the VPP is high to pursue high profits. However, due to the uncertainties, the actual output of VPP fails to reach its capacity when the total callable generation amount is not sufficient (in the case of 7,10,12), thus incurring losses. It also shows that the existing generation resources of VPP are not sufficient to maintain the continuous operation of the high capacity (about 46 MW).
To better understand the ability of the VPP in actively modifying its operation strategy and avoiding risks according to the risk magnitude, let the external environment change abruptly from 16:00, and then the VPP faces the following high-risk scenarios.
The comparison between the two risk scenarios shows that the VPP generation capacity is affected in the high-risk scenario and the fluctuation of the actual output increases. The results indicate that the VPP can actively adjust the dynamic capacity downward according to the risk magnitude for risk aversion, and that the adoption of the risk-seeking strategy leads to a greater output vacancy of the VPP at times 20, 25 and 28, as shown in Figure 10. Therefore, the risk-seeking strategy is inappropriate at high risk.
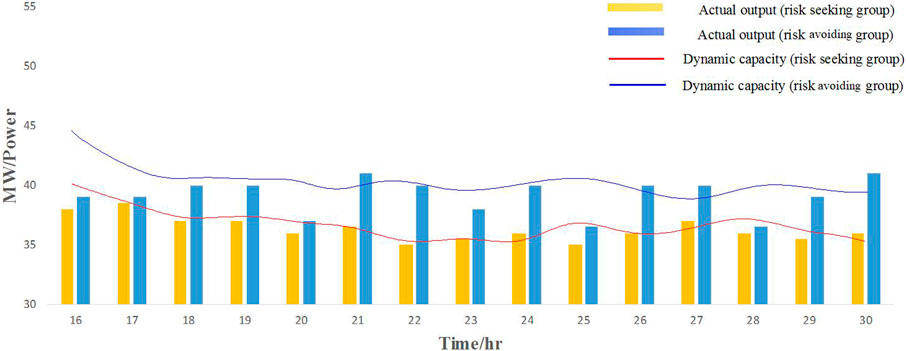
FIGURE 10. Dynamic capacity of VPP at high risk.
Equation 30 is the CAC resource utilization rate η.
Figure 11 shows the utilization rate of CAC in each time period under different risk preferences. It shows the actual output is insufficient for capacity in time periods one to three, and the VPP calls a large number of CACs, so the air conditioner utilization is high in the initial period; after the capacity is gradually adjusted, the number of called CACs decreases, so the curve shows a decrease. The utilization rate is also impacted after the dynamic capacity is adjusted downward by VPP for risk aversion. A comparison of the two curves shows that greater generation capacity is pursued using a risk-seeking strategy, and therefore a relatively higher utilization of resources is required.
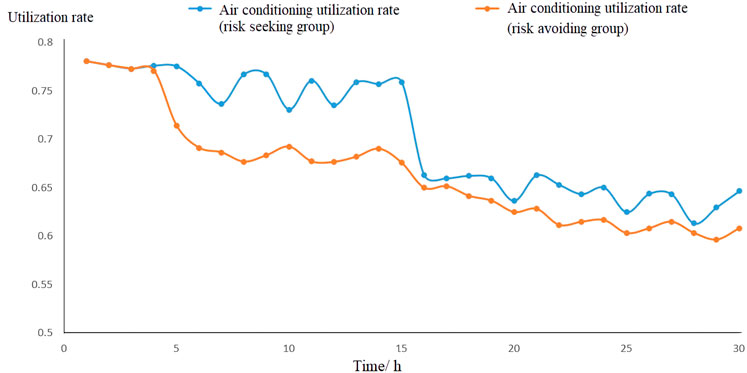
FIGURE 11. Utilization rate of central air conditioning of different risk preference.
The relationship between power generation cost and output power of VPP shown in Figure 12 can be established by the generation task decomposition strategy. The minimum output power of CAC virtual units exists, and the power generation cost of VPP is constant when the output power of VPP is less than the sum of the minimum output power of each virtual unit. In addition, the figure shows that under the current uncertainties, the VPP has a limit to its generation capacity (about 45 MW), and the cost of purchasing power from the market rises rapidly when the uncertainties exceed this limit.
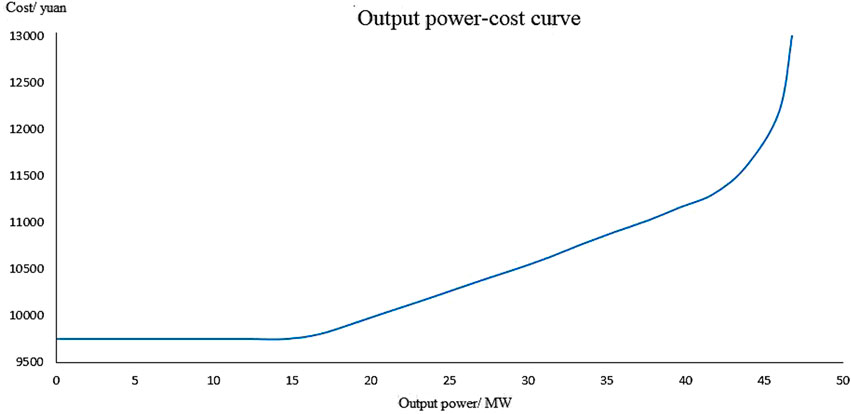
FIGURE 12. Output power-cost curve for VPPs.
VPP is an integrated technology and plays a vital role in the low carbon renewable energy applications. This paper proposes a hybrid artificial intelligence strategy to address the operational problem of VPPs containing numerous distributed CAC resources. Specifically, the CAC regulation characteristics are obtained and the CAC is converted into a virtual unit model through experiments, an optimal operation strategy is then formulated for VPPs with reference to the risk measurement theory and the well-known equal incremental rate principle. The following conclusions are obtained through the illustrative results of the numerical example.
1) The output characteristic of a single CAC virtual unit is that the regulation capacity decreases as the regulation time increases. It is also affected by the outdoor temperature; either too high or too low outdoor temperature can reduce the regulation capacity.
2) Due to uncertainties, VPPs need to measure risks and adjust capacity in real time. Simulation results show that the decision makers of VPPs are capable of developing risk-seeking or risk-avoiding strategies by adjusting risk preference. This can effectively avoid the risk caused by the uncertainties of resources and maximize the benefits of VPPs.
3) The minimization of generation costs can be achieved using the generation task decomposition strategy. The cost characteristic curve of the VPP, similar to the consumption characteristic curve of the traditional power plant, is obtained through simulation, facilitating the participation of the VPP in the normal operation of the power system.
The proposed method could well promote VPP in low carbon applications. On the basis of this study, in the electricity market environment, our future work focuses on investigating the VPP bidding competition model that contains multiple VPPs and traditional power plants, as well as the operation strategy influenced by the uncertainties of CAC resources themselves and the electricity market.
The original contributions presented in the study are included in the article/Supplementary Material, further inquiries can be directed to the corresponding author.
MG and CG contributed to conception and design of the study. XG, JY, and TC performed the statistical analysis. MG wrote the first draft of the manuscript. XG, JY, and TC wrote sections of the manuscript. All authors contributed to manuscript revision, read, and approved the submitted version.
The paper is supported by the state grid company of China project (52090R200005). The key technologies’ research and application for aggregation control of virtual power plants in urban public buildings.
MG and JY were employed by State Grid Shanghai Municipal Electric Power Company
The remaining authors declare that the research was conducted in the absence of any commercial or financial relationships that could be construed as a potential conflict of interest.
All claims expressed in this article are solely those of the authors and do not necessarily represent those of their affiliated organizations, or those of the publisher, the editors and the reviewers. Any product that may be evaluated in this article, or claim that may be made by its manufacturer, is not guaranteed or endorsed by the publisher.
The Supplementary Material for this article can be found online at: https://www.frontiersin.org/articles/10.3389/fenrg.2021.773149/full#supplementary-material
Chen, T., Cui, Q., Gao, C., Hu, Q., Lai, K., Yang, J., et al. (2021). “Optimal demand response strategy of commercial building‐based virtual power plant using reinforcement learning,” IET Generation. UK: Transmission & Distribution.
Fan, S. L., Ai, Q., and He, X. (2015). Risk Analysis on Dispatch of Virtual Power Plant Based on Chance Constrained Programming. Proc. CSEE 35 (16), 4025–4034.
Fang, Y. Q., Gan, L., Ai, Q., and Fan, S. L. (2017). Stackelberg Game Based Bi-level Bidding Strategy for Virtual Power Plant. Automation Electric Power Syst. 41 (14), 61–69.
Haputhanthri, D., De Silva, D., Sierla, S., Alahakoon, D., Nawaratne, R., Jennings, A., et al. (2021). Solar Irradiance Nowcasting for Virtual Power Plants Using Multimodal Long Short-Term Memory Networks. Front. Energ. Res., 469. doi:10.3389/fenrg.2021.722212
Liang, Z., Alsafasfeh, Q., Jin, T., Pourbabak, H., and Su, W. (2017). Risk-constrained Optimal energy management for virtual power plants considering correlated demand response. IEEE Trans. Smart Grid 10 (2), 1577–1587.
Luo, F., Yang, X., and Wei, W. (2020). Bi-Level Load Peak Shifting and Valley Filling Dispatch Model of Distribution Systems With Virtual Power Plants. Front. Energ. Res. 8. doi:10.3389/fenrg.2020.596817
Moness, M., and Diaa-Eldeen, T. (2017). Experimental black-box dynamic modelling of a Flexible Manoeuvring System. Int. Conf. Comp. Eng. Syst., 19–20. Cairo, Egypt:7p. doi:10.1109/icces.2017.8275315
Niu, Y. J., Li, Y., and Wang, B. B. (2014). Demand Response Based Virtual Power Plant Modeling Considering Uncertainty. Proc. CSEE 34 (22), 3630–3637.
Pudjianto, D., Ramsay, C., and Strbac, G. (2007). Virtual power plant and system integration of distributed energy resources. IET Renew. Power Gener. 1 (1), 10–16. doi:10.1049/iet-rpg:20060023
Qi, Y. B., Wang, D., and Jia, H. J. (2015). Demand Response Control Strategy for Central Air-conditioner Based on Temperature Adjustment of Partial Terminal Devices. Automation Electric Power Syst. 39 (17), 82–88.
Qian, Y. F., Xu, J., and Wei, W. C. “Purchasing Strategy of Electric Energy Metering Devices: A CVaR-based Study,” International Conference On Service Systems and Service Management. Dalian, China: IEEE, 4p. June 16-18, 2017.
Wan, L., Yang, G. L., and Chen, X. F. (2017). Coordinated Control Method of Multisource and Multiload Based on the Concept of Demand Response. J. Shenyang Ligong Univ. 36 (2), 22–28.
Wang, B. B., Zhu, F., and Ji, W. L. (2016). Load Cutting Potential Modeling of Central Air-conditioning and Analysis on Influencing Factors. Automation Electric Power Syst. 40 (19), 44–52.
Wang, H. B., Wang, J., and Wang, C. M. (2017). Risk-constrained Energy Management Modeling of Virtual Power Plant. Proc. CSEE 37 (20), 5942–5950.
Wang, R., Shang, J. C., and Feng, Y. (2005). Combined Bidding Strategy and Model for Power Suppliers Based on CVaR Risk Measurement Techniques. Automation Electric Power Syst. 29 (14), 5–9.
Wang, Y., Shi, Z., and Wang, Z. (2017). Dynamic scheduling Optimization model for virtual power plant connecting with wind-photovoltaic-energy storage system. Energy Internet Energ. Syst. Integration. IEEE, November, 26–28.
Wang, Z. C., Xin, J. Q., and Guan, G. B. (2017). Cost-Saving Operation Scheme of Central Air Conditioner and its Applicability. Electric Power Automation Equipment 37 (3), 126–131.
Wei, Z. N., Chen, Y., and Huang, Y. J. (2018). Optimal Allocation Model for Multi-energy Capacity of Virtual Power Plant Considering Conditional Value-at-risk. Automation Electric Power Syst. 42 (4), 39–46.
Wei, Z. N., Yu, S., and Sun, G. Q. (2013). Concept and Development of Virtual Power Plant. Automation Electric Power Syst. 37 (13), 1–9.
Xi, L., Wu, J., Xu, Y., and Sun, H. (2021). Automatic generation control based on multiple neural networks with actor-critic strategy. IEEE Trans. Neural Netw. Learn. Syst. 32 (6), 2483–2493. doi:10.1109/tnnls.2020.3006080
Xi, L., Zhang, Z., Yang, B., Huang, L., and Yu, T. (2016). Wolf pack hunting strategy for automatic generation control of an islanding smart distribution network. Energ. Convers. Manag. 122, 10–24. doi:10.1016/j.enconman.2016.05.039
Xiao, J. S. (2016). Study of CVaR Risk Measurement and its Application in Portfolio Optimization. Uk: Central South University.
Xu, Q. S., Yang, C. X., and Yan, Q. G. (2016). Strategy of Day-Ahead Power Peak Load Shedding Considering Thermal Equilibrium Inertia of Large-Scale Air Conditioning Loads. Power Syst. Tech. 40 (1), 156–163.
Yang, J., Lin, G., Lv, R., Gao, C., and Chen, T. “Research on Construction and Dispatching of Virtual Power Plant Based on Reserve Energy Storage of Communication Base Station. New York: 2020 IEEE 4th Conference on Energy Internet and Energy System Integration (EI2), 398–403.
Zhang, Q. (2016). Research on the Control Method of Energy-saving Operation of CAC System. Uk: Southeast University.
Keywords: central air conditioning, virtual power plant, dynamic capacity, demand side management, risk managemenent
Citation: Guo M, Guo X, Yang J, Gao C and Chen T (2021) Operation Strategy of Central Air Conditioning Virtual Power Plant Based on Risk Measurement Method. Front. Energy Res. 9:773149. doi: 10.3389/fenrg.2021.773149
Received: 09 September 2021; Accepted: 22 October 2021;
Published: 26 November 2021.
Edited by:
Kailong Liu, University of Warwick, United KingdomReviewed by:
Yunwei Shen, Shanghai University of Electric Power, ChinaCopyright © 2021 Guo, Guo, Yang, Gao and Chen. This is an open-access article distributed under the terms of the Creative Commons Attribution License (CC BY). The use, distribution or reproduction in other forums is permitted, provided the original author(s) and the copyright owner(s) are credited and that the original publication in this journal is cited, in accordance with accepted academic practice. No use, distribution or reproduction is permitted which does not comply with these terms.
*Correspondence: Ciwei Gao, Y2l3ZWkuZ2FvQHNldS5lZHUuY24=
Disclaimer: All claims expressed in this article are solely those of the authors and do not necessarily represent those of their affiliated organizations, or those of the publisher, the editors and the reviewers. Any product that may be evaluated in this article or claim that may be made by its manufacturer is not guaranteed or endorsed by the publisher.
Research integrity at Frontiers
Learn more about the work of our research integrity team to safeguard the quality of each article we publish.