 Nianchun Du
 Fei Tang
 Qingfen Liao1
 Chenxu Wang
95% of researchers rate our articles as excellent or good
Learn more about the work of our research integrity team to safeguard the quality of each article we publish.
Find out more
ORIGINAL RESEARCH article
Front. Energy Res. , 25 November 2021
Sec. Smart Grids
Volume 9 - 2021 | https://doi.org/10.3389/fenrg.2021.767610
This article is part of the Research Topic Advanced Anomaly Detection Technologies and Applications in Energy Systems View all 64 articles
Under the background of clean and low-carbon energy transformation, renewable distributed generation is connected to the distribution system on a large scale. This study proposes a probabilistic assessment method of hosting capacity considering wind–photovoltaic–load temporal characteristics in distribution networks. First, based on time series of wind, photovoltaic, and load demands, a discretization–aggregation technique is introduced to generate and filter extreme combinations. The method can effectively reduce the scenarios that need to be evaluated. Then a holomorphic embedding method considering generation and load scaling directions is proposed. The holomorphic function of voltage about an embedding variable is established, and it is analytically expanded in the form of series. The hosting capacity restrained by the voltage violation problem is calculated quickly and accurately. Finally, the proposed stochastic framework is implemented to evaluate hosting capacity involving renewable energy types, penetration levels, and locations. The hosting capacity of single energy and hybrid wind–solar renewable energy systems is evaluated from the perspective of probability analysis. The results verify the outstanding performance of the hybrid wind–solar energy system in improving the hosting capacity.
In response to climatic deterioration and energy shortage, all countries are accelerating the process of new energy. Distributed renewable energy sources have become the mainstay to promote the development of new energy with the advantages of being clean, green, flexible, and efficient (IEA, 2019). Wind energy and solar energy are the most promising renewable energy sources. However, their access to the distribution network also brings uncertainty and intermittence. The booming development of distributed generation (DG) may lead to the violation of system operation constraints such as overvoltage (Ismael et al., 2019; Zhu et al., 2020), overloading of transformers and feeders (Shen et al., 2021), conductor thermal capacity (Zhang and Luo, 2018), and protection failure (Singh, 2017; Zobaa et al., 2020). In order to overcome the challenges of renewable energy source integration, it is of significant importance to evaluate the number of DGs that can be integrated into a given distribution network without violating the operating standards.
The concept of hosting capacity (HC) was first proposed by André Even in the context of distributed generation and improved by Bollen and Hassan (2011). The hosting capacity is defined as the maximum capacity of DGs that can be integrated into the distribution system, above which the performance of the system becomes unacceptable. Recently, many scholars have studied hosting capacity assessment in distribution networks. There are four main methods: the deterministic method, the stochastic method (Yang et al., 2019), the optimization-based method (Shen et al., 2017; Injeti and Thunuguntla, 2020), and the time series method (Abideen et al., 2020; Mulenga et al., 2020).
In earlier studies, the analysis methods were often used to calculate the HC at a specific DG access location by deriving the performance index of the system. In the study of Fan et al. (2017) and Li et al. (2021), the formula of voltage difference values at continuous buses of three-phase feeders is derived, and the maximum number of DGs at a specific bus is calculated. Ampofo et al. (2017) studied the impact of voltage rise and thermal loading on HC considering DG access to the end of feeders or the load center. HC is calculated in different scenarios by iteratively increasing the number/capacity of wind generation units and continuously calculating the power flow (PF) until one of the performance standards is violated (Papaioannou and Purvins, 2014; Gonzaga et al., 2019). It is evident that the deterministic method cannot consider the uncertainty of modern power systems, and its application range is limited.
When DGs with high uncertainty characteristics are connected to the distribution network, there are many unknown variables in the calculation of HC. Thus, the randomness of these variables needs to be considered; Monte Carlo simulation (MCS) is often used to generate different scenarios. Zio et al. (2015) proposed a probabilistic power flow method and simulated the variability of customer demand based on MCS but did not consider the variability of DG. The randomness of both DG access locations and load demand are considered (Kolenc et al., 2015; Shen and Raksincharoensak, 2021). In Al-Saffar et al. (2019), the probabilistic power flow is implemented under the scenarios with different photovoltaic (PV) penetration levels, and the HC of three real regions is determined, respectively. Mulenga et al. (2021) classify two types of uncertainties, namely, aleatory uncertainties and epistemic uncertainties. The HC is estimated by applying the transfer impedance matrix and the superposition principle to determine the voltage rise due to PV. In addition, using spatial and temporal uncertainties associated with PV, a new spatiotemporal probabilistic voltage sensitivity is proposed. It can calculate the probability distribution of voltage change at a specific bus, due to random change of PV power in the random position of the network (Munikoti et al., 2022).
The optimization-based method is also a common approach to determine the HC. The objective is to maximize the DG injection while constraints are met. In the study of Zou et al. (2016), Alturki et al. (2018), and Shen et al. (2020), based on deterministic optimization algorithms, the best access location is regarded as the main solution. But in fact, the inherent uncertainty of DG needs to be considered. Therefore, the trend is combining the stochastic method and the optimization-based method (Shen et al., 2021). A stochastic multi-objective optimization model was proposed in the study by Rabiee et al. (2017), which aims to maximize the HC for wind power and minimize the energy procurement costs, and then it is solved with the NSGA-II algorithm. Otherwise, the chance-constrained method was adopted, and the probabilistic power flow method was used to deal with the randomness problem (Sun et al., 2018; Wu et al., 2019). However, the optimization-based model is generally highly complex and non-linear, and for actual networks, the existing methods may not produce global optimal solutions.
Besides, in some studies (Khoshkbar-Sadigh et al., 2015; Fan et al., 2016; Shen and Raksincharoensak, 2021), the historical data of both demand and renewable production are used as the input, and it can provide a more realistic distribution network. Chen et al. (2018) considered temporal characteristics of wind power, PV, and load; the joint probability distribution method and the scene reduction technique were used to solve the DG capacity. Mulenga et al. (2021) studied the influence of time of day on the HC calculation results. However, the time series method considering time-varying renewables and demands are highly dependent on data, and a large amount of data enlarge the computing scale, which tends to be laborious or intractable. Some scholars study the security-constrained unit commitment (SCUC) (Yang et al., 2018; Liu et al., 2020; Yang et al., 2021). Yang et al., 2021 is a pioneer study for SCUC problems that proposes an expanded sequence-to-sequence (E-Seq2Seq)–based data-driven SCUC expert system. It can accommodate the mapping samples of SCUC and consider the various input factors that affect SCUC decision-making, possessing strong generality, high solution accuracy, and efficiency over traditional methods. To mitigate the excessive computational burden, Ochoa et al. (2010) proposed a processing technique for long-term time data, namely, the discretization–aggregation method. It can generate and screen out the reasonable combinations of renewables and demand to simplify data.
When excessive DG penetrates in the distribution network, the radial distribution system with the single power becomes a complex system with multiple power supplies. Then there are reverse power flows, which may lead to voltage rise (Mulenga et al., 2020; Shen et al., 2020; Wang et al., 2021). The studies have shown that the voltage rise is the main restriction considered in the research of HC (Torquato et al., 2018; Dong et al., 2019).
In this study, a stochastic framework of hosting capacity assessment is proposed considering the uncertainty of DG penetration levels, locations, and types, and extreme combinations are introduced to process wind–photovoltaic–load time series data. This effectively reduces the number of scenarios to be evaluated. Moreover, traditional methods of hosting capacity assessment are scenario-based and complex as they rely on the iterative PF algorithm. To avoid a large number of PF calculations, a novel holomorphic embedding method (HEM) based on the recursive algorithm is used to obtain the equivalent analytical formula of voltage (Trias. 2012). The HC corresponding to voltage violation can be directly solved without checking a large number of scenarios, which further significantly reduces the computational burden. In the simulation analysis, hosting capacity assessments of both single resource and hybrid cases are performed, and the results provide planners with a better understanding of the energy integration.
The rest of this article is organized as follows: Processing of Renewables and Demand Data discusses the processing technology of time series data of renewables and demand. Holomorphic Embedding Method introduces the holomorphic embedding method. Then the stochastic framework of the hosting capacity assessment is illustrated in Framework for Hosting Capacity Assessment. Numerical Results presents the results and discussions to evaluate the hosting capacity of single and hybrid cases on the IEEE 33-bus system. Finally, Conclusion summarizes the main conclusions.
Due to the uncertainty and volatility of renewable generation and load, the temporal characteristics of both generation and load demand need to be considered in the hosting capacity assessment. However, long time series will bring a significant number of calculations. Therefore, the discretization–aggregation method is introduced to reduce the computational burden. The technology was first proposed by Ochoa et al. (2010), which only considers wind and load. Furthermore, if we consider the correlation between wind power, PV power, load demand, and time, each data point needs a multidimensional representation. The method has the potential to deal with the problems of multidimensionality.
The method mainly includes two steps: 1) in the discretization process, the historical data of renewables and demand are allocated into a series of bins covering the range between zero and the peak value; and 2) in the aggregation process, the bins of renewables and load demand are grouped into multiple combinations. To illustrate the approach, Figure 1 presents the discretization–aggregation process with only two dimensions in the following example. Figure 1A shows a 5-day historical data sample of wind power and load with an interval of 15 min, and their values are normalized against respective peak values. Figure 1B shows the discrete time series. When the width of bins is set to 0.1 p.u, six load demand ranges (e.g., [0.4, 0.5], (0.5, 0.6], …) and nine generation ranges (e.g., [0, 0.1], (0.1, 0.2], …) are used. Then the time-varying data are allocated to a series of bins. Figure 1C presents the distribution with combinations of wind power and load. The combines of “similar” characteristics are aggregated into the same bin. For instance, the yellow block indicates the data where demand is 0.6 and wind is 0.2.
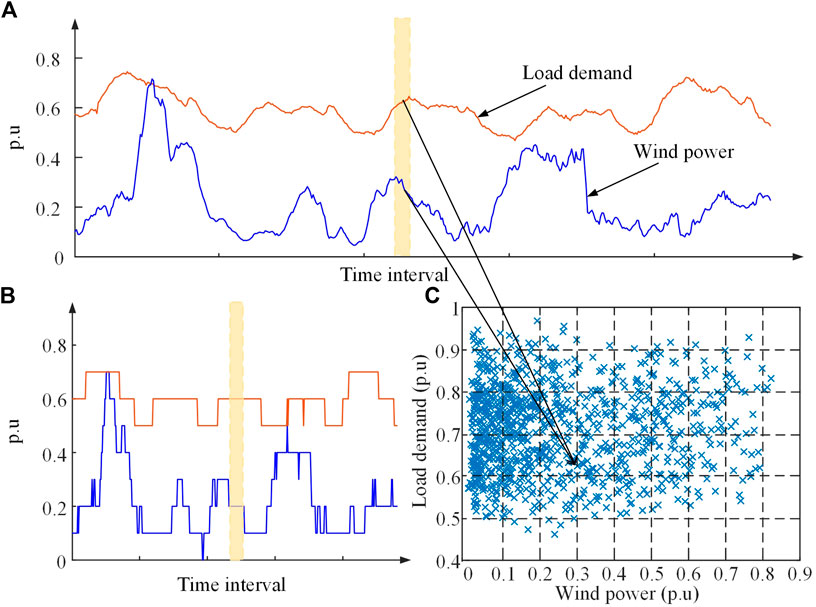
FIGURE 1. Procedure of discretization and aggregation of time series data.
The discretization–aggregation method allocates time series data into a finite number of combinations, which reduces the number of combinations to be evaluated, and retains the relevance between renewables and demand. Importantly, it does retain extreme characteristics. The “coincidence” between maximum generation and minimum demand is normally regarded as the extreme combination for voltage violation and the main constraint of the hosting capacity assessment.
The discretization–aggregation process goes through each possible combination and sums the occurrence periods, which captures the full range of generation and load. Figure 2 presents all combinations of data above and their occurrence periods. The combinations labeled with red represent the extreme conditions of maximum power generation and minimum load demand. If the voltage constraint is not violated in these combinations, it is unlikely to be violated in other combinations.
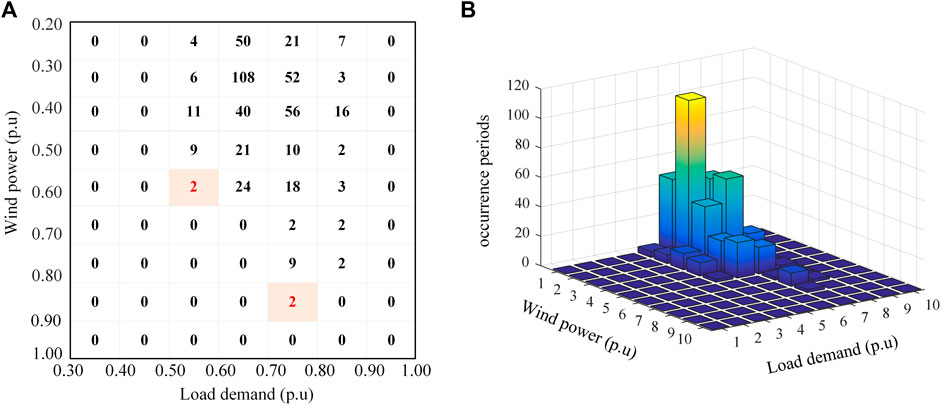
FIGURE 2. (A) Occurrence periods for all combinations when the bin width is 0.1 p.u; (B) visualization of all wind–load aggregated combinations.
It is obvious that different combinations will be obtained by selecting different widths. The smaller the width, the more detailed the bins to be evaluated. Figure 3 shows the combinations of wind and load when the width is set to 0.05 p.u. The total number of combinations increases significantly, and the number of extreme combinations has only increased by one compared with the results in Figure 2. Therefore, the selection of bin width may affect the scale and accuracy of the hosting capacity assessment. Moreover, when an additional PV power is added, the discretization–aggregation process remains unchanged, but the dimension is increased.
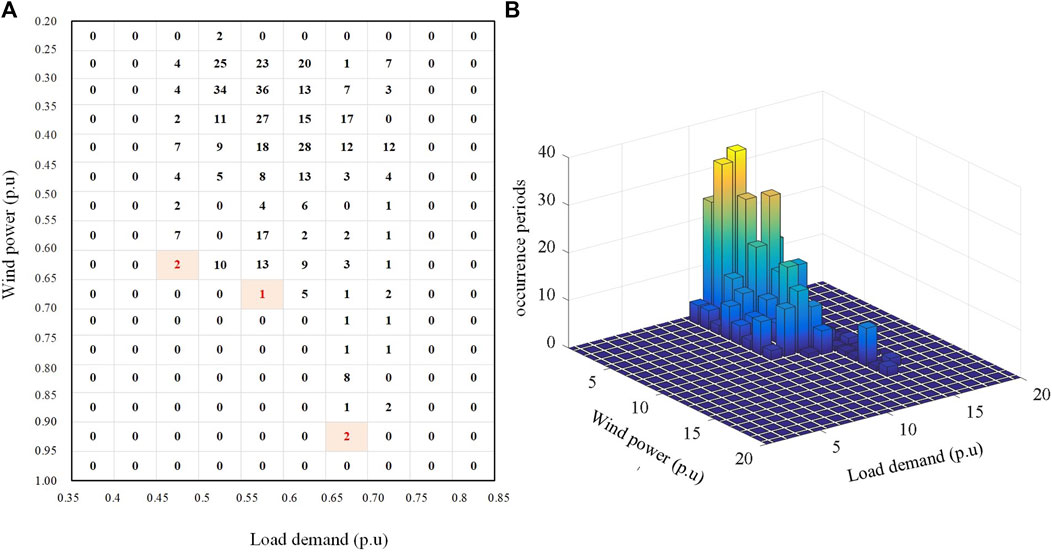
FIGURE 3. (A) Occurrence periods for all combinations when the bin width is 0.05 p.u; (B) Visualization of all wind–load aggregated combinations.
The holomorphic embedding method was applied to the PF problem by Dr. Antonio Trias for the first time (Trias, 2012), to avoid the non-convergence problem of the traditional iterative PF methods. In this study, the conventional HEM is improved considering the direction of generation and load change. The equivalent analytical formulations of voltage can be obtained by only one PF calculation. It can establish the dependence between the embedding parameter and the actual operation level.
Consider an N-bus system, the power balance equation (PBE) can be expressed as follows:
where Yik is the (i, k) element of the bus admittance matrix,
The non-holomorphic PBE is converted into holomorphic functions by embedding a complex parameter
where Pi0,
where
Since
where the voltage sequence coefficients
The Maclaurin series for
Additionally, let W(s) represent the inverse of the voltage function V(s), defined as follows:
The relationship between
The relationship between
where Eq. 15b can also be formulated as follows:
By substituting Eqs 10–13 into Eqs 2–5, we obtain the following:
Thus, we establish the recursion relationship from the aforementioned holomorphic embedding formulas to obtain the equations. Then
To solve the system of equations above, the reference state at s = 0 is given as follows:
Notice that the meaning of the reference solution of the improved HEM is different from that of the conventional HEM (Rao et al., 2016). The reference solution of the conventional HEM represents the power system with no load and no generator, while the reference solution of the improved HEM represents the voltage and reactive power injections at the buses for the power system under the initial loading level. The solution process is as follows:
where
To establish the recursive relationship of variables, a new variable δni is defined as follows:
For the slack bus, the power series coefficient expression is written as follows:
The voltage power series coefficients of PQ bus and PV bus are solved, we can obtain the following equations:
where
According to the recursive relationship of Eqs 31–34, let
The process of using improved HEM to solve a PF problem and voltage violation is as follows:
1) The PBEs are embedded with the parameter
2) Taking the direction of generation and load change into account, the growth coefficients kGi and kLi are defined, and then
3) The function
4) Calculate the reference state
5) Solve the recursive equations and calculate the coefficients of the series
6) Let
7) The voltage sequence coefficients and the voltage function
Considering the temporal characteristics of renewable energy generation and load demand, this study proposes a framework for evaluating the hosing capacity in distribution networks with DGs. The framework consists of three modules, as shown in Figure 4.
1) Module 1: Deployment schemes of DGs.
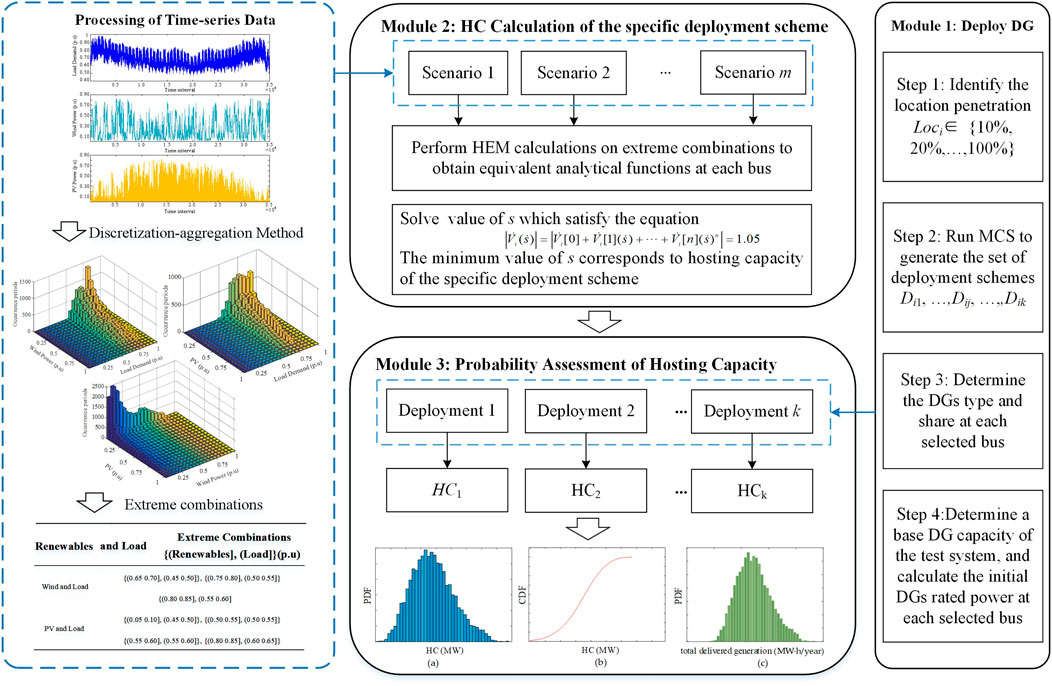
FIGURE 4. Stochastic framework for the hosting capacity assessment.
This module generates multiple potential DG deployment schemes. The variables include DG location penetration, the locations of DGs, and the types of DGs. The steps are as follows:
Step 1: Identify the location penetration
Step 2: Generate DG locations. For each location penetration level
Step 3: Set the types and shares of DGs. For example, 50% wind and 50% PV.
Step 4: Determine a base DG capacity (e.g., 1 MW). For each deployment scheme, the initial rated power of DGs is allocated based on the corresponding peak load.
2) Module 2: Calculation method of the hosting capacity. This module studies the calculation method of the hosting capacity based on the improved HEM, considering temporal characteristics of DGs and load demand. The steps are as follows:
Step 1: Process the historical data of wind, PV, and load. By the discretization–aggregation method, select the proper bin width and obtain m extreme combinations Sn (n = 1, …, m).
Step 2: For a specific deployment scheme Dij, perform HEM calculation on different extreme combinations, respectively. Then obtain the equivalent analytical function
Step 3: If none of the bus voltages exceed 1.05 p.u, let |
Step 4: Compare the minimum value of
3) Module 3: Analysis of hosting capacity results. Repeat steps in Module 2 to obtain the hosting capacity results for each deployment scheme Dij, and obtain the hosting capacity results HC = {HC1, … , HCk}. Then perform statistical analysis for the obtained hosting capacity results. The steps are as follows:
1) Histogram of HC is obtained based on the results HC = {HC1, … , HCk}, and the probability density function (PDF) based on Kernel density estimation is helpful to understand the probabilistic HC at a specific penetration level.
2) Cumulative distribution function (CDF) curve of HC is helpful for planners to estimate the probability that the HC does not exceed a specific value.
3) Histogram of total delivered generation. The total delivered generation of DG is a valuable quantitative indicator of the use of renewable energy (Bawazir and Cetin, 2020). Therefore, some statistical data of total delivered generation in a year can provide the energy utilization of different types of renewable energy.
The simulations are carried out on the IEEE 33-bus distribution system. The detailed parameters of the test system are available in Baran and Wu. (1989). Bus 1 is set as the slack bus and the voltage is set to 1.0 p.u. Other nodes are PQ buses. The reference voltage is 12.66 kV and the reference capacity is 10 MV A. The upper voltage limit of each bus is set to 1.05 p.u. Nodes 2–33 are candidate buses accessible to DG.
In this section, initially, the historical data of wind, PV, and load demand are processed by the discretization–aggregation method, and the extreme combinations are filtered. Then the proposed HEM is used to solve the voltage violation problem on extreme combinations. For a specific deployment scheme, the hosting capacity results with different bin widths are discussed. Finally, detailed hosting capacity assessments of both single resource and hybrid cases are performed.
The simulations use the historical data of wind speed, solar irradiation, and load demand from a typical distribution system. The data of one year have a total of 35,040 data points with 15-min temporal resolution. The levels of load demand, wind, and PV output are normalized against peak values, as shown in Figure 5. It can be seen that load demand and PV have both obvious seasonal characteristics. The load in summer is relatively lower than that in winter, and the PV generation in summer is significantly higher than that in winter, but for wind power, the feature is not so obvious. It should be noted that different buses are close geographically in the test system, and the potential of renewable energy power generation is similar to a certain extent. So it is assumed that DGs follow the same time series curves.
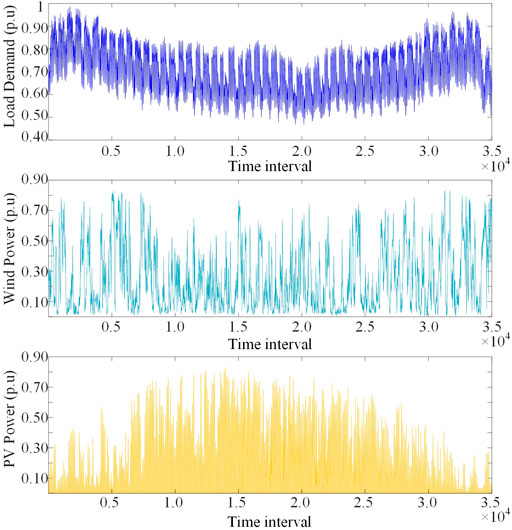
FIGURE 5. Time series data.
The combinations of wind, PV, and load demand are obtained by the discretization–aggregation technology in Introduction. Figure 6 shows the combinations and occurrence periods of renewable generation and load when the bin width is 0.05 p.u.
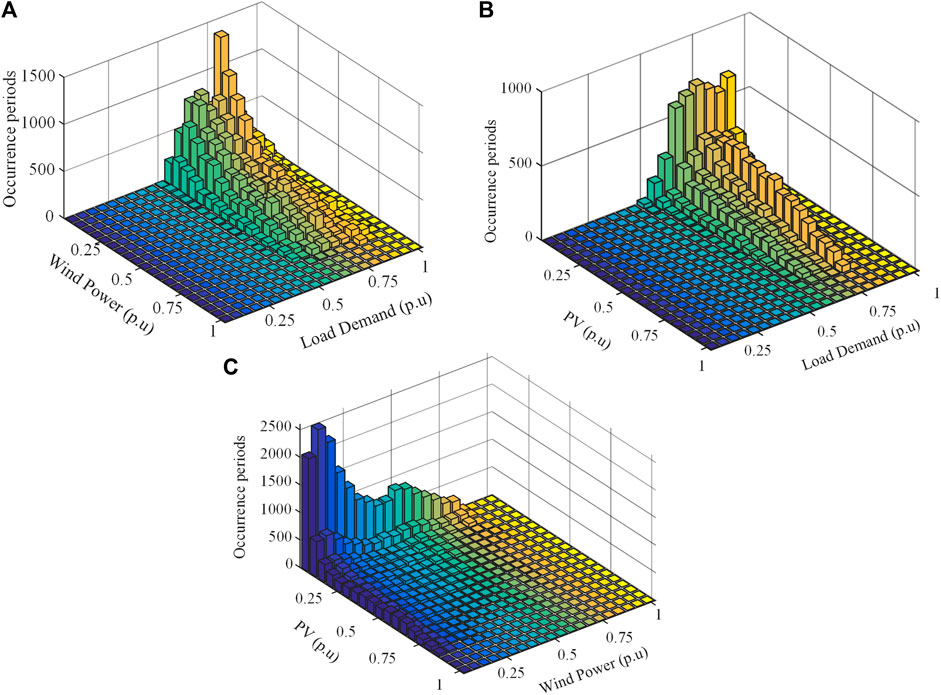
FIGURE 6. Visualization of aggregated combinations: (A) wind power–load; (B) PV–load; (C) PV–wind power.
For the wind–load case, there are a total of 400 combinations, but only 175 contain non-zero occurrence periods. Similarly, for the PV–load case, the occurrence periods of only 133 combinations are non-zero. For renewable energy, wind power and PV are negatively correlated. PV generation mainly depends on solar radiation, and solar energy at night can be ignored. In contrast, the wind power during the day is usually less than that at night. Therefore, there is a certain complementarity between wind power and PV (Miglietta et al., 2017; Guozden et al., 2020).
The extreme cases of maximum generation and minimum demand are critical on the hosting capacity assessment restrained by voltage rise. The results of extreme combinations are given in Table 1. For the wind–load case and the PV–load case, only three and four extreme combinations need to be considered, respectively. For the wind–PV–load case, there are 2,567 combinations. It is difficult to show them in visual graphics, but 394 extreme combinations can be screened by the discretization–aggregation technique. Compared with the use of original historical data, the introduction of extreme combinations can significantly shrink the calculation scale of multidimensional problems.
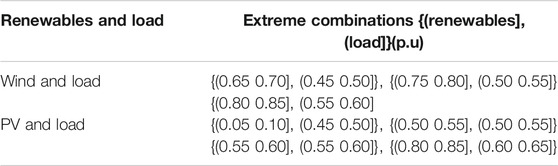
TABLE 1. Results of extreme combinations.
Taking a specific DG deployment scheme as an example, the influence of bin width is discussed. And the rapidity and effectiveness of the hosting capacity calculation method based on HEM are verified. Wind power is connected at Bus 2, 7, 24, and 33. Four widths are considered, namely, 0.1 p.u, 0.05 p.u, 0.01 p.u, and 0.001 p.u. The hosting capacity is calculated according to Module 2 in Framework for Hosting Capacity Assessment. For comparison, the Newton–Raphson power flow method is used to calculate the hosting capacity on each extreme combination, by increasing the total DG capacity until the upper voltage is violated. The hosting capacity result is 10.872 MW from all historical data, which is regarded as the accurate value. Using the calculation method based on HEM in this study, the results of extreme combinations and the hosting capacity with different bin widths are shown in Table 2.
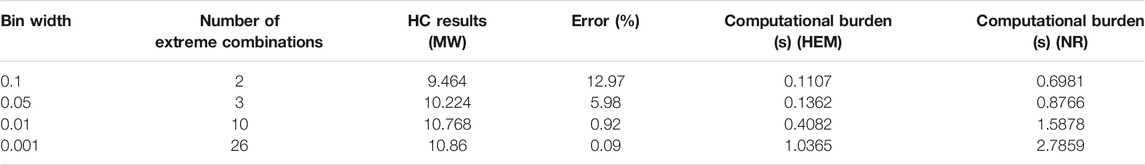
TABLE 2. Hosting capacity results with different bin widths.
The results in Table 2 show that the method proposed in this study can greatly shorten the calculation time and improve the calculation efficiency. When the bin width is set to 0.1 p.u, the result is 12.97% smaller than the accurate value. Therefore, larger width may underestimate the hosting capacity and lead to conservative results. On the contrary, when the width is less than or equal to 0.01 p.u, the relative error is less than 1%. We can conclude that when the appropriate bin width is selected, the calculation scale can be simplified by using the proposed extreme combinations. More importantly, the hosting capacity calculation method based on HEM can further shorten the calculation time.
Figure 7 shows that the voltage violation occurs when the width is 0.01 p.u. Under the deployment scheme, when the extreme scenarios are {(0.81, 0.82], (0.59, 0.60]}, Bus 24 first exceeds the upper voltage limit.
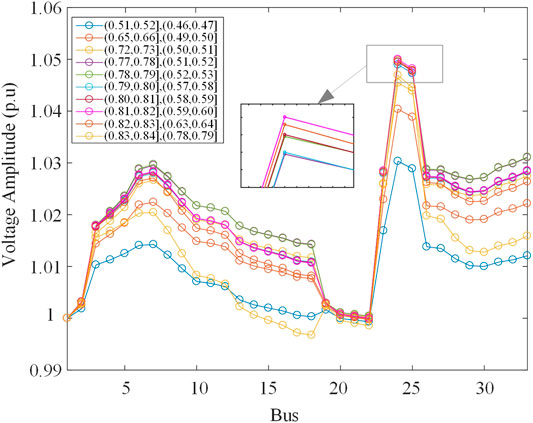
FIGURE 7. Voltage violation scenarios.
In the test system, the number of DG candidate buses is 32. When the location penetration level is 50%, the total possible number of DG deployment schemes is more than 6 × 10⁸. A large number of potential DG deployment schemes bring a significant computational burden. Therefore, MCS is used to simulate relatively few scenarios to obtain approximate results. In this context, we adopt the variance coefficient β (Prusty and Jena, 2017; Shen et al., 2020). β ≤ 0.5% is set as the stopping criterion of MCS, and the results of MCS are considered to be accurate.
We performed the stochastic framework to access the hosting capacity of a single DG case in Framework for Hosting Capacity Assessment. The bin width is set as 0.01 p.u, and the location penetration level is increased from 10 to 100% by a fixed step of 10%. Table 3 shows the statistical results of the wind system and PV system at location penetration levels of 30, 50, 70, and 90%.
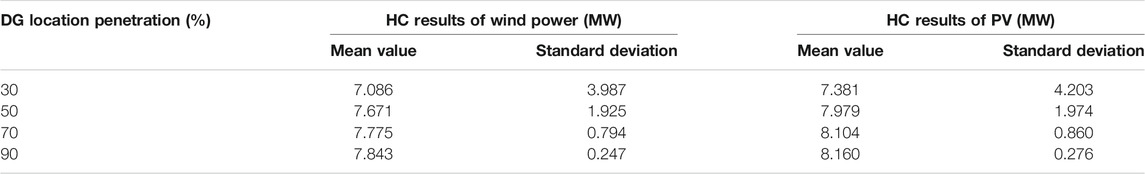
TABLE 3. Statistical results of HC with different penetration levels.
The mean values of the hosting capacity increase with higher location penetration levels, while the standard deviations show the opposite trend. The reasons are as follows: first, with the increase of the location penetration level, DG locations increase and the capacity allocated to each location decreases, so the total hosting capacity of the system increases. Second, the higher penetration level reduces the uncertainty of DG locations, so the results of different deployment schemes are more concentrated.
Figure 8 shows the probability density distribution of the hosting capacity at 50% location penetration level. For the hosting capacity of the wind system, the minimum and maximum values are 3.995 and 14.224 MW, respectively. For the hosting capacity of the PV system, the results of the hosting capacity are 4.236 and 14.472 MW, respectively. The difference between extreme values is due to the location distribution of DGs.
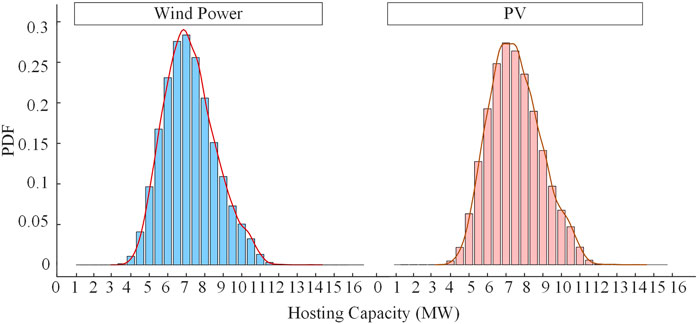
FIGURE 8. PDF under 50% penetration level.
Figure 9 shows the cumulative probability distribution of the hosting capacity, which can provide planners with the probability that the hosting capacity in distribution networks is lower than a specific value. For example, the probability of the hosting capacity, which is no more than 10 MW in the wind system, is 0.9359, while in the PV case, the result is 0.9097.
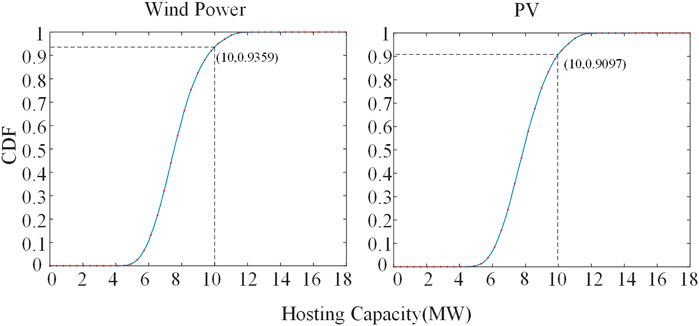
FIGURE 9. CDF under 50% penetration level.
The total delivered generation can realistically reflect the energy utilization. Therefore, when planning the distributed system, not only the maximum hosting capacity of the system but also the total delivered generation is needed to be considered. The comparison of the mean values of total delivered generation of the wind system and the PV system is presented in Table 4. Although the hosting capacity of the PV system is slightly higher than that of the wind system, the total delivered generation of PV is less than 50% of that of the wind system. The main reason for the difference is the higher correlation and capacity coefficient between wind resource and load demand.
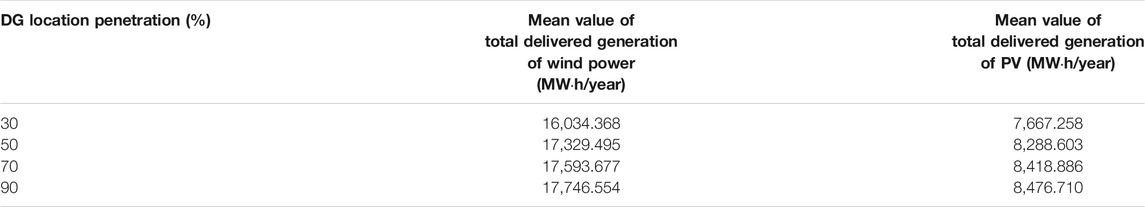
TABLE 4. Statistical results of total delivered generation with different penetration levels.
There is complementarity between wind energy and photovoltaic energy, and their joint action may affect the hosting capacity of the system. However, the existing literature rarely discusses the hosting capacity of hybrid wind–PV energy systems. The proposed stochastic framework is used to analyze whether hybrid renewable energy helps improve the available hosting capacity.
A variety of deployment schemes are generated by MCS. Figure 10 shows the probability distribution of HC results obtained with different shares of wind and PV at the 50% penetration level. It can be seen that the PDF curve of the single energy power generation hosting capacity is on the left side of the PDF curve of the hybrid energy hosting capacity. With the increase of wind power share, the PDF curve of the hosting capacity moves to the right until the share of wind power generation reaches 75%, and then the PDF curve of the hosting capacity moves to the left. It indicates that hybrid power generation has advantages in improving the level of the hosting capacity.
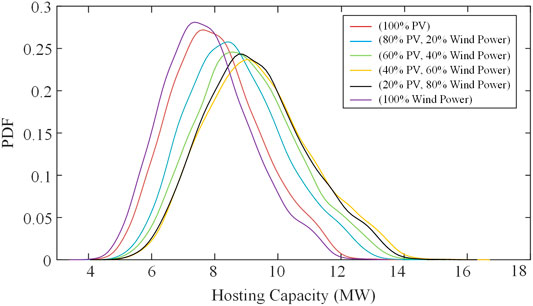
FIGURE 10. PDF of the hosting capacity with different shares of wind and PV.
According to the results, when the wind power share reaches 75%, the hosting capacity of the hybrid wind–PV system reaches the maximum. Table 5 shows the mean values of hosting capacity and delivered generation. The mean value of the total hosting capacity is 9.396 MW, while the mean values of wind and PV hosting capacity are 7.040 and 2.356 MW, respectively. Compared with the results of the single wind case and PV case, the hosting capacity increases by about 1.22 times and 1.18 times, respectively. Meanwhile, the mean value of total annual delivered generation is 17,999.262 MWh, of which wind power generation accounts for about 87% and PV accounts for about 13%. Compared with the single wind case and PV case, the total delivered generation increases by about 1.04 times and 2.17 times, respectively.
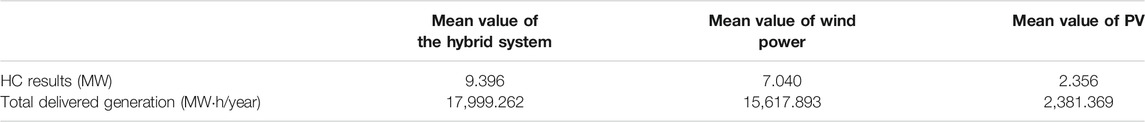
TABLE 5. Mean values of the hosting capacity and delivered generation.
Wind power plays a leading role in hybrid wind–PV systems. PV accounts for a relatively small proportion, but as a supplement to energy, it is also essential to increase the total hosting capacity and total delivered generation. The results show that the complementarity between wind power and PV is conducive to distribution networks to accommodate more distributed renewable resources. It can leverage more renewable generation capacity to be utilized, thereby promoting higher energy export.
Due to the inherent uncertainty of renewable energy resources, the hosting capacity in distributed networks is not an immutable value. Meanwhile, it is important to consider the uncertainties of penetration levels, locations of DGs, and shares of wind and PV. Thus, HC needs to be expressed in some statistical ways. In this study, based on the wind–photovoltaic–load temporal characteristic, a stochastic framework for the hosting capacity is proposed. The main conclusions are as follows:
1) The uncertainty of wind power, PV, and load demand is considered through time series data. The discretization–aggregation method is introduced to process time series data and generate extreme combinations. It reduces the number of scenarios to be evaluated and significantly mitigates computational complexity.
2) The holomorphic embedding model is proposed considering the direction of generation and load change. The equivalent analytical formula of voltage establishes the corresponding relationship between the actual operation level and the embedding parameter. The improved HEM can improve the efficiency of the hosting capacity assessment.
3) Hosting capacity of the wind system, PV system, and hybrid wind–PV system is studied from a probabilistic view. Compared with the single resource case, the hybrid case has the advantage in power generation. Due to the complementarity between wind power and PV, the hybrid wind–PV system has the potential to increase the hosting capacity and energy production in distributed networks. The performance in promoting energy integration and improving utilization varies according to different shares of wind and PV.
From the development trend of the low-carbon goal, a large amount of distributed renewable energy will inevitably lead to more significant changes in distribution networks. This study proposes a method to quantify the hosting capacity in distribution networks with DGs based on the holomorphic embedding method. It offers assistance in understanding the level of renewable energy generation, making better use of the available renewable resources, and promoting the application of distributed hybrid power generation in the power grid. Furthermore, we will combine the optimization algorithm to plan the optimal access scheme of distributed generation with the method proposed in this study.
The original contributions presented in the study are included in the article/Supplementary Material, further inquiries can be directed to the corresponding author.
ND was responsible for methodology, formal analysis, validation, and editing of the manuscript. FT and QL were responsible for review and supervision. CW contributed to the conception and design of the study. XG and JX wrote sections of the manuscript. JZ and RL were responsible for part of data curation and project administration. All authors contributed, read, and approved the submitted version.
This work was supported by the Science and Technology Project of the State Grid Corporation of China (Research on the scale and the promotion of the hosting capacity of electronics power supply in power grids (5100-202116005A-0-0-00)).
Author CW is employed by Electric Power Research Institute, State Grid Zhejiang Electric Power Co., Ltd. Author JZ and author RL are employed by China Electric Power Research Institute.
The remaining authors declare that the research was conducted in the absence of any commercial or financial relationships that could be construed as a potential conflict of interest.
All claims expressed in this article are solely those of the authors and do not necessarily represent those of their affiliated organizations, or those of the publisher, the editors, and the reviewers. Any product that may be evaluated in this article, or claim that may be made by its manufacturer, is not guaranteed or endorsed by the publisher.
Al-Saffar, M., Zhang, S., Nassif, A., and Musilek, P. (2019). “Assessment of Photovoltaic Hosting Capacity of Existing Distribution Circuits,” in Proceeding f the 2019 IEEE Canadian Conference of Electrical and Computer Engineering (CCECE), Edmonton, AB, Canada, May 2019 (IEEE), 1–4. doi:10.1109/CCECE.2019.8861957
Alturki, M., Khodaei, A., Paaso, A., and Bahramirad, S. (2018). Optimization-based Distribution Grid Hosting Capacity Calculations. Appl. Energ. 219, 350–360. doi:10.1016/j.apenergy.2017.10.127
Ampofo, D. O., Otchere, I. K., and Frimpong, E. A. (2017). “An Investigative Study on Penetration Limits of Distributed Generation on Distribution Networks,” in Proceeding f the 2017 IEEE PES PowerAfrica, Accra, Ghana, June 2017 (IEEE), 573–576. doi:10.1109/PowerAfrica.2017.7991289
Baran, M. E., and Wu, F. F. (1989). Network Reconfiguration in Distribution Systems for Loss Reduction and Load Balancing. IEEE Trans. Power Deliv. 4, 1401–1407. doi:10.1109/61.25627
Bawazir, R. O., and Cetin, N. S. (2020). Comprehensive Overview of Optimizing PV-DG Allocation in Power System and Solar Energy Resource Potential Assessments. Energ. Rep. 6, 173–208. doi:10.1016/j.egyr.2019.12.010
Bollen, M., and Hassan, F. (2011). Integration of Distributed Generation in the Power System. Hoboken, USA: Wiley- IEEE Press. doi:10.1002/9781118029039
Chen, B., Bi, W., Li, X., and Li, C. (2018). Capacity Planning Strategies for Distributed Generation Considering Wind-Photovoltaic-Load Joint Time Sequential. scenarios Power Syst. Technol. 42, 755–761. doi:10.13335/j.1000-3673.pst.2017.1304
Dong, Y., Wang, S., and Yan, B. (2019). Review on Evaluation Methods and Improvement Techniques of DG Hosting Capacity in Distribution Network. Power Syst. Technol. 43, 2258–2266. doi:10.13335/j.1000-3673.pst.2019.0428
Fan, S., Li, C., Wei, Z., Pu, T., and Liu, X. (2017). Method to Determine the Maximum Generation Capacity of Distribution Generation in Low‐voltage Distribution Feeders. J. Eng. 2017, 944–948. doi:10.1049/joe.2017.0470
Fan, S., Pu, T., Li, L., Yu, T., Yang, Z., and Gao, B. (2016). “Evaluation of Impact of Integrated Distributed Generation on Distribution Network Based on Time-Series Analysis,” in Procedding of the 2016 China International Conference on Electricity Distribution (CICED), Xi'an, China, Aug. 2016 (IEEE), 1–5. doi:10.1109/CICED.2016.7576171
Gonzaga, R. M., Massigan, J. A. D., and London, J. B. A. (2019). “Analysis of the Hosting Capacity of a Real Distribution Feeder with Wind Generation,” in Proceeding f the 2019 ISGT Latin America, Gramado, Brazil, Sept. 2019 (IEEE), 1–5. doi:10.1109/ISGT-LA.2019.8895318
Guozden, T., Carbajal, J. P., Bianchi, E., and Solarte, A. (2020). Optimized Balance between Electricity Load and Wind-Solar Energy Production. Front. Energ. Res. 8, 16. doi:10.3389/fenrg.2020.00016
IEA (2019). Status of Power System Transformation. https://www.iea.org/reports/status-of-power-system-transformation-2019 (Accessed August 24, 2021).]
Injeti, S. K., and Thunuguntla, V. K. (2020). Optimal Integration of DGs into Radial Distribution Network in the Presence of Plug-In Electric Vehicles to Minimize Daily Active Power Losses and to Improve the Voltage Profile of the System Using Bio-Inspired Optimization Algorithms. Prot. Control. Mod. Power Syst. 5, 3. doi:10.1186/s41601-019-0149-x
Ismael, S. M., Abdel Aleem, S. H. E., Abdelaziz, A. Y., and Zobaa, A. F. (2019). State-of-the-art of Hosting Capacity in Modern Power Systems with Distributed Generation. Renew. Energ. 130, 1002–1020. doi:10.1016/j.renene.2018.07.008
Khoshkbar-Sadigh, A., and Smedley, K. M. (2015). “The Necessity of Time-Series Simulation for Investigation of Large-Scale Solar Energy Penetration,” in Procedding of the 2015 IEEE Power & Energy Society Innovative Smart Grid Technologies Conference (ISGT), Washington, DC, USA, Feb. 2015 (IEEE), 1–5. doi:10.1109/ISGT.2015.7131803
Kolenc, M., Papič, I., and Blažič, B. (2015). Assessment of Maximum Distributed Generation Penetration Levels in Low Voltage Networks Using a Probabilistic Approach. Int. J. Electr. Power Energ. Syst. 64, 505–515. doi:10.1016/j.ijepes.2014.07.063
Li, Z., Jiang, W., Abu-Siada, A., Li, Z., Xu, Y., and Liu, S. (2021). Research on a Composite Voltage and Current Measurement Device for HVDC Networks. IEEE Trans. Ind. Electron. 68, 8930–8941. doi:10.1109/TIE.2020.3013772
Liu, Y., Yang, N., Dong, B., Wu, L., Yan, J., Shen, X., et al. (2020). Multi-Lateral Participants Decision-Making: A Distribution System Planning Approach with Incomplete Information Game. IEEE Access 8, 88933–88950. doi:10.1109/ACCESS.2020.2991181
Miglietta, M. M., Huld, T., and Monforti-Ferrario, F. (2017). Local Complementarity of Wind and Solar Energy Resources over Europe: an Assessment Study from a Meteorological Perspective. J. Appl. Meteorol. Climatol. 56, 217–234. doi:10.1175/JAMC-D-16-0031.1
Mulenga, E., Bollen, M. H. J., and Etherden, N. (2020). A Review of Hosting Capacity Quantification Methods for Photovoltaics in Low-Voltage Distribution Grids. Int. J. Electr. Power Energ. Syst. 115, 105445. doi:10.1016/j.ijepes.2019.105445
Mulenga, E., Bollen, M. H. J., and Etherden, N. (2021b). Distribution Networks Measured Background Voltage Variations, Probability Distributions Characterization and Solar Pv Hosting Capacity Estimations. Electric Power Syst. Res. 192, 106979. doi:10.1016/j.epsr.2020.106979
Mulenga, E., Bollen, M. H. J., and Etherden, N. (2021a). Solar Pv Stochastic Hosting Capacity in Distribution Networks Considering Aleatory and Epistemic Uncertainties. Int. J. Electr. Power Energ. Syst. 130, 106928. doi:10.1016/j.ijepes.2021.106928
Munikoti, S., Abujubbeh, M., Jhala, K., and Natarajan, B. (2022). A Novel Framework for Hosting Capacity Analysis with Spatio-Temporal Probabilistic Voltage Sensitivity Analysis. Int. J. Electr. Power Energ. Syst. 134, 107426. doi:10.1016/j.ijepes.2021.107426
Nan, Y., Di, Y., Zheng, Z., Jiazhan, C., Daojun, C., and Xiaoming, W. (2018). Research on Modelling and Solution of Stochastic SCUC under AC Power Flow Constraints. IET Generation, Transm. Distribution 12, 3618–3625. doi:10.1049/iet-gtd.2017.1845
Ochoa, L. F., Dent, C. J., and Harrison, G. P. (2010). Distribution Network Capacity Assessment: Variable DG and Active Networks. IEEE Trans. Power Syst. 25, 87–95. doi:10.1109/TPWRS.2009.2031223
Papaioannou, I. T., and Purvins, A. (2014). A Methodology to Calculate Maximum Generation Capacity in Low Voltage Distribution Feeders. Int. J. Electr. Power Energ. Syst. 57, 141–147. doi:10.1016/j.ijepes.2013.11.04710.1016/j.ijepes.2013.11.047
Prusty, B. R., and Jena, D. (2017). A Critical Review on Probabilistic Load Flow Studies in Uncertainty Constrained Power Systems with Photovoltaic Generation and a New Approach. Renew. Sustain. Energ. Rev. 69, 1286–1302. doi:10.1016/j.rser.2016.12.044
Rabiee, A., and Mohseni-Bonab, S. M. (2017). Maximizing Hosting Capacity of Renewable Energy Sources in Distribution Networks: A Multi-Objective and Scenario-Based Approach. Energy 120, 417–430. doi:10.1016/j.energy.2016.11.095
Rao, S., Feng, Y., Tylavsky, D. J., and Subramanian, M. K. (2016). The Holomorphic Embedding Method_newline Applied to the Power-Flow Problem. IEEE Trans. Power Syst. 31, 3816–3828. doi:10.1109/TPWRS.2015.2503423
Shen, X., Ouyang, T., Khajorntraidet, C., Li, Y., Li, S., and Zhuang, J. (2021a). “Mixture Density Networks-Based Knock Simulator,” in Proceeding of the IEEE/ASME Trans. Mechatron., February 2021 (Canada: IEEE), 1. doi:10.1109/TMECH.2021.3059775
Shen, X., Ouyang, T., Yang, N., and Zhuang, J. (2021b). Sample-based Neural Approximation Approach for Probabilistic Constrained Programs. IEEE Trans. Neural Netw. Learn. Syst., 1–8. doi:10.1109/TNNLS.2021.3102323
Shen, X., and Raksincharoensak, P. (2021). “Pedestrian-Aware Statistical Risk Assessment,” in Proceeding f the IEEE Trans. Intell. Transport. Syst., June 2021 (Canada: IEEE), 1–21. doi:10.1109/TITS.2021.3074522
Shen, X., and Raksincharoensak, P. (2021). Statistical Models of Near-Accident Event and Pedestrian Behavior at Non-signalized Intersections. J. Appl. Stat., 1–21. doi:10.1080/02664763.2021.1962263
Shen, X., Zhang, X., Ouyang, T., Li, Y., and Raksincharoensak, P. (2020a). Cooperative Comfortable-Driving at Signalized Intersections for Connected and Automated Vehicles. IEEE Robot. Autom. Lett. 5 (4), 6247–6254. doi:10.1109/LRA.2020.3014010
Shen, X., Zhang, Y., Sata, K., and Shen, T. (2020b). Gaussian Mixture Model Clustering-Based Knock Threshold Learning in Automotive Engines. Ieee/asme Trans. Mechatron. 25 (6), 2981–2991. doi:10.1109/TMECH.2020.3000732
Shen, X., Zhang, Y., Shen, T., and Khajorntraidet, C. (2017). Spark advance Self-Optimization with Knock Probability Threshold for Lean-Burn Operation Mode of SI Engine. Energy 122, 1–10. doi:10.1016/j.energy.2017.01.065
Singh, M. (2017). Protection Coordination in Distribution Systems with and without Distributed Energy Resources- a Review. Prot. Control. Mod. Power Syst. 2, 27. doi:10.1186/s41601-017-0061-1
Sun, L., Zhao, M., and Wang, N., (2018). Research of Permitted Capacity of Distributed Photovoltaic Generation Based on Voltage Deviation Chance Constrained. Trans. China Electrotechnical Soc. 33, 1560–1569. doi:10.19595/j.cnki.1000-6753.tces.170185
Torquato, R., Salles, D., Oriente Pereira, C., Meira, P. C. M., and Freitas, W. (2018). A Comprehensive Assessment of PV Hosting Capacity on Low-Voltage Distribution Systems. IEEE Trans. Power Deliv. 33 (2), 1002–1012. doi:10.1109/TPWRD.2018.2798707
Trias, A. (2012). “The Holomorphic Embedding Load Flow Method,” in Proceeding of the 2012 IEEE Power and Energy Society General Meeting, San Diego, CA, USA, July 2012 (IEEE), 1–8. doi:10.1109/PESGM.2012.6344759
Wang, J., Xu, Q., Su, H., and Fang, K. (2021). A Distributed and Robust Optimal Scheduling Model for an Active Distribution Network with Load Aggregators. Front. Energ. Res. 9, 646869. doi:10.3389/fenrg.2021.646869
Wu, H., Huang, R., Wang, Y., and Yuan, Y. (2019). “Chance-Constrained DG Hosting Capacity Assessment with Spatially Correlated Wind Speed,” in Procedding of 2019 IEEE Innovative Smart Grid Technologies-Asia (ISGT Asia), Chengdu, China, May 2019 (IEEE), 1546–1551. doi:10.1109/ISGT-Asia.2019.8881689
Yang, N., Huang, Y., Hou, D., Liu, S., Ye, D., Dong, B., et al. (2019). Adaptive Nonparametric Kernel Density Estimation Approach for Joint Probability Density Function Modeling of Multiple Wind Farms. Energies 12, 1356. doi:10.3390/en12071356
Yang, N., Liu, S., Deng, Y., and Xing, C. (2021a). An Improved Robust SCUC Approach Considering Multiple Uncertainty and Correlation. IEEJ Trans. Elec Electron. Eng. 16, 21–34. doi:10.1002/tee.23265
Yang, N., Yang, C., Wu, L., Shen, X., Jia, J., Li, Z., Chen, D., Zhu, B., and Liu, S. (2021b). “Intelligent Data-Driven Decision-Making Method for Dynamic Multi-Sequence: An E-Seq2Seq Based SCUC Expert System,” in IEEE Transactions on Industrial Informatics., August 2021 (Canada: IEEE), 1. doi:10.1109/TII.2021.3107406
Zain ul Abideen, M., Ellabban, O., and Al-Fagih, L. (2020). A Review of the Tools and Methods for Distribution Networks' Hosting Capacity Calculation. Energies 13, 2758. doi:10.3390/en13112758
Zhang, L., and Luo, Y. (2018). Combined Heat and Power Scheduling: Utilizing Building-Level thermal Inertia for Short-Term thermal Energy Storage in District Heat System. IEEJ Trans. Elec Electron. Eng. 13, 804–814. doi:10.1002/tee.22633
Zhu, B., Ding, F., and Vilathgamuwa, D. M. (2020). Coat Circuits for DC-DC Converters to Improve Voltage Conversion Ratio. IEEE Trans. Power Electron. 35 (4), 3679–3687. doi:10.1109/TPEL.2019.2934726
Zio, E., Delfanti, M., Giorgi, L., Olivieri, V., and Sansavini, G. (2015). Monte Carlo Simulation-Based Probabilistic Assessment of DG Penetration in Medium Voltage Distribution Networks. Int. J. Electr. Power Energ. Syst. 64, 852–860. doi:10.1016/j.ijepes.2014.08.004
Zobaa, A. F., Abdel Aleem, S. H. E., Ismael, S. M., and Paulo, F. R. (2020) . Hosting Capacity for Smart Power Grids. doi:10.1007/978-3-030-40029-3
Zou, H., Han, X., Liao, Q., and Liu, D. (2016). Penetration Capacity Calculation for Distributed Generation Considering Voltage Quality and Short Circuit Capacity. Constraints Power Syst. Technol. 40, 2273–2280. doi:10.13335/j.1000-3673.pst.2016.08.004
DG distributed generation
HC hosting capacity
HEM holomorphic embedding method
PDF probability density function
CDF cumulative distribution function
MCS Monte Carlo simulation
PV photovoltaic
Keywords: distributed renewable energy, hosting capacity, holomorphic embedding method, time series, voltage violation
Citation: Du N, Tang F, Liao Q, Wang C, Gao X, Xie J, Zhang J and Lu R (2021) Hosting Capacity Assessment in Distribution Networks Considering Wind–Photovoltaic–Load Temporal Characteristics. Front. Energy Res. 9:767610. doi: 10.3389/fenrg.2021.767610
Received: 31 August 2021; Accepted: 11 October 2021;
Published: 25 November 2021.
Edited by:
Yahui Zhang, Yanshan University, ChinaReviewed by:
Lei Zhang, China Three Gorges University, ChinaCopyright © 2021 Du, Tang, Liao, Wang, Gao, Xie, Zhang and Lu. This is an open-access article distributed under the terms of the Creative Commons Attribution License (CC BY). The use, distribution or reproduction in other forums is permitted, provided the original author(s) and the copyright owner(s) are credited and that the original publication in this journal is cited, in accordance with accepted academic practice. No use, distribution or reproduction is permitted which does not comply with these terms.
*Correspondence: Fei Tang, dGFuZ2ZlaUB3aHUuZWR1LmNu
Disclaimer: All claims expressed in this article are solely those of the authors and do not necessarily represent those of their affiliated organizations, or those of the publisher, the editors and the reviewers. Any product that may be evaluated in this article or claim that may be made by its manufacturer is not guaranteed or endorsed by the publisher.
Research integrity at Frontiers
Learn more about the work of our research integrity team to safeguard the quality of each article we publish.