- 1State Key Laboratory of Alternate Electrical Power System with Renewable Energy Sources, North China Electric Power University, Beijing, China
- 2Key Laboratory of Power Station Energy Transfer Conversion and System, Ministry of Education, North China Electric Power University, Beijing, China
To address climate change and environmental pollution, an increasing number of renewable energy source generations are connected to the grid; meanwhile, the need for carbon capture and pollutant reduction for traditional energy has increased in urgency. In this study, the dispatch problem for an integrated energy system (IES) is expanded considering renewable penetration, carbon capture, and pollutant reduction. First of all, detailed models of carbon and pollutants reductions systems are set up. Specifically, the carbon capture system’s characteristics, which contribute more flexibility for the conventional power plants, are clarified. In addition, the treatment process of pollutants containing SO2 and NOx is elaborated. Moreover, the structure of an evolutionary IES containing pollutants treatment, battery and thermal energy storage, and carbon capture and storage systems are put forward. On this basis, the model of IES for renewable energy penetration and environmental protection considering the constraint of pollutant ultra-low emissions is set up. Finally, the simulation results show that the proposed approach can improve renewable energy penetration and restrain carbon and pollutants emissions.
Introduction
Environmental pollution and carbon emissions have been receiving increasing attention in recent years. In 2015, the Paris Agreement proposed maintaining the global average temperature rise within 2°C by the end of this century and making efforts to control it within 1.5°C (Paris agreement, 2015). Optimizing the energy supply structure and increasing the proportion of renewable energy generation can reduce carbon and pollutant emissions for the power plants.
With the large-scale development of renewable energy generation, such as wind turbine (WT) and solar photovoltaic (PV) (Lu et al., 2016), renewable energy resources (RESs) are gradually being accepted by the power grid due to their low pollutant emissions and carbon characteristics. However, the randomness and fluctuation of RESs also pose a severe challenge to the power system (Sinsel et al., 2020). The power system must be upgraded in terms of generation (Chen et al., 2019), transmission (Rodríguez et al., 2014), distribution (Bagheri and Jadid, 2021), and consumption (Löschenbrand, 2021) to accommodate more RESs. In China, large-scale renewable energy installations are concentrated in the “Three North Areas,” where the proportion of combined heat and power (CHP) units is high (Liu et al., 2013; Arya, 2019). As CHP units operate in the heat-dominated mode, which means that the heat load determines the electric power, the rate and magnitude of regulation are highly constrained (Wu et al., 2019). Meanwhile, the limited capacity of the grid to deliver electricity results in the curtailment of a portion of renewable energy to maintain a balance between the supply and demand of electricity.
Several efforts have been undertaken to solve the renewable energy curtailment. On the power supply side, deep peaking regulation is achieved by reducing the minimum electric power output of conventional power plants (CPPs) (Yin et al., 2017; Ma et al., 2019). For CHP units, introducing heat storage tanks, electric boilers, heat pumps, and other equipment can effectively increase the range of electric power regulation (Liu et al., 2019; Wang et al., 2021a). The increased range and depth of power output regulation can productively smoothen the wide range of renewable energy fluctuation. On the electricity demand side, large-scale electric vehicles can be recharged at night when renewable power generation is high (Bayati et al., 2021; Wang et al., 2021b). The dynamic electricity price policy (Anees et al., 2021) also influences the electricity consumption periods of users to ensure smooth and controllable load, thereby addressing the conflict of the load and renewable energy generation with the time scale.
Generally, the energy supply sources, flexible regulation resources, and load demand are integrated into a system called the integrated energy system (IES) to coordinate the operation of various forms of power plants (Wang et al., 2018; Li et al., 2019). The main task of the IES is to maintain the balance of the supply and demand of electricity and heat to minimize the operating cost of the system and the curtailment of RESs (Dai et al., 2019). Consequently, the economic dispatch of the IES is translated into mathematical planning with equation and inequality constraints. Then, a series of methods, such as particle swarm optimization (Eladl and ElDesouky, 2019), robust optimization (Zhou et al., 2018; Nguyen et al., 2020), and deep reinforcement learning (Zhang et al., 2019), can be employed for dispatch.
As the penetration rate of renewable energy in the IES increases, the carbon emissions can be significantly reduced. In addition to increasing the proportion of renewable energy generation, the desulfurization, denitrification, and decarburization in CPPs are effective measures of environmental protection (Zhang and Zhang, 2020). Desulfurization, denitrification, and decarbonization are achieved through the flue gas desulfurization (FGD), selective catalytic reduction (SCR) and carbon capture and storage (CCS) systems in coal-fired power units, respectively. On the one hand, as typical pollutant reduction systems, the operating costs of FGD and SCR systems are usually considered in IES scheduling. The costs of the pollutant reduction systems vary significantly for different pollutant emission requirements, which are ignored by most existing studies on IES dispatch. In fact, the costs of pollutants treatment are closely related to unit load and pollutant emission concentration requirements. On the other hand, the CCS system can separate the CO2 in the flue gas after denitrification and desulfurization. The captured CO2 can be stored in suitable locations by transportation (Yao et al., 2018). The combination of CCS and CPP can form a carbon capture power plant (CCPP), which can reduce carbon emissions substantially and reduce the minimum output of the power unit. However, most studies have configured the CCS system at maximum operating conditions. Although this can significantly reduce the carbon emissions of coal-fired units, it can cause significant energy consumption, which is not conducive to the flexible operation of the CCPP units. In addition, the flue gas desulfurization (FGD) and selective catalytic reduction (SCR) systems can separate the SO2 and NOx in flue gas, respectively. Most of the existing studies only consider the cost of pollutant emissions and do not analyze in detail the impact of ultra-low emissions on the pollutant treatment cost.
In this study, on the one hand, we will thoroughly analyze the operating characteristics of CCPPs, including flexible operating ranges and capture consumption under different working conditions to achieve the dual purpose of reducing system cost and renewable energy curtailment. On the other hand, we will take the ultra-low pollutant emissions as constraints to study the relationship between the cost of pollutant emission reduction, operating conditions, and the concentration of pollutant emissions. In addition, an energy storage system (ESS) containing battery energy storage (BES) and thermal energy storage (TES) systems are introduced into IES as typical flexible regulation resources to provide more power regulation flexibility.
The rest of this paper is arranged as follows. Modeling of Carbon Reduction System analyzes the energy conversion characteristics of the carbon capture process and obtains the regulation capacity provided by the CCS system. Modeling of Pollutant Reduction System calculates the pollutant treatment cost with different pollutant emission concentrations. The analysis of these two parts provides the basis for flexible decarbonization and efficient pollutant reduction of the IES. Modeling of IES establishes the optimal dispatch model of the IES by calculating the operating cost and constraint of each subsystem. Case Study quantitatively analyzes the impact of carbon and pollutant reduction systems on the IES based on specific scenarios. The conclusion is drawn in Conclusion.
Modeling of Carbon Reduction System
Carbon capture technologies include pre-combustion, oxygen-enriched combustion, and post-combustion. Among them, post-combustion capture has been widely used due to its low retrofitting cost and broad applicability and is thus adopted in this study.
Process of Carbon Capture
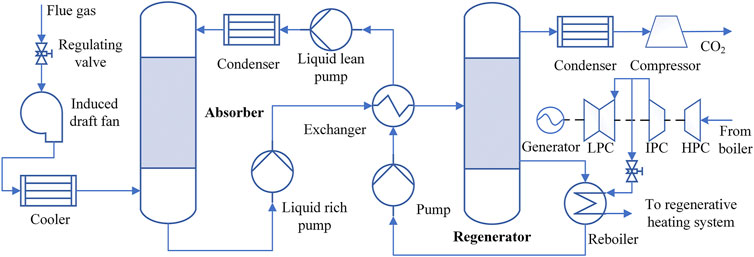
Figure 1 shows the brief scheme of CCS. The cooled flue gas enters the absorber tower from the bottom and reacts chemically with the absorbent sprayed from the top. CO2 is captured by the chemical absorbent inside the tower, and the flue gas is led out of the absorbent tower and exhausted to the atmosphere through a cooler unit. The CO2-rich absorber solution, which is called rich liquid, is pumped to the regeneration tower to separate CO2. The discharged CO2 gas is liquefied, pressurized, and sealed. The separated solvent is re-boiled and pressurized for recycling. The energy supply of the reboiler comes from the extracted steam at the outlet of the immediate pressure cylinder. The exothermic steam is returned to the regenerative heating system of the CPP unit.
Operating Cost of Carbon Capture System
The CCS system can consume and store the CO2 exhausted by the power plants. Before studying the energy consumption of the CCS system, the total amount of CO2 must be analyzed. The CO2 exhausted from the units consists of two main components: one is generated through coal combustion, and the other is through the desulfurization process. The flow rate of CO2 generated by the coal combustion process (
where M is the relative molecular mass,
During the desulfurization process, the flow rate of the CO2 generated by the desulfurization process is related to SO2. For per mol of SO2 desulfurization, 1 mol of CO2 is produced. Therefore, the flow rate of the CO2 generated by the desulfurization (
where
Combined with the above equations, the amount of CO2 emission (
The flow of flue gas entering the CCS system can be adjusted by the inlet regulating valve. If the valve’s position is
where
The decarburization efficiency and reboiler temperature are controlled in the carbon capture process by adjusting the lean liquid flow rate and the extraction steam flow rate (Wu et al., 2018). Assuming that the decarburization efficiency remains unchanged, the extraction steam flow rate can be expressed by the captured CO2 flow rate. The influence of the extraction steam flow rate on the electric power output can refer to the static analysis of the power-heat conversion of the CHP unit. Therefore, the electric power consumed by the carbon capture process (
where
In addition, the start-up of the CCS system requires a power supply (
where
Power-Carbon Characteristic
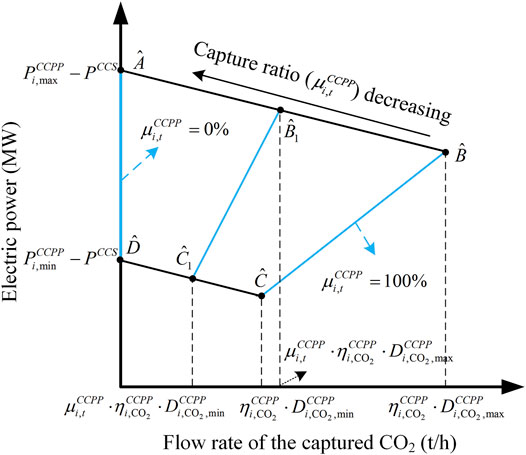
The relationship between the net electric power and flow rate of the captured CO2, called power-carbon characteristic, can be obtained in Figure 2. In this figure, the area
where
Similarly, the line
where
It is noted that the CCS system has the maximum capture ratio at the line
Regulation Capacity of Carbon Capture Power Plant
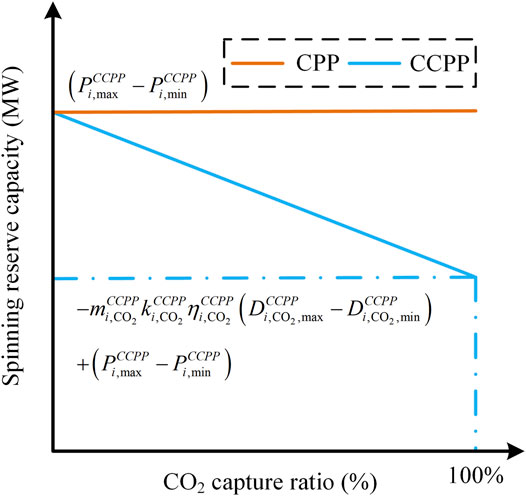
Based on the above analysis, with the condition that the carbon capture rate is maintained constant during the entire power system dispatch, the spinning reserve capacities of CPP and CCPP at each carbon capture ratio can be obtained, which is shown in Figure 3.
It can be seen from Figure 3 that when the carbon capture system is not added, the CPP unit has no additional power consumption and the adjustable capacity has been maintained at
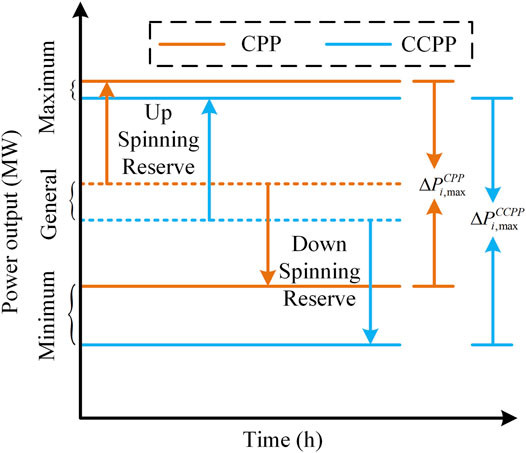
From Eq. 9, it can be seen that if the carbon capture rate cannot be dispatched, the adjustment range of the unit will decrease as the capture rate increases. However, by adjusting the boiler load and the inlet flue gas regulating valve of the carbon capture system, the CO2 emission flow rate can be reduced, and the net power connected to the power grid can be adjusted flexibly. Figure 4 shows the maximum regulation capacities of CPP (
Therefore, compared with CPP, CCPP has a broader power regulation range after introducing the carbon capture system, which provides more flexibility for the operation of the power system and is conducive to consuming more renewable energy.
Modeling of Pollutant Reduction System
Many kinds of pollutants are produced by coal-fired power plants. Among them, SO2 and NOx have a substantial impact on the environment. To explore the treatment cost of pollutants, it is necessary to analyze the mass flow rates and concentrations of pollutants. The difference between the CHP unit and the CCPP unit is that the steam at the outlet of the medium pressure cylinder is used for heating or decarbonization. The basic principle of boiler combustion is the same. Therefore, we will take the CCPP unit as an example for analysis.
Mass Flow Rates of Pollutants
As a direct factor affecting the concentration of pollutants, the mass flow rates of SO2 and NOx are related to the percentage of sulfur and nitrogen in coal, respectively.
where
Generally, the main components of NOx are NO and NO2. If the ratio of NO in NOx is
Volume Flow Rate of the Flue Gas
Another factor that affects the concentrations of pollutants in the flue gas is the volume flow rate of flue gas. It is related to the real-time coal consumption of the unit, which can be expressed as:
where
where
The theoretical air volume flow required in the coal combustion process depends on the content of each element in the coal, which can be expressed as:
With the theoretical air supplied, if the coal is entirely burned, the flue gas is composed of CO2, SO2, NOx, N2, and H2O, and theoretical flue gas volume is expressed as follows:
where
Modeling of the Pollutants Treatment Process
The wet desulfurization method of limestone has been widely used in the desulfurization process of CCPPs. During the desulfurization process, every mol of SO2 will consume 1 mol of CaCO3. Thus, the mass flow rates of CaCO3 in the
where
Generally, the SCR reactor is used for denitrification. NH3 can reduce NOx to N2 under the action of the catalyst. During the reaction process, 1 mol of NH3, and per mol of NO2 consume 2 mol of NH3. Thus, the mass flow rate of NH3 in
where
After desulfurization and denitrification, the concentrations of SO2 (
Similarly, for the
As seen from Eqs 24–27, the ultra-low emission concentration is determined by the desulfurization and denitrification efficiencies. The consumption of limestone and ammonia injection varies with emission requirements.
Modeling of IES
IES Configuration
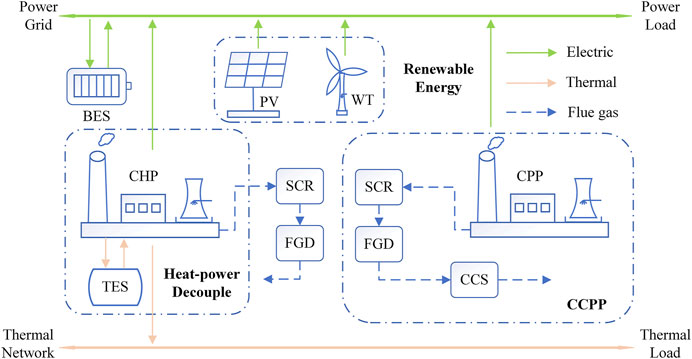
The integrated energy system containing electricity and heat is required to maintain the energy supply and demand balance in a specific area. Figure 5 shows the structure of a low-pollutant and low-carbon IES, which includes conventional IES and carbon and pollutant reductions systems. In the IES, the distributed power load is supplied by various forms of power generations, such as CCPPs, CHP units, WTs, and PVs. The district thermal load of consumers is provided by the CHP units. In terms of curbing pollutant emissions, CCPPs integrate CPP and CCS to effectively reduce carbon emissions, and the high FGD and SCR efficiencies allow for a remarkably reduction of pollutant emissions. In addition, introducing a BES system stabilizes the fluctuation of RESs, and TES system facilitates the heat–power decoupling of CHP units and maintains a specific peak regulation capacity during the heating supply season.
In the succeeding sections, each subsystem’s operating cost and constraint in an integrated energy system will be analyzed step by step.
Objective Function
The proposed energy management system aims to supply both thermal and electric power with respect to the economic and environmental criteria. The objective function is the operating costs of the IES. It involves the cost of various energy form generations. The objective function (J) can be written as follows:
where C1 is the operating cost of the CCPP and CHP units, C2 is the renewable curtailment penalty cost, and C3 is the pollutant treatment cost of the CCPP and CHP units.
Operating Cost
Generally, for the
where
For the
where
In summary, the coal costs of the CCPP and CHP units can be expressed as follows:
where T is the dispatch time, NG and NC are the numbers of the CCPP and CHP, respectively.
Renewable Curtailment Penalty Cost
Although the grid should be connected to as much renewable power as possible, thermal power and other energy sources may be insufficient to compensate for wind power fluctuation due to the random volatility of wind power. At this time, some renewable power plants will be shut down, which is not conducive to renewable energy consumption. Therefore, the penalty cost of renewable power curtailment must be calculated as follows:
where
If
Pollutant Treatment Cost
According to Eqs 24–27, the pollutant treatment cost includes the cost of treating SO2 and NOx for the CCPP and CHP units, that is,
Constraints
The constraints of the objective function are listed as follows.
(1) Power balance
During the operation of IES, the supply and load of electricity and heat need to be balanced separately:
where
(2) Operating region
The power generation units cannot exceed their upper and lower limits during operation. For CCPPs, WT, and PV plants, the limits are listed as follows:
where subscripts min and max are the minimum and maximum powers of various power generations, respectively.
The electric power output of the CHP units is related to the thermal power output. The operating region can be represented as follows:
where (
(3) Power ramp rate
For the coal-fired power plants, the power output ramp rate is limited within a specific range to ensure the safe operation of the unit.
where
(4) Pollutant ultra-low emission
During the operation of coal-fired units, the concentrations of pollutant emissions must meet the environmental requirements.
where
(5) Energy Storage System
Given that ESS can be used as a load device during charging and as a power or thermal source during discharging, it is often used as a flexible regulating system and is widely used in the dispatch of the IES. During the operation of ESS, its capacity has a reasonable boundary to expand the lifetime, which is expressed as follows:
where
The state of ESS is related to the state of the previous moment and the rate of charge and discharge and can be calculated as follows:
where
where
To prepare for the next dispatch, the final state capacity should be equal to the initial capacity of ESS, which is:
where the subscripts 0 and one represent the initial and final moment in the dispatch period.
Solution
After obtaining the objective function and operating constraints, the optimal dispatch of IES for economic and environmental benefits can be solved by fmincon solver in MATLAB, which is an effective method to solve nonlinear optimization problems.
Case Study
System Description
The IES in this study has 5 × 600 MW CCPPs, 7 × 90 MW wind farms, 7 × 60 MW PV farms, and 3 × 200 MW extraction CHP units. The proportion of RESs reaches 32.2%. The maximum energy capacities of BES and TES systems are 50 and 150 MWh, with maximum energy conversion rates of 25 and 60 MW, respectively.
For computational convenience, the CCPP and CHP units have the same characteristics, respectively. The coal consumption rate of the CCPPs at the typical power is shown in Supplementary Table S1. The coal consumption rate coefficient of the CHP units is set based on (Haghrah et al., 2016).
The penalty coefficients are the critical parameters, indicating that IES will try to reduce renewable energy curtailment. To promote renewable energy penetration, while considering the appropriate proportion of the curtailment cost renewable energy in the total cost,
The parameters of decarburization, desulfurization and denitrification are shown in Supplementary Table S2. For the CCS, this study assumes that the carbon capture efficiency remains unchanged, so that the CCS can adjust the capture ratio to consume renewable power generation.
The day-ahead dispatch of the IES is based on the forecasted renewable energy output and load demand for each period of the day in the future. Supplementary Figures S1, S2 show that the forecast load demand and renewable power generations, respectively.
Dispatch Results of Electric and Thermal Power
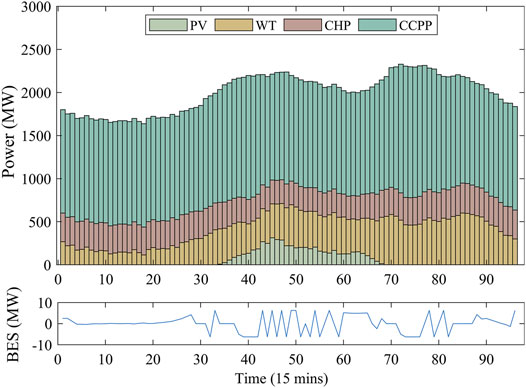
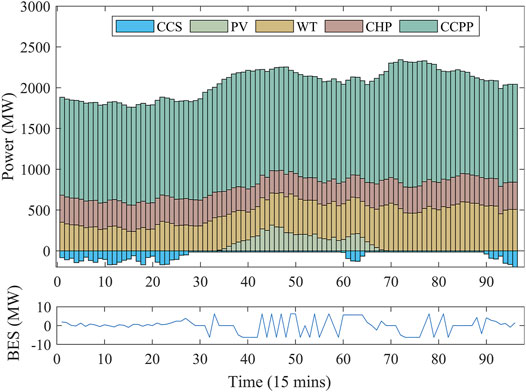
To analyze and verify the impact of CCS on the IES dispatch, two scenarios are set up. Keeping the other elements in IES consistent, the conventional power plants and carbon capture power plants are used for Scenarios 1 and 2, respectively.
Figures 6, 7 show that the power dispatch results in Scenarios 1 and 2, respectively. From these figures, in the morning and evening, the load demand is low, while the wind power output is high at this time, resulting in an imbalance between power demand and supply. In addition, the PV power output reached its maximum at noon, which caused the power grid not to be able to consume it entirely. Due to the power regulation of CCS, the net output of CCPPs can be further reduced, enabling more wind and PV power output to be connected to the power grid.
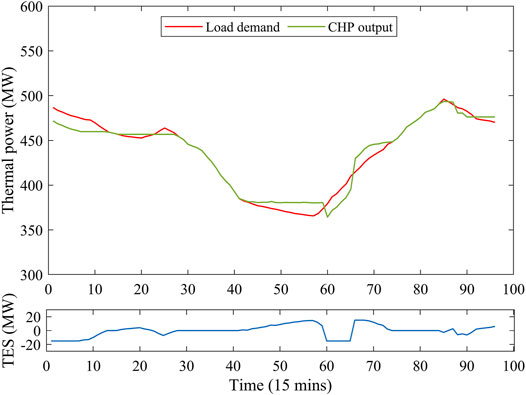
The high wind power in the morning and evening requires the CHP units to have a low electric power output. Meanwhile, the thermal power output of the CHP units must be sufficient to meet the higher thermal load requirements in the morning and evening. Figure 8 shows the dispatch results of thermal demand and supply. This figure indicates that the heat output of the CHP units is less than the load in the morning and evening, and TES compensates for this difference by exothermic heat. Similarly, in the middle of the day when the heat demand is low, the CHP units generate excess heat to supply the heat storage of TES. Through heat release and storage, TES can achieve heat–power decoupling.
Effect Analysis of the CCS
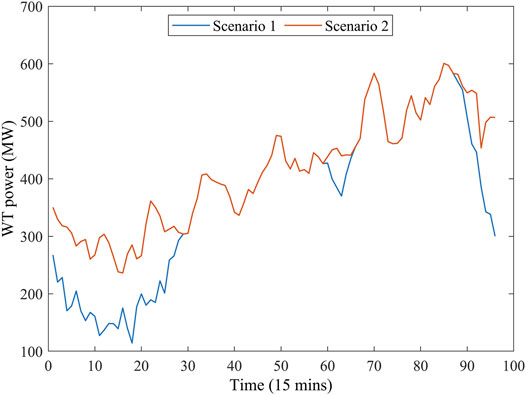
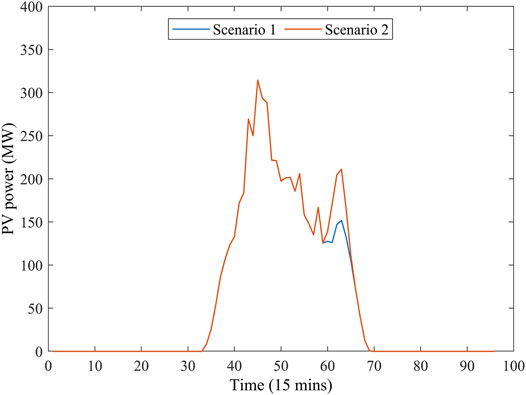
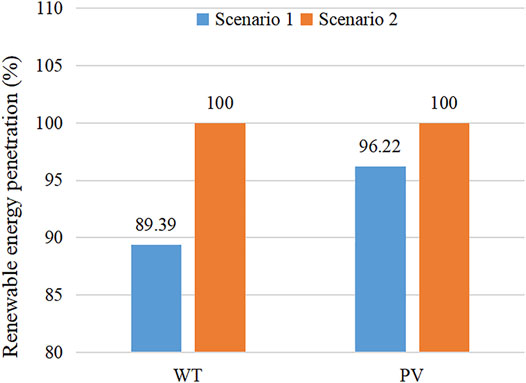
According to the results of electric power dispatch, the addition of carbon capture systems can promote the penetration of renewable energy. Figures 9, 10 show the renewable energy output under Scenarios 1 and 2. From this figure, in Scenario 2, the power acceptance capacity of renewable energy increases, and the curtailment rates of wind and PV power decrease. Compared with the forecast data of renewable power generation, the penetration rates of wind and PV power in the IES can be increased by 10.61 and 3.78%, as shown in Figure 11.
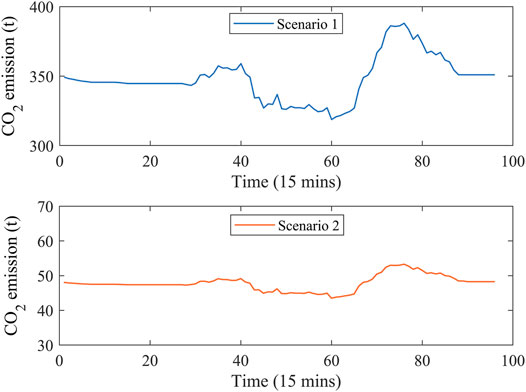
Figure 12 shows the carbon emissions of the IES in a dispatch cycle under Scenarios 1 and 2. From the figure, at each dispatch time, the CO2 emissions under Scenario 2 are about 300 t less than that under Scenario 1. During the dispatch period, the total CO2 emissions of IES in Scenario 2 are reduced by 28,812.7 t compared with Scenario 1.
The costs of IES in Scenarios 1 and 2 are shown in Table 1. From this table, after introducing the carbon capture system, the direct operating cost and pollutants treatment cost tend to increase due to the power consumption of CCS. However, the IES in Scenario 1 has a higher penalty cost for renewable energy curtailment, resulting in a higher total cost than Scenario 2.
Effect analysis of the pollutant ultra-low emissions
Pollutant ultra-low emissions is achieved by retrofitting the pollutant treatment system to improve the efficiencies of FGD and SCR. Ignoring the retrofitting cost, we will only analyze the difference in the pollutants treatment cost before and after retrofitting in this study. Table 2 represents the pollutant parameters before and after ultra-low emission retrofitting. It can be seen that, the efficiencies of FGD and SCR, respectively increase by 2.882 and 5.949% after the retrofit. Due to the reduction in pollutant emissions, more SO2 and NOx have to be removed by FGD and SCR, resulting in more treatment consumption of 2,899.6 USD.
The pollutant emissions in each dispatch moment before and after ultra-low emission are represented in Figure 13. From this figure, pollutant emissions have been significantly reduced after the renovation. By calculation, SO2 and NOx are reduced by 1.87 t and 6.24 t, respectively.
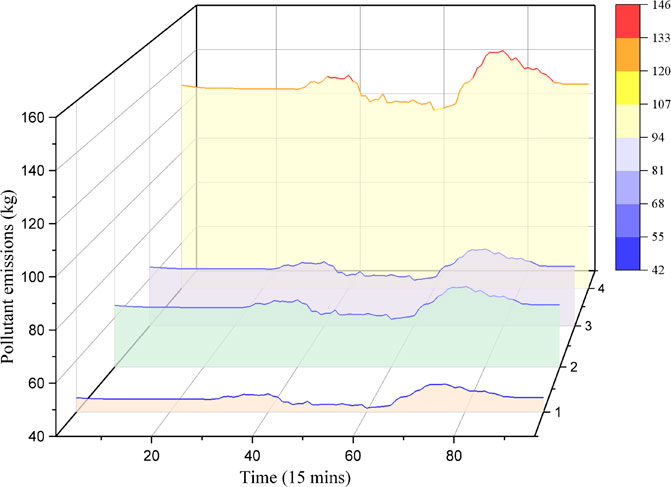
FIGURE 13. Pollutant emissions before and after ultra-low emission (1: SO2 after ultra-low emission; 2: NOx after ultra-low emission; 3: SO2 before ultra-low emission; 4: NOx before ultra-low emission).
Conclusion
In this study, the model and optimal dispatch of the integrated energy system are studied. By introducing the carbon and pollutants reduction systems, the renewable energy penetration and containment of pollutant emissions can be promoted substantially. On the one hand, the carbon system can reduce carbon emission by capturing CO2 and reducing the unit’s minimum output by extracting the steam at the outlet of the immediate pressure cylinder. After introducing the carbon capture system, the penetration rates of wind power and photovoltaics have increased by 10.61 and 3.78%, respectively, and CO2 emissions have been reduced by 28,812.7 t, which will increase the cost of operating and pollutants treatment by 4,102.4 USD. On the other hand, pollutants’ ultra-low emission is achieved by retrofitting the pollutant treatment system to improve the efficiencies of desulfurization and denitrification. After the retrofit, the efficiencies of desulfurization and denitrification respectively are increased by 2.882 and 5.949%, and the pollutant emissions have been significantly reduced by 1.87 t and 6.24 t, respectively, which will increase the cost of pollutants treatment by 2,899.6 USD.
Data Availability Statement
The raw data supporting the conclusion of this article will be made available by the authors, without undue reservation.
Author Contributions
GZ: Conceptualization, Methodology, Original draft. PX: Software Data curation, Reviewing and Editing. SH: Reviewing and Editing. ZC: Reviewing and Editing. MD: Reviewing and Editing. NT: Reviewing. YN: Reviewing. FH: Reviewing.
Funding
This research was supported by the National Natural Science Foundation of China (No. 52006062), the Fundamental Research Funds for the Central Universities (2019MS071) and the science and technology innovation project supported by the China Energy Group Co., Ltd (GJNY-20-180). This study received funding from the China Energy Group Co., Ltd (GJNY-20-180). The funder was not involved in the study design, collection, analysis, interpretation of data, the writing of this article or the decision to submit it for publication.
Conflict of Interest
The authors declare that the research was conducted in the absence of any commercial or financial relationships that could be construed as a potential conflict of interest.
Publisher’s Note
All claims expressed in this article are solely those of the authors and do not necessarily represent those of their affiliated organizations, or those of the publisher, the editors and the reviewers. Any product that may be evaluated in this article, or claim that may be made by its manufacturer, is not guaranteed or endorsed by the publisher.
Supplementary Material
The Supplementary Material for this article can be found online at: https://www.frontiersin.org/articles/10.3389/fenrg.2021.767277/full#supplementary-material
References
Anees, A., Dillon, T., Wallis, S., and Chen, Y.-P. P. (2021). Optimization of Day-Ahead and Real-Time Prices for Smart home Community. Int. J. Electr. Power Energ. Syst. 124. 106403. doi:10.1016/j.ijepes.2020.106403
Arya, Y. (2019). Effect of Energy Storage Systems on Automatic Generation Control of Interconnected Traditional and Restructured Energy Systems. Int. J. Energ. Res. 43, 6475–6493. doi:10.1002/er.4493
Bagheri, A., and Jadid, S. (2021). A Robust Distributed Market-Clearing Model for Multi-Area Power Systems. Int. J. Electr. Power Energ. Syst. 124. 106275. doi:10.1016/j.ijepes.2020.106275
Bayati, M., Abedi, M., Farahmandrad, M., and Gharehpetian, G. B. (2021). Delivering Smooth Power to Pulse-Current Battery Chargers: Electric Vehicles as a Case in Point. IEEE Trans. Power Electron. 36, 1295–1302. doi:10.1109/TPEL.2020.3005929
Chen, Z., Liu, J., Lin, Z., and Duan, Z. (2019). Closed-loop Active Power Control of Wind Farm Based on Frequency Domain Analysis. Electric Power Syst. Res. 170, 13–24. doi:10.1016/j.epsr.2019.01.003
Dai, Y., Chen, L., Min, Y., Chen, Q., Hao, J., Hu, K., et al. (2019). Dispatch Model for CHP with Pipeline and Building Thermal Energy Storage Considering Heat Transfer Process. IEEE Trans. Sustain. Energ. 10, 192–203. doi:10.1109/TSTE.2018.2829536
Eladl, A. A., and ElDesouky, A. A. (2019). Optimal Economic Dispatch for Multi Heat-Electric Energy Source Power System. Int. J. Electr. Power Energ. Syst. 110, 21–35. doi:10.1016/j.ijepes.2019.02.040
Haghrah, A., Nazari-Heris, M., and Mohammadi-Ivatloo, B. (2016). Solving Combined Heat and Power Economic Dispatch Problem Using Real Coded Genetic Algorithm with Improved Mühlenbein Mutation. Appl. Therm. Eng. 99, 465–475. doi:10.1016/j.applthermaleng.2015.12.136
Li, Y., Miao, S., Yin, B., Han, J., Zhang, S., Wang, J., et al. (2019). Combined Heat and Power Dispatch Considering Advanced Adiabatic Compressed Air Energy Storage for Wind Power Accommodation. Energ. Convers. Manage. 200. 112091. doi:10.1016/j.enconman.2019.112091
Liu, M., Wang, S., Zhao, Y., Tang, H., and Yan, J. (2019). Heat-power Decoupling Technologies for Coal-Fired CHP Plants: Operation Flexibility and Thermodynamic Performance. Energy 188.116074. doi:10.1016/j.energy.2019.116074
Liu, Y., Xiao, L., Wang, H., Dai, S., and Qi, Z. (2013). Analysis on the Hourly Spatiotemporal Complementarities between China's Solar and Wind Energy Resources Spreading in a Wide Area. Sci. China Technol. Sci. 56, 683–692. doi:10.1007/s11431-012-5105-1
Löschenbrand, M. (2021). A Transmission Expansion Model for Dynamic Operation of Flexible Demand. Int. J. Electr. Power Energ. Syst. 124. 106252. doi:10.1016/j.ijepes.2020.106252
Lu, X., McElroy, M. B., Peng, W., Liu, S., Nielsen, C. P., and Wang, H. (2016). Challenges Faced by China Compared with the US in Developing Wind Power. Nat. Energ. 1, 1–6. doi:10.1038/nenergy.2016.61
Ma, H., Yan, Z., Member, S., Li, M., Han, D., Han, X., et al. (2019). Benefit Evaluation of the Deep Peak-Regulation Market in the Northeast china Grid. Csee Jpes 5, 533–544. doi:10.17775/cseejpes.2015.01330
Nguyen, T. T., Nguyen, T. T., Duong, M. Q., and Doan, A. T. (2020). Optimal Operation of Transmission Power Networks by Using Improved Stochastic Fractal Search Algorithm. Neural Comput. Applic 32, 9129–9164. doi:10.1007/s00521-019-04425-0
Rodríguez, R. A., Becker, S., Andresen, G. B., Heide, D., and Greiner, M. (2014). Transmission Needs across a Fully Renewable European Power System. Renew. Energ. 63, 467–476. doi:10.1016/j.renene.2013.10.005
Sinsel, S. R., Riemke, R. L., and Hoffmann, V. H. (2020). Challenges and Solution Technologies for the Integration of Variable Renewable Energy Sources-A Review. Renew. Energ. 145, 2271–2285. doi:10.1016/j.renene.2019.06.147
Wang, L., Jing, Z. X., Zheng, J. H., Wu, Q. H., and Wei, F. (2018). Decentralized Optimization of Coordinated Electrical and thermal Generations in Hierarchical Integrated Energy Systems Considering Competitive Individuals. Energy 158, 607–622. doi:10.1016/j.energy.2018.05.200
Wang, W., Huang, S., Zhang, G., Liu, J., and Chen, Z. (2021a). Optimal Operation of an Integrated Electricity-Heat Energy System Considering Flexible Resources Dispatch for Renewable Integration. J. Mod. Power Syst. Clean. Energ. 9, 699–710. doi:10.35833/mpce.2020.000917
Wang, W., Liu, L., Liu, J., and Chen, Z. (2020b). Energy Management and Optimization of Vehicle-To-Grid Systems for Wind Power Integration. Csee Jpes 7, 172–180. doi:10.17775/CSEEJPES.2020.01610
Wu, X., Shen, J., Li, Y., Wang, M., and Lawal, A. (2018). Flexible Operation of post-combustion Solvent-Based Carbon Capture for Coal-Fired Power Plants Using Multi-Model Predictive Control: A Simulation Study. Fuel 220, 931–941. doi:10.1016/j.fuel.2018.02.061
Wu, Y., Fu, L., Zhang, S., and Tang, D. (2019). Study on a Novel Co-operated Heat and Power System for Improving Energy Efficiency and Flexibility of Cogeneration Plants. Appl. Therm. Eng. 163. 114429. doi:10.1016/j.applthermaleng.2019.114429
Yao, X., Zhong, P., Zhang, X., and Zhu, L. (2018). Business Model Design for the Carbon Capture Utilization and Storage (CCUS) Project in China. Energy Policy 121, 519–533. doi:10.1016/j.enpol.2018.06.019
Yin, S., Zhang, S., Andrews-Speed, P., and Li, W. (2017). Economic and Environmental Effects of Peak Regulation Using Coal-Fired Power for the Priority Dispatch of Wind Power in China. J. Clean. Prod. 162, 361–370. doi:10.1016/j.jclepro.2017.06.046
Zhang, B., Hu, W., Cao, D., Huang, Q., Chen, Z., and Blaabjerg, F. (2019). Deep Reinforcement Learning-Based Approach for Optimizing Energy Conversion in Integrated Electrical and Heating System with Renewable Energy. Energ. Convers. Manage. 202. 112199. doi:10.1016/j.enconman.2019.112199
Zhang, X., and Zhang, Y. (2020). Environment-friendly and Economical Scheduling Optimization for Integrated Energy System Considering Power-To-Gas Technology and Carbon Capture Power Plant. J. Clean. Prod. 276. 123348. doi:10.1016/j.jclepro.2020.123348
Keywords: carbon reduction, pollutant reduction, renewable energy penetration, carbon capture and storage, pollutants ultra-low emission, integrated energy system
Citation: Zhang G, Xie P, Huang S, Chen Z, Du M, Tang N, Niu Y and Hong F (2021) Modeling and Optimization of Integrated Energy System for Renewable Power Penetration considering Carbon and Pollutant Reduction Systems. Front. Energy Res. 9:767277. doi: 10.3389/fenrg.2021.767277
Received: 30 August 2021; Accepted: 10 November 2021;
Published: 17 December 2021.
Edited by:
Zhi-Gang Su, Southeast University, ChinaCopyright © 2021 Zhang, Xie, Huang, Chen, Du, Tang, Niu and Hong. This is an open-access article distributed under the terms of the Creative Commons Attribution License (CC BY). The use, distribution or reproduction in other forums is permitted, provided the original author(s) and the copyright owner(s) are credited and that the original publication in this journal is cited, in accordance with accepted academic practice. No use, distribution or reproduction is permitted which does not comply with these terms.
*Correspondence: Feng Hong, aG9uZ2ZAbmNlcHUuZWR1LmNu
 Guangming Zhang
 Peiran Xie
 Shuhao Huang1
 Zhenyu Chen