- College of Oil and Gas Engineering, Shengli College China University of Petroleum, Dongying, China
Small-scale natural gas liquefaction processes have several clear advantages, particularly in the exploitation of ‘unconventional’ natural gas (NG) from sources such as difficult-to-access and offshore gas fields. Moreover, conventional liquefaction processes have a number of disadvantages such as high energy consumption, large cooling loads required in the refrigeration cycle, and non-uniform matching of cold and hot flows in liquified natural gas (LNG) heat exchanger (HE). The main objective of this study was to optimize the most commonly used mixed refrigerant process. The liquefaction performance of the optimized process was analyzed and the influence of gas parameters on the power consumption, exergy loss, freezing mixture circulation, and cooling water load were investigated. The results show that compressor power consumption can be reduced by 29.8%, the cooling water load can be reduced by 21.3%, and the system exergy efficiency can be increased by 41% with the optimized process. Furthermore, throttling and compression of the freezing mixture were increased during the refrigeration stage. It can be concluded that reducing the feed gas temperature and increasing the feed gas pressure can reduce the total power consumption, exergy loss, freezing mixture circulation, and cooling water load, which can significantly improve liquefaction performance.
Introduction
Global energy demand has rapidly increased over the past few decades and is expected to increase further in the coming years. Global energy consumption statistics show that the demand for oil is declining, and the search for alternative sources of energy is ushering in a golden age of natural gas (NG) (Wang Z. et al., 2020; Li et al., 2021). While natural gas is typically used in densely populated, economically developed areas, natural gas reserves are often located in remote areas, creating a regional imbalance between production and consumption regions. It is also worth noting that there are many operational challenges in transporting offshore natural gas to land (Cao and Bian, 2019; Zaitsev et al., 2020).
The specific volume of liquefied natural gas (LNG) is about 1/625 that of gaseous natural gas, which presents a considerable advantage in terms of the transportation, storage, and utilization of natural gas (He et al., 2019; Uwitonze et al., 2020). The LNG industry has developed rapidly around the world recently. Accordingly, the design and development of liquefaction processes are of significant importance, particularly small-scale NG liquefaction processes, which could offer significant value in the development of shale gas and coalbed methane, peak shaving of natural gas, and remote gas fields (Ikealumba and Wu, 2014). Various processes have been proposed for natural gas liquefaction. Conventional processes include mixed refrigerant (MR) process (Lee and Moon, 2017; Ghorbani et al., 2018; Brodal et al., 2019; Primabudi et al., 2019), cascade process (Eiksund et al., 2018), and expander-based process (Song et al., 2017; Zhang et al., 2020). Among these, the MR process is the most commonly used (He et al., 2018). Recently, Bian et al. (Bian et al., 2018; Bian et al., 2019) investigated the feasibility of using supersonic separation technology in the field of natural gas liquefaction, which provides the possibility of save space and simplifying the liquefaction process, and applied this technology (Bian et al., 2020a; Bian et al., 2020b; Liu et al., 2021).
Thermodynamic parameters of the natural gas liquefaction process can be obtained through numerical simulations, then the process can be thermodynamically analyzed using appropriate evaluation methods and indicators. Mafi et al. (2009) established a thermodynamic model of the liquefaction process and adopted the coefficient of performance (COP) and exergy efficiency as evaluation indicators. To improve the efficiency of the proposed liquefaction process, Kanoglu et al. (2008) established an exergy balance equation for the equipment and calculated the exergy loss of the cascade liquefaction process. Moreover, Kanoglu et al. (Remeljej and Hoadley, 2006) simulated various small-to medium-scale natural gas liquefaction processes and showed that the single-stage mixed refrigerant (SMR) process is a simple and efficient process and can be considered as an appropriate choice for small-to medium-sized liquefaction plants. Shukri and Barclay (2007) analyzed the characteristics of SMR and demonstrated that the SMR process is suitable for onshore and offshore liquefaction plants with capacities of less than 1.5×10⁶ t/y and 1.2×10⁶ t/y, respectively. Barclay and Denton (2005) compared offshore and onshore liquefaction plants and found that expansion refrigeration is an appropriate option for floating liquefaction plants.
Further investigations have revealed that there many significant parameters involved in natural gas liquefaction and the performances of liquefaction systems vary greatly with these parameters. Moreover, the freezing mixture composition and structure of the freezing mixture circulation system will affect the performance of the system. Accordingly, an optimization algorithm should be used to find the optimal process parameters and improve the performance of the liquefaction process. To address this, Angira and Santosh (2007) and Shah and Hoadley (2007) used numerical calculation methods to optimize the compression ratio. Nogal et al. (2008) and Lee et al. (2002) optimized the freezing mixture circulation process and compared liquefaction efficiencies and energy losses before and after optimization under different working conditions. Kamath et al. (2012) combined the internal equation of state code with a general algebraic modeling system (GAMS) and adopted nonlinear programming to optimize the SMR process. Wahl and Løvseth (2015) applied the sequential quadratic programming method to investigate the influence of the model formula on the SMR process optimization. Various aspects of the formula, including the optimization variables and their boundaries, internal node numbers, starting points, and derivative estimates, were studied. Tak et al. (2015) used a continuous reduced-order algorithm to optimize the SMR process and compared optimized compression system structures. Pattison and Baldea (2015) proposed an equation-based pseudo-transient method for LNG process optimization to solve the problem of numerical failures that often occur with equation-oriented frameworks. Furthermore, Tak et al. (2018) used the enthalpy feasibility method to improve convergence of the enthalpy-temperature calculation. Watson et al. (2018) proposed a non-differentiable model based on the interior point algorithm for optimizing the SMR system. Wang X. et al. (2020) designed a new type of pre-cooled MR process for small-scale skid-mounted LNG equipment to reduce energy consumption and increase exergy efficiency.
Small-scale natural gas liquefaction processes have remarkable advantages such as high efficiency, excellent flexibility, and good adaptability (Primabudi et al., 2019). Meanwhile, they are easy to operate. Based on the distribution of natural gas resources in the world, small-scale LNG plants have broad development prospects (Ghorbani et al., 2018). Unconventional natural gas from remote gas fields, offshore gas fields, and shale gas can provide gas sources for small-to medium-sized liquefaction plants. These plants can be used as a basis for continuous production and natural gas peak shaving. However, existing small-to medium-scale liquefaction processes for natural gas have a number of limitations, including high energy consumption, large cooling loads of freezing mixture circulation devices, and so on (Lee and Moon, 2017). To solve these problems, in the present study, small-to medium-sized liquefaction processes were optimized with the aim of designing and optimizing the SMR liquefaction process to improve the overall performance of the liquefaction system. The influence of natural gas parameters on the total power consumption, total exergy loss, refrigerant circulation, and cooling water load were considered and the liquefaction performance of the optimized process was analyzed.
Thermodynamic Analysis Model
Energy Analysis Model
The performance of the optimized process was evaluated using steady-state models in Aspen HYSYS V10 software designed to serve many processing industries including natural gas liquefaction (AspenTech (2011). Aspen H, 2011). The system was thermodynamically analyzed in terms of energy conversion, transfer, and utilization considering the quantitative correlation of energy, including liquefaction rate, cooling capacity, power consumption, and specific power consumption calculation, which are described as follows.
(1) Liquefaction rate.
Liquefaction rate is the ratio of LNG produced by the liquefaction system to feed gas entering the system, and can be mathematically expressed as:
where, ε, nLNG, and n denote the liquefaction rate of the system, molar flow rate of LNG produced by the system, and molar flow rate of inlet feed gas, respectively.
(2) Cooling capacity.
In the natural gas liquefaction system, the refrigeration capacity is equal to the sum of heat from natural gas absorbed by the freezing mixture circulating in the heat exchanger (HE), regardless of the heat loss. Accordingly, the theoretical cooling capacity can be expressed in the following form:
(3) Power consumption (W).
The power consumption is concentrated in the freezing mixture circulation unit and pressurization by the compressor and pump require an external source of energy. For liquefaction with an expander, the output power of the expander can be recycled during pressurization by the compressor. Therefore, when the power consumption of the compressor and pump (Wc) is greater than the output power of the expander (Ws), the total power consumption of the system is the difference between Wc and Ws. When Wc < Ws, the total power consumption of the system is 0.
The power consumption of the throttling refrigeration liquefaction process is equal to that of the compressor and pump:
Specific power consumption (Wn) is defined as the energy consumed to obtain 1 mole of LNG, which can be expressed as:
Exergy Analysis Model
Exergy refers to the maximum theoretical power that an entire system, composed of both the system and surroundings, can obtain when the system and the surroundings are in equilibrium (Moran et al., 2011). The specific exergy can be calculated using the following formula:
where, ex is the unit mass exergy, h is the unit mass enthalpy, T is temperature, and s is entropy.
During the liquefaction process, sources of exergy loss include the expansion, heat exchange and power equipment. The specific exergy loss can be written as:
The exergy utilization rate is used to measure the amount of exergy utilization in an open system, defined as the ratio of exergy utilization to total exergy. The amount of exergy utilization (Eu) is given by
The total amount of exergy is:
where, m is the mass flow rate.
The outlet exergy of the liquefaction process is:
The exergy loss during the liquefaction process is:
The exergy utilization rate is:
where, ηe is the exergy utilization rate.
Equation of State
The EOS is the basis for calculating the thermal parameters. Here, the Peng-Robinson (P-R) EOS is selected (Robinson et al., 1985), given by:
where, p is pressure, R is the universal gas constant, v is molar volume, a is the attractive parameter, and b is effective molecular volume. Parameters a and b can be expressed in the following forms:
where, z is mole fraction for the component and kij is the binary interaction coefficient.
Design and Optimization of Liquefaction Process
Conventional SMR Liquefaction Process
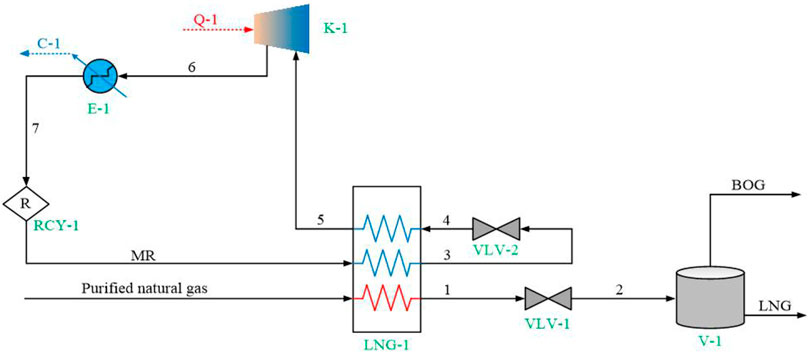
The SMR liquefaction process consists of three units: a natural gas liquefaction unit, MRC unit, and LNG storage unit. A SMR model, including an LNG HE, throttle valve, freezing mixture compressor, and cooler, was established in HYSYS, as shown in Figure 1. In the NG liquefaction unit, purified natural gas (4.5 MPa, 30°C) initially enters the cryogenic HE to obtain liquefied natural gas. During this process, the temperature reaches −165°C, the pressure is reduced to 0.1 MPa through the throttle, and the product is sent to the LNG storage tank. Table 1 shows that the freezing mixture in the cycle is composed of methane, ethane, propane, isobutane, and nitrogen. After pressurized cooling (4.3 MPa, 38°C), the freezing mixture enters the LNG HE, where it is cooled and liquefies. It is worth noting that freezing mixture flowing out of the LNG HE is in the pure liquid phase. The liquid freezing mixture is throttled to 0.5 MPa through throttle valve VLV-2, then flows back to the HE to provide the required cooling capacity. The freezing mixture absorbs heat and evaporates continuously in the HE. Finally, the freezing mixture flows out of the HE in the pure gas phase and goes back to the inlet of the compressor to complete the cycle.
Optimization of SMR Liquefaction Process
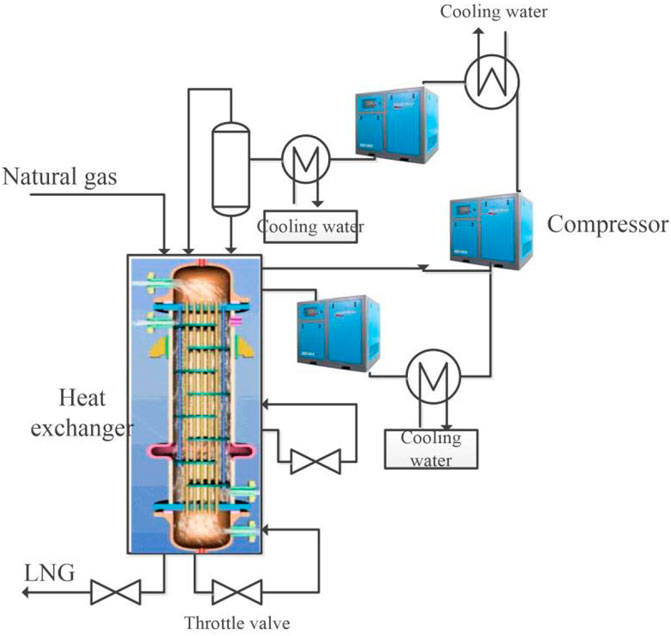
Figure 2 shows the liquefaction process after optimization. Compared with the original liquefaction process, the optimized process presents as follows:
(1) The pressurization system of the freezing mixture circulation is changed from one stage to three stages, and an intercooler is installed to reduce the energy loss of the compressor.
(2) The one stage throttling refrigeration is replaced by two stages. Two sets of LNG HE are set up. Then the MR streams is divided into two parts. The heavy liquid phase provides the cooling capacity of the pre-cooling HE, while the light gas phase provides the cooling capacity of the main HE. This modification increases the degree of matching of flows with different temperature and ensures a uniform temperature difference in the HE.
(3) The recombined freezing mixture is returned to the second-stage compressor to reduce the energy loss of the first-stage compressor.
The parameters of the natural gas inlet and LNG storage are the same as those presented in Conventional SMR Liquefaction Process. For the single-cycle refrigeration system, the refrigeration temperature range of the freezing mixture is −165°C–30°C. Moreover, a freezing mixture composed of nitrogen and light hydrocarbon components was selected in the simulation. Table 2 presents the chemical composition of the freezing mixture.
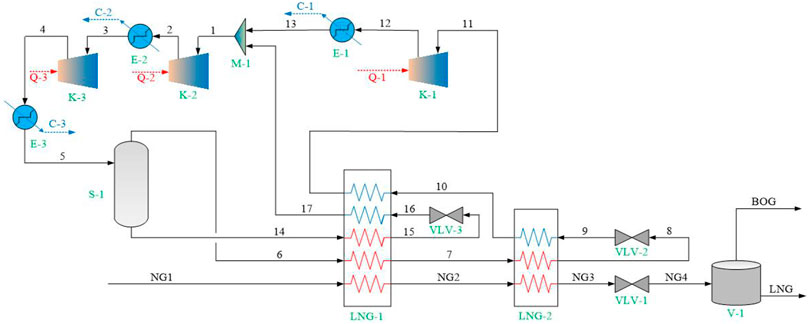
Figure 3 shows the established liquefaction process model in HYSYS. Two LNG HEs and three freezing mixture compressors were set up in the liquefaction process. Before entering the HE, the high-pressure freezing mixture was divided into two gas-liquid phases for cooling the pre-cooling HE and the main HE. Some of the freezing mixture from the pre-cooling HE flows back to the secondary compressor to reduce the pressurization load of the primary compressor. The P-R equation is used to calculate the physical properties of the natural gas and freezing mixture. In all calculations, the adiabatic efficiency of the compressor was set to 80% (Kwak et al., 2018). It is assumed that the material flow can achieve complete heat exchange in the LNG HE, the minimum heat exchange temperature difference is 2°C, and the outlet temperatures of the hot and cold flows are equal. Assuming that the heat loss of the HE is negligible and the pressure loss of the natural gas and freezing mixture in the HE was set to 20 kPa (Kochunni and Chowdhury, 2020). Moreover, it is assumed that there is no pressure loss in the equipment and pipelines except for the throttle valve (Abdul Qyyum et al., 2018). And the conversion between electrical energy and mechanical energy is 100% (Ferreira et al., 2017).
In the natural gas liquefaction unit, pretreated natural gas (4.5 MPa, 30°C) enters the HE and flows through pre-cooling HE, where the gas temperature drops to −30°C after heat exchange with the freezing mixture. Then, the natural gas flows into the main HE for further cooling and liquefaction. After passing through the two-stage HE, the LNG temperature drops to −156.5°C and the LNG is in the supercooled state. Finally, the LNG is depressurized by throttle valve VLV-3 to maintain a certain supercooling degree and sent to the LNG storage tank.
The freezing mixture cycle unit can be divided into two parts: the freezing mixture heat exchange process and freezing mixture pressurization process. In the freezing mixture heat exchange process, after pressure cooling, high-pressure freezing mixture (5.2 MPa, 30°C) passes through the gas-liquid separator to form liquid-phase freezing mixture flow (17) and gas-phase freezing mixture flow (4). The liquid phase flow (17) is cooled to −30°C by the HE, then throttled by the throttle valve to reduce the temperature and pressure. Then, the freezing mixture flows back to the HE to provide the cooling capacity for precooling of the natural gas and freezing mixture, before finally returning to the secondary compressor. Gas-phase flow (4) is cooled by HE to realize liquefaction, then throttled by throttle valve to reduce its temperature and pressure and flows back to HE to provide the cooling capacity for liquefaction of the natural gas and freezing mixture, and finally returns to primary compressor. The pressurization process of freezing mixture includes three stages. In the first stage, low-pressure freezing mixture (stream 9) flows back to compressor at 0.4 MPa, then its pressure increases to 1.3 MPa after the first pressurization stage. The inter-stage cooler is downstream from the compressor and cool the freezing mixture (stream 10) to 35°C. Stream 10 and the medium pressure freezing mixture return stream 20 are fully mixed and then the mixture enters the second-stage compressor for pressurization. After two-stage compression, the freezing mixture pressure is increased to 2.6 MPa and the high-pressure freezing mixture is cooled to 30°C and enters the freezing mixture heat exchange process.
Performance of Improved Liquefaction Process
Energy Consumption Analysis
Figure 4 shows the system performance parameters of the optimized NG liquefaction process. The freezing mixture circulation capacity of the improved liquefaction system and the total power consumption are 320.8 kmol/h and 602.0 kW, respectively. Moreover, the specific power consumption and cooling water load are 21.92 kJ/h and 3.59 ×10⁶ kJ/h, respectively. Compared with the conventional SMR liquefaction process, the compressor power consumption decreased by 29.8%, the cooling water load decreased by 21.3%, and the system exergy efficiency increased by 41% when the throttling stage and compression stage were adopted. Based on the analysis, it can be concluded that the performance of the optimized liquefaction system was significantly improved.
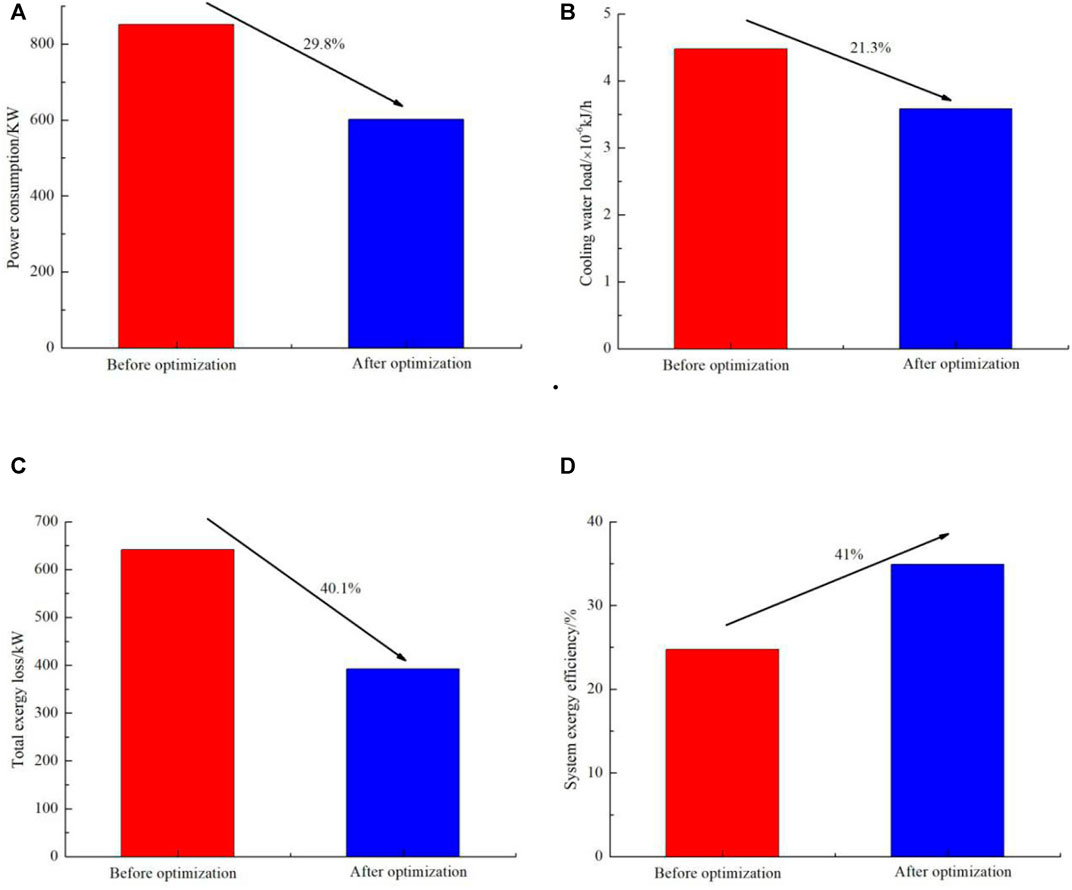
FIGURE 4. Comparison of liquefaction performance: (A) Power consumption, (B) Cooling water load, (C) Total exergy loss, (D) System exergy efficiency.
Influence of Gas Source Temperature on System Performance
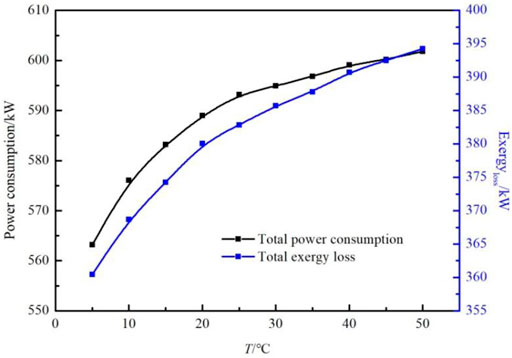
The enthalpy value at the inlet of the liquefaction system varies with the gas source temperature, cooling load in the HE, and freezing mixture circulation rate. The influence of gas source temperature, varying from 5°C to 50°C, on the total power consumption, total exergy loss, freezing mixture circulation capacity, and cooling water load of the process with a source pressure of 4.5 MPa, LNG storage pressure of 0.1 MPa, and temperature of −163.3°C was studied. The results are presented in Figures 5, 6.
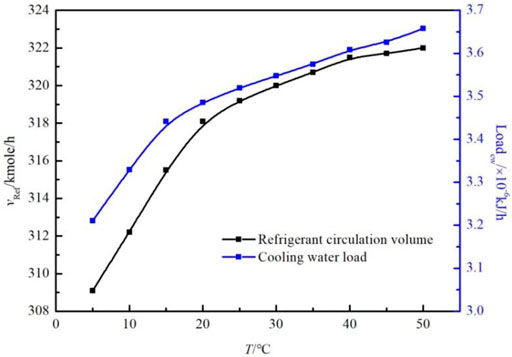
FIGURE 6. Influence of natural gas pressure on freezing mixture circulation capacity and cooling water load of the system.
As the gas source temperature increases, the total power consumption, total power loss, freezing mixture circulation capacity, and cooling water load of the system increase. When the gas source temperature increases from 5°C to 50°C, the total power consumption of the system increases from 563.2 to 601.8 kW, the total power loss increases from 360.44 to 394.26 kW, the freezing mixture circulation capacity increases from 309.1 kmol/h to 322.5 kmol/h, and the cooling water load increases from 3.21 kJ/h to 3.66 kJ/h. This is because when the inlet gas temperature increases, the enthalpy of the inlet gas increases, resulting in an increase in the enthalpy difference between the inlet and outlet gas in the liquefaction process, thereby increasing the required cooling capacity for liquefaction. The required cooling capacity is provided by the freezing mixture circulation. Assuming that the product of heat transfer area and heat transfer coefficient (UA) remains constant, the increase in refrigeration capacity will increase the freezing mixture circulation capacity, leading to an increase in compressor power consumption and cooling water load, and irreversibility of the system. Under these conditions, the total power consumption and total exergy loss increase.
Influence of Gas Source Pressure on System Performance
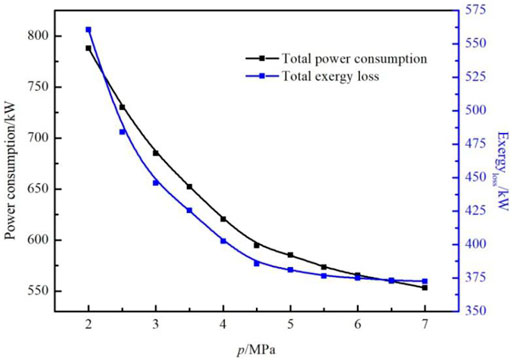
The effects of gas source pressure, varying from 2.0 to 7.0 MPa, on the total power consumption, total exergy loss, freezing mixture circulation, and cooling water load of the process with a gas source temperature of 30°C, LNG storage pressure of 0.1 MPa, and temperature of −163.3°C was studied. The results are presented in Figures 7, 8.
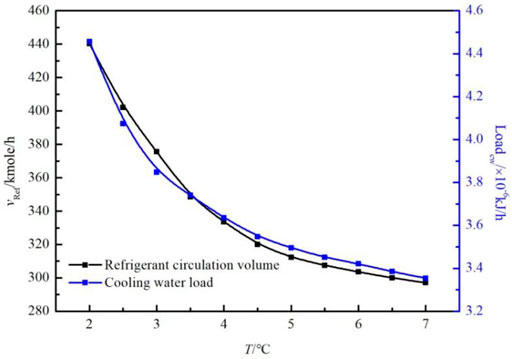
FIGURE 8. Influence of natural gas pressure on freezing mixture circulation rate and cooling water load of the system.
As the gas source pressure increases, the total power consumption, total exergy loss, freezing mixture circulation, and cooling water load decrease. The rate of decrease is high when the pressure varies from 2.0 to 4.5 MPa, whereas the rate of variation is gentle when the pressure varies from 4.5 to 7.0 MPa. As the gas source pressure increases from 2.0 to 7.0 MPa, the total power consumption of the system decreases from 788.7 to 553.2 kW, the total exergy loss decreases from 560.58 to 372.54 kW, the freezing mixture circulation quantity decreases from 440.2 kmol/h to 297.1 kmol/h, and the cooling water load decreases from 4.46 kJ/h to 3.25 kJ/h. This is because when the inlet gas pressure increases, the enthalpy of the natural gas decreases, while the state parameters of the produced LNG almost remain constant such that the enthalpy does not change. Therefore, a higher gas source pressure decreases the enthalpy difference in natural gas at the inlet and outlet of the liquefaction system (HNG-HLNG). Accordingly, the required cooling capacity of the natural gas liquefaction decreases. Based on this analysis, it can be concluded that the heat load of the refrigeration cycle decreases as the source gas pressure increases since the UA value of the HE remains constant while cooling capacity decreases. Consequently, the freezing mixture circulation capacity is reduced, thereby reducing the power consumption of the compressor and the cooling water load. Accordingly, the total power consumption and total exergy loss decrease.
Conclusion
In the present study, a steady-state model of the SMR liquefaction process was established. Mathematical modeling and numerical simulations were carried out in HYSYS and the thermodynamic performance of the system was analyzed. Furthermore, the structure of the conventional liquefaction process was optimized by setting the throttling stage of the freezing mixture and the compression stage of the refrigeration cycle. The freezing mixture circulation capacity of the improved liquefaction system and the total power consumption were 320.8 kmol/h and 602.0 kW, respectively. Moreover, the specific power consumption and the cooling water load were 21.92 kJ/h and 3.59 × 10⁶ kJ/h, respectively. Compared with the conventional SMR liquefaction process, the compressor power consumption was reduced by 29.8%, the cooling water load decreased by 21.3%, and the system exergy efficiency increased by 41% in the optimized process.
The effects of gas source parameters on the total power consumption, total exergy loss, freezing mixture circulation, and cooling water load of the improved liquefaction process were analyzed. The feed gas temperature was found to be positively correlated with total power consumption, freezing mixture circulation, and cooling water load. In contrast, feed gas pressure is negatively correlated with these parameters. Therefore, decreasing the feed gas temperature and increasing the feed gas pressure within a reasonable range can improve the performance of the liquefaction system.
In the next research, The liquefaction process will continue to be optimized for the purpose of saving land occupation, and the unit energy consumption, exergy efficiency and performance coefficient of the process will be calculated and compared, and the adaptability of the process at offshore will be analyzed].
Data Availability Statement
The original contributions presented in the study are included in the article/supplementary material, further inquiries can be directed to the corresponding author.
Author Contributions
XW designed the research scheme and wrote the paper; ZW proposed the topic of the article and designed the framework of the paper; XD is responsible for sorting out documents and revising papers; QG provided research funds; FL conducted the final review of the paper.
Funding
This work was supported by the Youth Innovation Team Science and Technology Development Program of Shandong Province Higher Educational Institutions (2019KJA024) and Science Development Funding Program of Dongying of China (DJ2020009).
Conflict of Interest
The authors declare that the research was conducted in the absence of any commercial or financial relationships that could be construed as a potential conflict of interest.
Publisher’s Note
All claims expressed in this article are solely those of the authors and do not necessarily represent those of their affiliated organizations, or those of the publisher, the editors and the reviewers. Any product that may be evaluated in this article, or claim that may be made by its manufacturer, is not guaranteed or endorsed by the publisher.
References
Abdul Qyyum, M., Qadeer, K., and Lee, M. (2018). Closed-Loop Self-Cooling Recuperative N2 Expander Cycle for the Energy Efficient and Ecological Natural Gas Liquefaction Process. ACS Sust. Chem. Eng. 6, 5021–5033. doi:10.1016/10.1021/acssuschemeng.7b04679
Angira, R., and Santosh, A. (2007). Optimization of Dynamic Systems: A Trigonometric Differential Evolution Approach. Comput. Chem. Eng. 31, 1055–1063. doi:10.1016/j.compchemeng.2006.09.015
Bian, J., Cao, X., Yang, W., Edem, M. A., Yin, P., and Jiang, W. (2018). Supersonic Liquefaction Properties of Natural Gas in the Laval Nozzle. Energy 159, 706–715. doi:10.1016/j.energy.2018.06.196
Bian, J., Cao, X., Yang, W., Gao, S., and Xiang, C. (2020). A New Liquefaction Method for Natural Gas by Utilizing Cold Energy and Separating Power of Swirl Nozzle. Aiche J. 66, 16811. doi:10.1002/aic.16811
Bian, J., Cao, X., Yang, W., Guo, D., and Xiang, C. (2020). Prediction of Supersonic Condensation Process of Methane Gas Considering Real Gas Effects. Appl. Therm. Eng. 164, 114508. doi:10.1016/j.applthermaleng.2019.114508
Bian, J., Cao, X., Yang, W., Song, X., Xiang, C., and Gao, S. (2019). Condensation Characteristics of Natural Gas in the Supersonic Liquefaction Process. Energy 168, 99–110. doi:10.1016/j.energy.2018.11.102
Brodal, E., Jackson, S., and Eiksund, O. (2019). Performance and Design Study of Optimized LNG Mixed Fluid Cascade Processes. Energy 189, 116207. doi:10.1016/j.energy.2019.116207
Cao, X., and Bian, J. (2019). Supersonic Separation Technology for Natural Gas Processing: A Review. Chem. Eng. Process. - Process Intensification 136, 138–151. doi:10.1016/j.cep.2019.01.007
Eiksund, O., Brodal, E., and Jackson, S. (2018). Optimization of Pure-Component LNG cascade Processes with Heat Integration. Energies 11, 202. doi:10.3390/en11010202
Ferreira, P. A., Catarino, I., and Vaz, D. (2017). Thermodynamic Analysis for Working Fluids Comparison in Rankine-type Cycles Exploiting the Cryogenic Exergy in Liquefied Natural Gas (LNG) Regasification. Appl. Therm. Eng. 121, 887–896. doi:10.1016/j.applthermaleng.2017.04.082
Ghorbani, B., Shirmohammadi, R., Mehrpooya, M., and Hamedi, M.-H. (2018). Structural, Operational and Economic Optimization of Cryogenic Natural Gas Plant Using NSGAII Two-Objective Genetic Algorithm. Energy 159, 410–428. doi:10.1016/j.energy.2018.06.078
He, T., Chong, Z. R., Zheng, J., Ju, Y., and Linga, P. (2019). LNG Cold Energy Utilization: Prospects and Challenges. Energy 170, 557–568. doi:10.1016/j.energy.2018.12.170
He, T., Karimi, I. A., and Ju, Y. (2018). Review on the Design and Optimization of Natural Gas Liquefaction Processes for Onshore and Offshore Applications. Chem. Eng. Res. Des. 132, 89–114. doi:10.1016/j.cherd.2018.01.002
Ikealumba, W. C., and Wu, H. (2014). Some Recent Advances in Liquefied Natural Gas (LNG) Production, Spill, Dispersion, and Safety. Energy Fuels 28, 3556–3586. doi:10.1021/ef500626u
Kamath, R. S., Biegler, L. T., and Grossmann, I. E. (2012). Modeling Multistream Heat Exchangers with and without Phase Changes for Simultaneous Optimization and Heat Integration. Aiche J. 58, 190–204. doi:10.1002/aic.12565
Kanoglu, M., Dincer, I., and Rosen, M. A. (2008). Performance Analysis of Gas Liquefaction Cycles. Int. J. Energ. Res. 32, 35–43. doi:10.1002/er.1333
Kochunni, S. K., and Chowdhury, K. (2020). Zero Methane Loss in Reliquefaction of Boil-Off Gas in Liquefied Natural Gas Carrier Ships by Using Packed Bed Distillation in Reverse Brayton System. J. Clean. Prod. 260, 121037. doi:10.1016/j.jclepro.2020.121037
Kwak, D.-H., Heo, J.-H., Park, S.-H., Seo, S.-J., and Kim, J.-K. (2018). Energy-efficient Design and Optimization of Boil-Off Gas (BOG) Re-liquefaction Process for Liquefied Natural Gas (LNG)-fuelled Ship. Energy 148, 915–929. doi:10.1016/j.energy.2018.01.154
Lee, G. C., Smith, R., and Zhu, X. X. (2002). Optimal Synthesis of Mixed-Refrigerant Systems for Low-Temperature Processes. Ind. Eng. Chem. Res. 41, 5016–5028. doi:10.1021/ie020057p
Lee, I., and Moon, I. (2017). Economic Optimization of Dual Mixed Refrigerant Liquefied Natural Gas Plant Considering Natural Gas Extraction Rate. Ind. Eng. Chem. Res. 56, 2804–2814. doi:10.1021/acs.iecr.6b04124
Li, Y., Wang, Y., Wang, Q., Liu, Z., Tang, L., Liang, L., et al. (2021). Achieving the Super Gas-Wetting Alteration by Functionalized Nano-Silica for Improving Fluid Flowing Capacity in Gas Condensate Reservoirs. ACS Appl. Mater. Inter. 13, 10996–11006. doi:10.1021/acsami.0c22831
Liu, Y., Cao, X., Yang, J., Li, Y., and Bian, J. (2021). Energy Separation and Condensation Effects in Pressure Energy Recovery Process of Natural Gas Supersonic Dehydration. Energ. Convers. Manag. 245, 114557. doi:10.1016/j.enconman.2021.114557
Mafi, M., Amidpour, M., and Mousavi Naeynian, S. M. (2009). Comparison of Low Temperature Mixed Refrigerant Cycles for Separation Systems. Int. J. Energ. Res. 33, 358–377. doi:10.1002/er.1480
Moran, M. J., Shapiro, H. N., Boettner, D. D., and Bailey, M. B. (2011). Fundamentals of Engineering Thermodynamics. Seventh ed. NJ: John Wiley & Sons.
Nogal, F. D., Kim, J.-K., Perry, S., and Smith, R. (2008). Optimal Design of Mixed Refrigerant Cycles. Ind. Eng. Chem. Res. 47, 8724–8740. doi:10.1021/ie800515u
Pattison, R. C., and Baldea, M. (2015). Multistream Heat Exchangers: Equation-Oriented Modeling and Flowsheet Optimization. Aiche J. 61, 1856–1866. doi:10.1002/aic.14766
Primabudi, E., Morosuk, T., and Tsatsaronis, G. (2019). Multi-objective Optimization of Propane Pre-cooled Mixed Refrigerant (C3MR) LNG Process. Energy 185, 492–504. doi:10.1016/j.energy.2019.07.035
Remeljej, C., and Hoadley, A. (2006). An Exergy Analysis of Small-Scale Liquefied Natural Gas (LNG) Liquefaction Processes. Energy 31, 2005–2019. doi:10.1016/j.energy.2005.09.005
Robinson, D. B., Peng, D.-Y., and Chung, S. Y.-K. (1985). The Development of the Peng - Robinson Equation and its Application to Phase Equilibrium in a System Containing Methanol. Fluid Phase Equilibria 24, 25–41. doi:10.1016/0378-3812(85)87035-7
Shah, N. M., and Hoadley, A. F. A. (2007). A Targeting Methodology for Multistage Gas-phase Auto Refrigeration Processes. Ind. Eng. Chem. Res. 46, 4497–4505. doi:10.1021/ie060868j
Shukri, T., and Barclay, M. (2007). Single Mixed Refrigerant Process Has Appeal for Growing Offshore Market. LNG J. 7, 35–37.
Song, R., Cui, M., and Liu, J. (2017). Single and Multiple Objective Optimization of a Natural Gas Liquefaction Process. Energy 124, 19–28. doi:10.1016/j.energy.2017.02.07310.1016/j.energy.2017.02.073
Tak, K., Kwon, H., Park, J., Cho, J. H., and Moon, I. (2018). A Multistream Heat Exchanger Model with Enthalpy Feasibility. Comput. Chem. Eng. 115, 81–88. doi:10.1016/j.compchemeng.2018.03.023
Tak, K., Lee, I., Kwon, H., Kim, J., Ko, D., and Moon, I. (2015). Comparison of Multistage Compression Configurations for Single Mixed Refrigerant Processes. Ind. Eng. Chem. Res. 54, 9992–10000. doi:10.1021/acs.iecr.5b00936
Uwitonze, H., Hwang, K. S., and Lee, I. (2020). Improving NGL Recovery Process with Dividing-wall Column for Offshore Applications. Chem. Eng. Process. - Process Intensification 147, 107747. doi:10.1016/j.cep.2019.107747
Wahl, P. E., and Løvseth, S. W. (2015). Formulating the Optimization Problem when Using Sequential Quadratic Programming Applied to a Simple LNG Process. Comput. Chem. Eng. 82, 1–12. doi:10.1016/j.compchemeng.2015.06.003
Wang, X., Li, M., Cai, L., and Li, Y. (2020). Propane and Iso-Butane Pre-cooled Mixed Refrigerant Liquefaction Process for Small-Scale Skid-Mounted Natural Gas Liquefaction. Appl. Energ. 275, 115333. doi:10.1016/j.apenergy.2020.115333
Wang, Z., Han, F., Ji, Y., and Li, W. (2020). Analysis on Feasibility of a Novel Cryogenic Heat Exchange Network with Liquid Nitrogen Regeneration Process for Onboard Liquefied Natural Gas Reliquefaction. Case Stud. Therm. Eng. 22, 100760. doi:10.1016/j.csite.2020.100760
Watson, H. A. J., Vikse, M., Gundersen, T., and Barton, P. I. (2018). Optimization of Single Mixed-Refrigerant Natural Gas Liquefaction Processes Described by Nondifferentiable Models. Energy 150, 860–876. doi:10.1016/j.energy.2018.03.013
Zaitsev, A., Mehrpooya, M., Ghorbani, B., Sanavbarov, R., Naumov, F., and Shermatova, F. (2020). Novel Integrated Helium Extraction and Natural Gas Liquefaction Process Configurations Using Absorption Refrigeration and Waste Heat. Int. J. Energ. Res 44, 6430–6451. doi:10.1002/er.5377
Zhang, J., Meerman, H., Benders, R., and Faaij, A. (2020). Technical and Economic Optimization of Expander-Based Small-Scale Natural Gas Liquefaction Processes with Absorption Precooling Cycle. Energy 191, 116592. doi:10.1016/j.energy.2019.116592
Nomenclature
a attractive parameter
b effective molecular volume
Eu amount of exergy utilization
Ex total amount of exergy
ex unit mass exergy
h unit mass enthalpy
kij binary interaction coefficient
n molar flow rate of inlet feed gas
nLNG molar flow rate of LNG produced by the system
p pressure
R universal gas constant
s entropy
T temperature
v molar volume
W power consumption
Wc power consumption of the compressor and pump
Wn Specific power consumption
Ws output power of the expander
z mole fraction for the component
Greek Characters
ε liquefaction rate of the system
ηe exergy utilization rate
Abbreviation
COP coefficient of performance
GAMS general algebraic modeling system
HE heat exchanger
LNG liquified natural gas
MR mixed refrigerant
NG natural gas
SMR single-stage mixed refrigerant
UA heat transfer area and heat transfer coefficient
Keywords: liquefaction process, single-stage mixed refrigerant, process optimization, power consumption, exergy loss
Citation: Wu X, Wang Z, Dai X, Ge Q and Liu F (2021) Optimization Design and Analysis of Single-Stage Mixed Refrigerant Liquefaction Process. Front. Energy Res. 9:766588. doi: 10.3389/fenrg.2021.766588
Received: 29 August 2021; Accepted: 23 September 2021;
Published: 29 October 2021.
Edited by:
Zheng Li, Vanderbilt University, United StatesCopyright © 2021 Wu, Wang, Dai, Ge and Liu. This is an open-access article distributed under the terms of the Creative Commons Attribution License (CC BY). The use, distribution or reproduction in other forums is permitted, provided the original author(s) and the copyright owner(s) are credited and that the original publication in this journal is cited, in accordance with accepted academic practice. No use, distribution or reproduction is permitted which does not comply with these terms.
*Correspondence: Zhaoting Wang, c2x4eXd1eGlhb0AxNjMuY29t
 Xiao Wu
 Zhaoting Wang*
 Quan Ge