 Xurui Huang
 Bo Yang1
 Wanxin Xu
- 1Guangzhou Power Supply Bureau, Guangdong Power Grid Co., Ltd., Guangzhou, China
- 2State Key Laboratory of Alternate Electrical Power System with Renewable Energy Source, North China Electrical Power University, Beijing, China
In order to reduce the impacts caused by large-scale renewable energy resources accessing the utility grid, the micro-energy grid system, as a natural extension of the microgrid in the energy internet era, is proposed and developed to provide a new solution for the optimal utilization of renewable energy resources. In this paper, a multi-energy integrated micro-energy system is proposed which contains wind, PV, bedrock energy storage, magnetic levitation electric refrigeration, solid oxide fuel cell, solar thermal collector, energy storage, and V2G technologies, and detailed models of the energy generation/conversion/storage devices are formulated. Besides this, the uncertainties of renewable energy resources and cold/heat/electricity loads are considered, and the optimal dispatch problem of the micro-energy system is established from day-ahead and real-time time scales based on a model predictive control method. The day-ahead optimal scheduling aims at economic optimization and guides real-time scheduling, and real-time scheduling utilizes rolling optimization and a feedback correction mechanism to effectively correct the deviation of renewable energy generations and loads at a real-time horizon, which improves the optimization control accuracy, follows the day-ahead dispatch plan, and ensures the economics of real-time scheduling at the same time.
1 Introduction
In the context of the carbon peak and carbon neutrality goal, vigorously developing clean energy and renewable energy and reducing the proportion of fossil energy is the only way to eradicate smog and reduce greenhouse gas emissions. The randomness and volatility of new energy represented by wind and solar energy are strong, and this determines the uncertainty of its power generation. The access of large-scale new energy sources to the power grid will have a huge impact on the power grid and bring severe challenges to the safe and stable operation of the power system (Li et al., 2021; Xu et al., 2021). In this context, the research and construction of a new energy system represented by the micro-energy grid (MEG) provides a new solution for the optimization and utilization of renewable energy.
The MEG is a micro-integrated energy system, which is a natural extension of the microgrid under the background of the energy Internet. The MEG involves the production, transmission, storage, conversion, and utilization of various forms of energy, such as cooling, heating, and electricity. It connects the power grid, natural gas pipeline network, heating pipeline network, and other energy networks through energy hubs to meet the needs of end users for cooling, heating, and electricity energy. While making full use of renewable energy, the MEG realizes multi-energy complementary and coordinated operation, ultimately achieving the goal of environmental friendliness and sustainable development. Effective optimization scheduling methods determine the quality of the energy management of the MEG and the overall performance of the system (Zhou et al., 2021).
Until recently, there has been some research on the energy management and optimal dispatching of MEGs. The concepts and design principles of a smart MEG are proposed in (Mei et al., 2017), and an engineering game theory–based energy management system with self-approaching-optimum capability is investigated to realize the vision of the smart MEG. A novel battery energy management system for an MEG is proposed in (Thirugnanam et al., 2018), which considers multiple types of batteries’ characteristics and the reduction of DGs’ operating hours simultaneously. There are multiple stakeholders in the MEGs, including users, equipment operators, and system operators. How to take into account the demands of various stakeholders is the key and difficult point in the energy management of MEGs. A multiparty energy management framework of MEG is considered in (Liu et al., 2018a; Liu et al., 2018b; Liu et al., 2020a), which formulate the utility models for the system operator and prosumers, respectively, and an optimization model based on Stackelberg game is designed for the energy management of MEGs. Besides this, how to deal with uncertainty is also a difficult problem in the energy management of MEGs. The processing methods of existing literature are roughly divided into scene-based random optimization (Neyestani et al., 2015; Pazouki and Haghifam, 2016; Alipour et al., 2018) and robust optimization (Zugno et al., 2016; He et al., 2018). However, the former requires an accurate probability distribution of uncertain factors to give a statistically optimal solution, and the latter needs to optimize the worst scenarios that rarely occur in practice in a predefined set of uncertainties, which make its optimization strategy too conservative.
Most of the abovementioned works study the DA optimal scheduling of MEGs on a single time scale, and the forecast errors caused by the uncertainty of renewable energy outputs are not taken into consideration so that the results of decision making in accordance with the abovementioned strategies in the actual operation of the system is suboptimal or even infeasible. Therefore, shorter time scale forecasting and scheduling are required for energy management of MEGs, and the combination of multiple time scales can make the energy management of MEGs more accurate and practical (Sharma et al., 2019). A two-stage optimal scheduling model is proposed in (Daneshvar et al., 2020) and (Liu et al., 2019) to improve the profits of commercial microgrids equipped with 100% RERs and determine the most economic operational mode of CCHP commercial building system integrated with a three-way valve, respectively. The above two-stage optimization scheduling method greatly improves the utilization of renewable energy, but these works are all open-loop control methods, and there is no feedback mechanism to correct the optimization control process. Model predictive control (MPC), as a modern control theory method, is used in many engineering practices, and the ideas of rolling optimization and feedback correction can better solve the uncertainty problem and have strong robustness (Solanki et al., 2017; e Silva et al., 2020). In Liu et al. (2020b), an optimization model for the management of an isolated microgrid is formulated via hybrid economic model predictive control using weather forecasts performed by a mesoscale meteorological model. Considering the operating characteristics of various devices in the MEG and demand response simultaneously, a multi-time scale MEG energy management model based on model predictive control is established in Hu et al. (2020). However, the above research based on the MPC method are mostly aimed at microgrids or relatively simple MEGs. The energy forms involved and the various links of energy generation, conversion, transmission, storage, and utilization in MEGs are not considered in enough detail.
The contributions of this paper are summarized as follows:
1) A detailed analysis and modeling method is proposed in this paper for the abundant energy generation, conversion, and storage equipment based on the actual MEG system with eight kinds of energy integrated.
2) A two-stage optimal scheduling method based on model predictive control is proposed for the energy management of the actual MEG system to improve the optimization control accuracy.
2 System Model
2.1 The Structure of MEG
The system structure of the multi-energy integrated MEG is shown in Figure 1. The corresponding energy-generation devices are wind turbine (WT), PV, diesel generator (DG), solar collector system (SCS), and solid oxide fuel cell (SOFC) system. The energy storage equipment are the bedrock energy storage (BES) and electric energy storage (EES) systems (Figure 2). The energy conversion equipment are medium-/high-temperature water tanks (MTWT/HTWT), electric heat pump (EHP), lithium bromide refrigerator (LBR), and magnetic levitation electric refrigeration (MLER) system, and the load demands contain electricity, heat, cold, and electric vehicles (EVs).
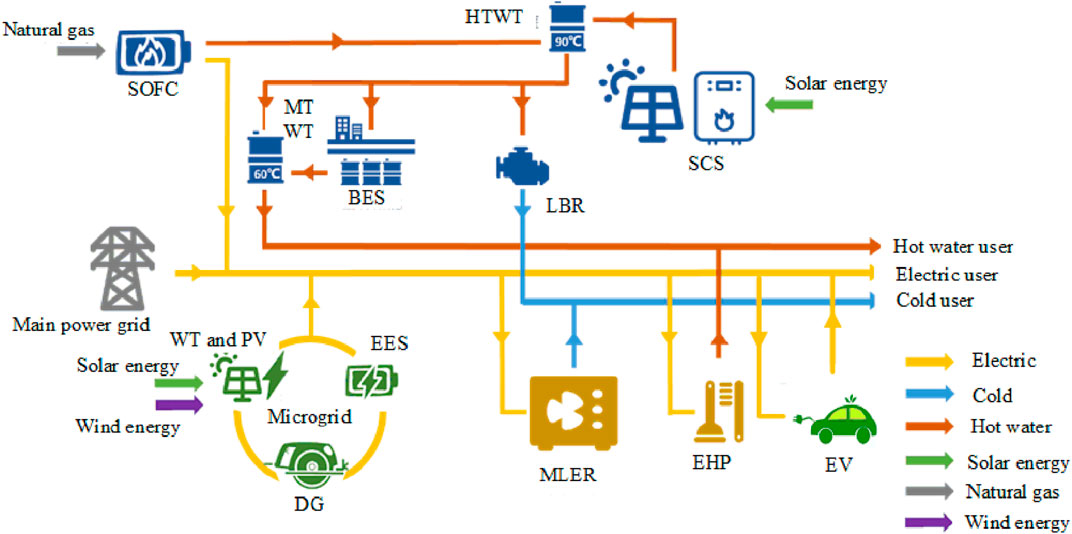
FIGURE 1. Schematic diagram of the multi-energy integrated MEG.
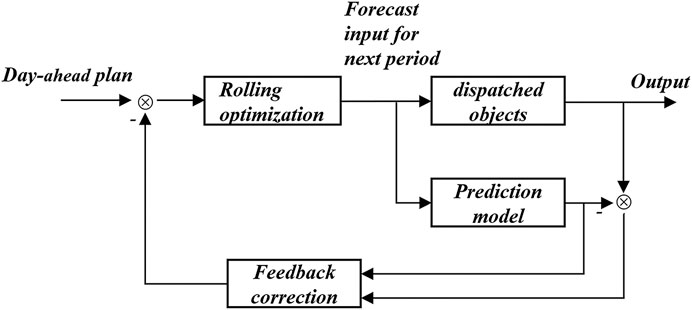
FIGURE 2. Schematic diagram of MPC.
2.2 Equipment Model
2.2.1 Solid Oxide Fuel Cell System
A SOFC is a kind of all-solid energy conversion device that directly converts chemical energy in fuel and oxidized gas into electrical energy, which has the structure of the general fuel cell. The input fuel is natural gas, and the output electrical and thermal power are given as follows:
where
where
2.2.2 Solar Collector System
An SCS is a kind of energy-conversion devices that converts the radiant energy of the sun into thermal energy. It uses the coating to focus sunlight scattered in parallel and collect heat. According to the law of conservation of energy, the effective energy obtained by the collector in each time slot equals the solar radiation energy absorbed by the collector minus the energy loss of the collector lost to the surrounding environment (Cheng et al., 2021):
where
where
2.2.3 Electric Energy Storage System
The state of charge (SOC) of the EES system is denoted as
where
2.2.4 Bedrock Energy Storage System
The BES system utilizes drilling holes in the underground bedrock to store heat in the bedrock and then release the heat when needed. There is little energy loss and high conversion efficiency. Similar to the update rule of SOC of the EES system, the SOC of the BES system is calculated as:
where
2.2.5 Energy Conversion Devices
First, the thermal energy (hot water) of the SOFC and solar thermal collector can make the hot water temperature meet the requirements of the LBR through the HTWT, and then be refrigerated to supply the cold loads of users. Second, the hot water that cannot be used for refrigeration enters the low temperature tank, and then outputs hot water with a specified temperature to meet the hot water loads of users. Third, if there is still remaining hot water, then it is stored in the BES system; if the hot water is deficient, then the hot water stored in the BES system is released to supply.
The energy conversion devices can be represented by the following unified model:
where
2.2.6 Electric vehicle
An EV is an important part of the MEG and plays an important role in system peak-load shifting, demand response, fossil energy consumption reduction, and climate change mitigation. Considering the interaction between EVs and the MEG, EVs are special mobile storage devices with different traveling habits and electricity demands; therefore, they have different trading-related parameters. For any EV, its parameters can be denoted as
Eqs 10, 11 indicate that the SOC at the departure and access time satisfies the normal distribution, and
From the time the EV connects to the MEG to the time to leave, its SOC can be formulated as
where
2.3 Day-Ahead Optimization Scheduling
DA optimization scheduling is an important part to ensure the safe and economic operation of the MEG, it makes decisions on the system operation with the consideration of DA predictions, economic operations, and several constraints. In this paper, the DA optimization schedule periods are 24 h.
2.3.1 Objective Function
The objective function of DA optimization dispatch is minimizing the operation cost, which is formulated as follows:
where Eq. 14 is the cost models of the EES, BES, DG, SOFC systems; EVs; and trading energy with the utility grid, respectively. T is the optimization period; N is the number of energy conversion devices;
2.3.2 Constraints
1) System constraints
where
2) Power output constraints
where
3) Constraints of EES
Eq. 20 is the operation constraints of EES, including the charging and discharging state constraint, charging and discharging power constraint, and SOC constraint.
4) Constraints of BES
Eq. 21 is the operation constraints of BES, including the charging and discharging state constraint, charging and discharging power constraint, and BES capacity constraint.
5) Constraints of EES
Eq. 22 is the operation constraints of EV, including the charging and discharging state constraint, charging and discharging power constraint, and EV capacity constraint. Eq. 23 is the state transmission constraint,
3 Real-Time Optimization Scheduling
Owing to the uncertainty and fluctuations of renewable energy output and cold/heat/electricity loads, RT prediction is more accurate than DA prediction. DA scheduling has errors and cannot perfectly match the RT system state, so RT rescheduling is required on the basis of DA scheduling. MPC can update the scheduling decisions in a real-time horizon according to the latest status of the micro energy network. The time step is 15 min.
MPC is a kind of model-based finite-time domain, closed-loop optimal control method with consideration of future time steps, which includes three parts: predictive model, rolling optimization, and feedback correction. The essential thing is predicting the system input at each time step and obtaining the output according to the historical information and the prediction model. The output of the first time step in the period is taken as the scheduling result of the time step, the results of the remaining time steps are ignored, and the operation is repeated when the next time step comes, and the RT optimization scheduling result is finally obtained. Schematic diagram of MPC is shown in Figure 2.
3.1 Prediction Model
The function of the prediction model is to minimize the objective function and to obtain the dispatch results according to the DA planning, the output of renewable energy and prediction of loads in the future time step. DA optimization scheduling ensures the operation economy of the micro energy system and plays a guiding role for the RT dispatch. The objective function of RT optimization scheduling is divided into two parts to ensure that the scheduling results track the DA schedule results. The first part is to minimize the deviation between the RT output of the controllable device and the energy storage output relative to the DA optimization reference value. The second part is to minimize the sum of the RT power output adjustment values of the controllable devices and energy storage system between adjacent time steps.
where t is the current time slot,
3.2 Rolling Optimization
Rolling optimization and feedback correction make MPC different from traditional optimization methods. The optimization process is repeated at each time slot, and the optimization time horizons keep moving forward to form rolling optimization. This requires a forecast of renewable energy output and cold/heat/electricity loads at each time step; therefore, the optimization process of MPC is different from the traditional optimization method, it is a repeating online rolling optimization process. Rolling optimization of limited time horizons may not be able to get the global optimal results, but it can constantly consider the impact of uncertainty and make timely correction, which is more adaptable to the actual process and has stronger robustness compared with the one-time optimization only based on the model.
3.3 Feedback Correction
After the MPC obtains the dispatch results within a time slot through the prediction information of the current time step, to prevent the dispatch results from deviating from the ideal state due to the uncertain interference, it only adopts the scheduling results of the current time step. At the next time step, the RT prediction information of the current time step is used to modify the model-based prediction, and then the previous step is repeated for a new round of optimization. At the RT scale, the uncertainty of the output of renewable energy and cold/heat/electric loads lead to the prediction error between the actual power output and the RT prediction value. To express this prediction error, normal distribution is superimposed on the DA prediction to simulate the practical scenario:
where
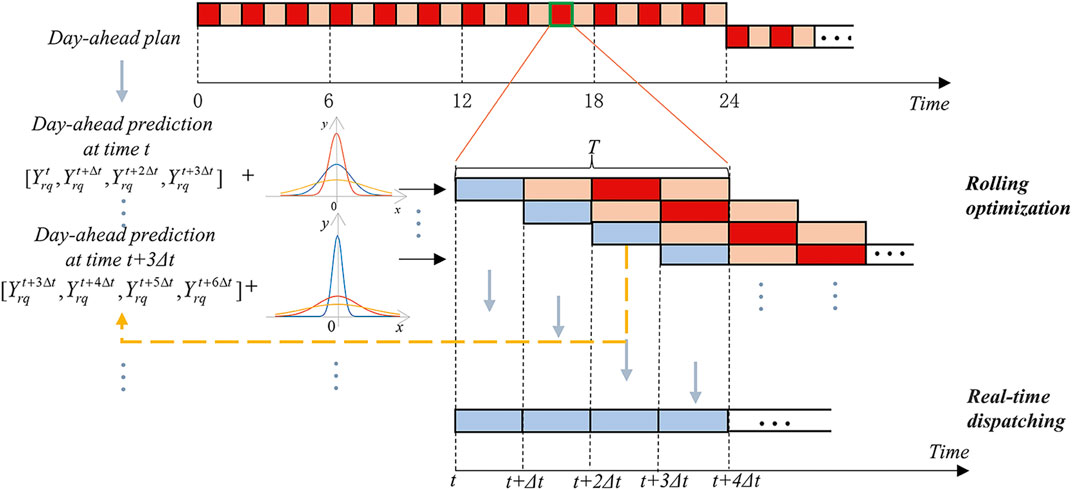
FIGURE 3. Flow chart of RT optimal scheduling.
Through the MPC method, the RT operation of MEG follows the DA plan as much as possible and smoothly controls the increase and decrease of output of each equipment caused by uncertainty.
4 Case Study
4.1 Basic Data
In this paper, a demonstration MEG system in Nansha, Guangzhou is taken as an example to analyze the feasibility of the proposed method. The cost and technical parameters of MEG system are listed in Tables 1, 2, respectively (Dong et al., 2016; Zhou et al., 2018; Cheng et al., 2021).
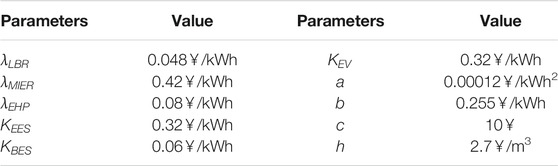
TABLE 1. Cost parameters of MEG system.
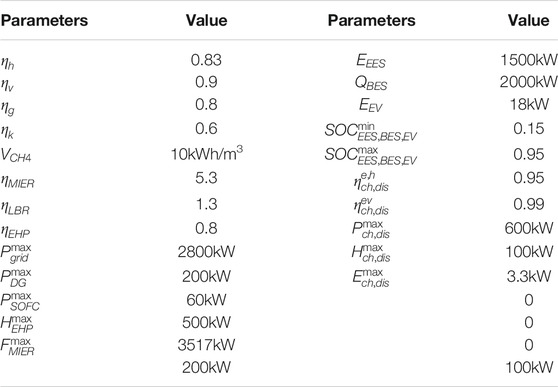
TABLE 2. Technical parameters of MEG system.
The electricity price, electric load, and the output of WT, PV are shown in Figure 4. The heat load and the output of SCS are shown in Figure 5. The cold load is shown in Figure 6.
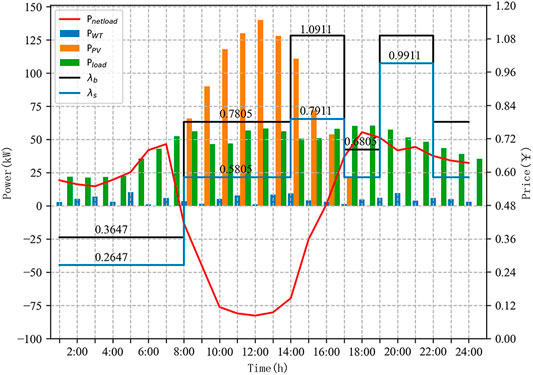
FIGURE 4. Net electric load and electricity price.
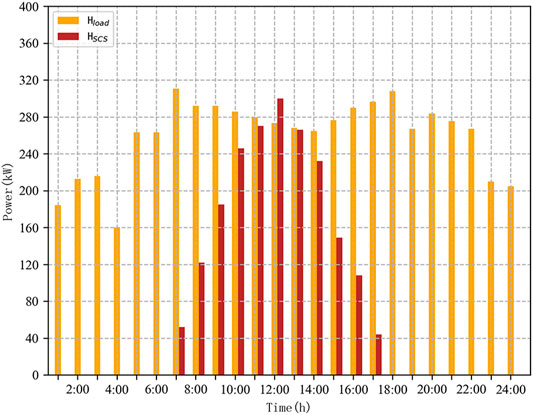
FIGURE 5. Heat load and output of solar collector system.
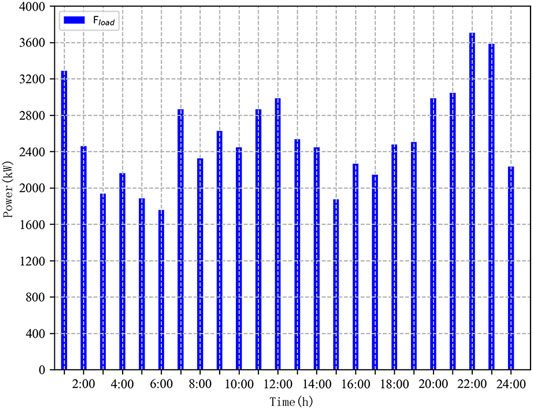
FIGURE 6. Cold load.
The power of the charging pile in the MEG is 50 kW, which can accommodate 15 EVs charging or discharging at the same time. The time periods for EVs accessing to or leaving the MEG are 12:00–24:00, and the SOC of EVs are shown in Figure 7.
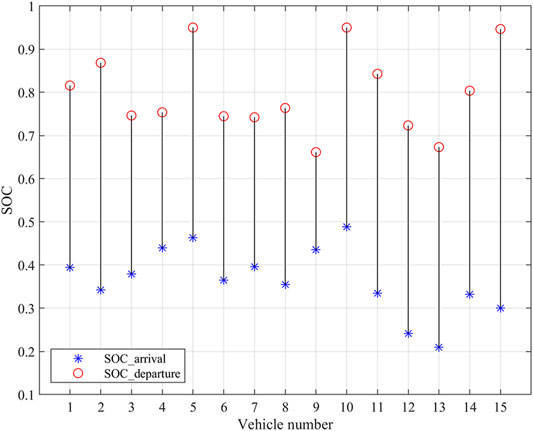
FIGURE 7. SOC of EVs.
It can be seen from Figures 4–7 that the MEG system is characterized by a large cold load and small electric and heat loads.
4.2 Day-Ahead and Real-Time Optimization Results
The DA optimization period is 24 h, and the time step is 1 h. The RT optimization period is 1 h, and the time step is 15 min. The RT optimization predicts the renewable energy output and cold, heat, and electric loads in the next hour every 15 min; the normal distribution is superimposed on the DA prediction data, and the standard deviation is set as 2%. Through rolling optimization and feedback correction, the RT optimization results are obtained.
The cold loads of MEG are very large, which are satisfied by LBR and MLER. Due to the small capacity of LBR, MLER undertakes most of the cold load satisfaction tasks, which requires obtaining electric energy from the utility grid, EES, SOFC, etc. According to Figure 8, LBR has power output in periods 1:00–8:00 and 19:00–24:00, and the power output in other periods is almost zero. Because the cold loads exceed 3,000 kW in these two periods, which is almost the upper limit of the output of MLER, it is necessary to increase the output of LBR.

FIGURE 8. DA and RT cold power output optimization result.
As LBR needs heat for refrigeration, BES and EHP are the main heating equipment. The low electricity price during period 1:00–8:00 guides EHP to release heat to meet the heat demands of LBR,at the same time, and the high cold load guides the BES to release heat to meet the heat demands of LBR, which are shown in Figure 9.
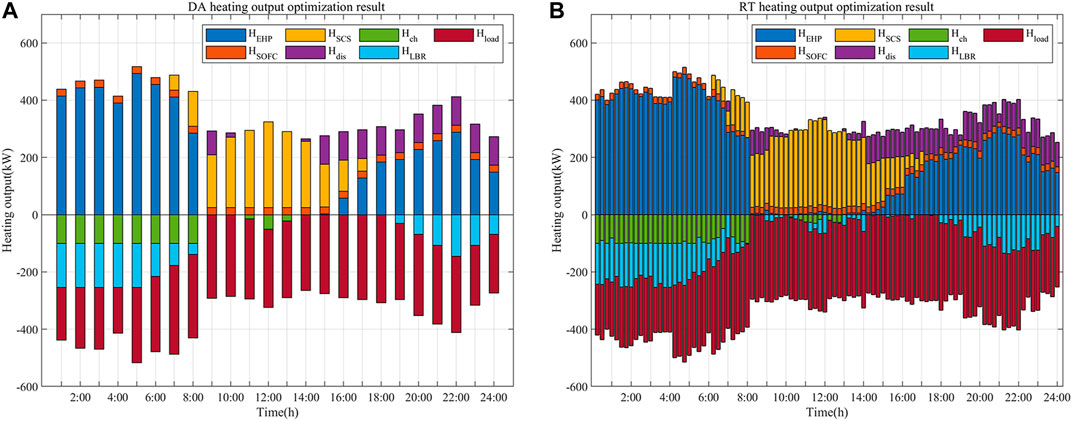
FIGURE 9. DA and RT heating output optimization result.
Because a large amount of electric energy needs to be purchased from the utility grid to convert into cold energy, SOFC and DG are working all the time. According to Figure 10, period 20:00–22:00 is the period with the highest electricity price, which guides EVs and EES to discharge in this period and charge when the electricity prices are low. The dispatching scheme reflects the guiding effect of electricity price and load on equipment’s power output. According to Figures 8–10, the DA and RT scheduling trends are consistent, and electric, heat, and cold output follow the DA scheduling results.
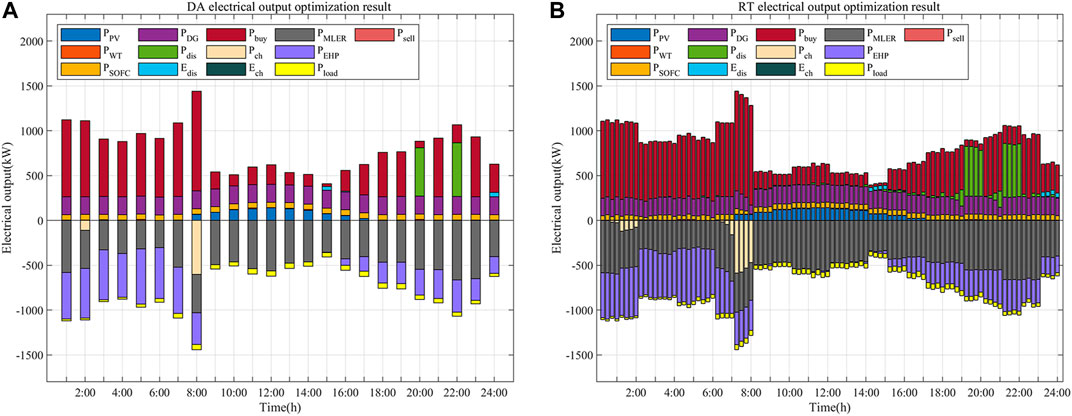
FIGURE 10. DA and RT electric power output optimization result.
4.3 Real-Time and Ideal Optimization Results
After 96 time slots of rolling prediction and optimization, the final input sequence, which includes renewable energy output and cold, heat, and electric loads are obtained. In this paper, the ideal optimization scheme is introduced to compare with the proposed scheme, which is taking this final sequence as the input and the economic optimization as the goal. Because the RT prediction and optimization results are continuously updated, the 24-h renewable energy output and cold, heat, and electric loads can be obtained only after RT optimization is completed, which leads to the ideal optimization scheme only being used as a reference for verifying the method in this paper.
Taking the electric power output as an example, the dispatching results of DA, RT, and ideal situations are compared. From Figures 10A, 11, it can be obtained that, in the DA, RT, and ideal conditions, the electricity output has the same trend in the total periods, and the RT dispatching results are smoother than the ideal results. There are large fluctuations in the periods 7:00–8:00 and 17:00–19:00 in the ideal situation, but almost none in the RT electric power output, which indicates that the MPC RT rolling optimization tries to make the changes of adjacent output more stable while follow the DA optimization schedule. The advantage of MPC is sacrificing the economy of some periods to achieve the stability and economy of the whole periods.
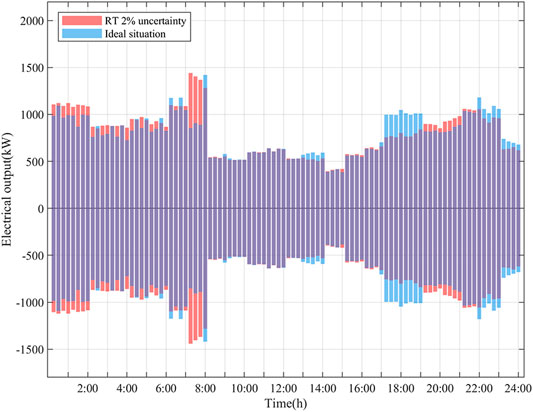
FIGURE 11. Comparison of ideal and RT electric output.
Table 3 compares the total costs of the two cases. The cost of the ideal situation is close to the DA cost, which shows the rationality of the RT rolling prediction and scheduling results in this paper.

TABLE 3. DA cost and ideal situation cost.
4.4 Robustness Analysis
The influence of uncertainty on the system and the advantages of MPC in dealing with RT uncertainty are studied. The RT optimization results corresponding to standard deviation of 5 and 10% are compared in Figure 12.
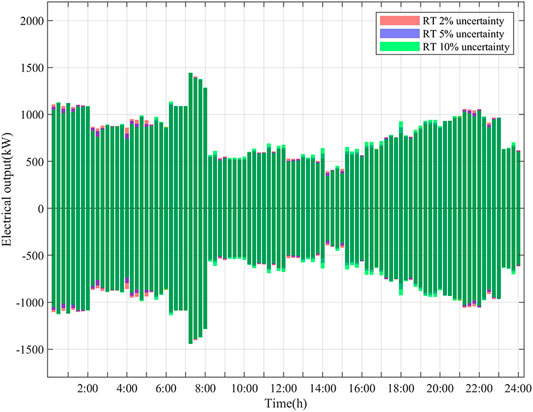
FIGURE 12. Comparison diagram of electrical output under different uncertainties.
Figure 12 shows that most of the scheduling results with 2% uncertainty in the figure are covered, indicating the volatility of RT scheduling results increases with the increase of uncertainty, which is in line with the actual situation. However, even if the uncertainty reaches 10%, the scheduling results continue to follow the plan of DA, which shows that the simple feedback correction in MPC improves robustness and has good dynamic control effect for the uncertainty in MEG.
4.5 Deviation and Smoothness Indices
To statistically compare sensitivity under three different uncertainty scenarios, the deviation and smoothness indices are introduced, and the analysis is performed from both the vertical and horizontal perspectives. The deviation index is defined by Eq. 28. The low deviation and smoothness index values represent the good performance of the optimization results.
where
Under the same time scale and uncertainty, the average absolute error of adjacent results is calculated, and its smoothness is expressed by Eq. 29.
where
Comparing the deviation and smoothness under three RT uncertainties, the results are shown in Table 4.
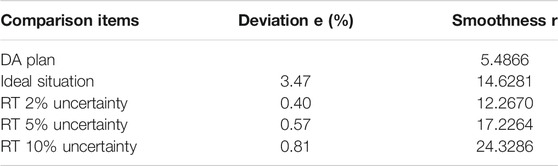
TABLE 4. Deviation index and smoothness index.
According to Table 4, the deviation increases with the uncertainty, and it has a much smaller increment than the uncertainty. The deviation of the ideal case is large, which indicates that the ideal scheduling is optimized based on the RT prediction with the goal of economy rather than obeying the DA plan. RT scheduling with uncertainty obeys the DA plan; thus, the deviation is smaller. As the uncertainty increases, the value of smoothness index increases, the smoothness index of the ideal situation is between the smoothness of 2 and 5% uncertainty.
5 Conclusion
In this paper, the power generation/conversion/storage equipment in the multi-energy integrated MEG is modeled in detail, which enriches the equipment types of the MEG, enables synergetic management and control of a large number of distributed resources, and enables coordination of multi-energy, such as cold, heat, electricity, and gas. Based on MPC method, the MEG is optimized from DA and real-time time scales. The real-time results track the DA plan to ensure economy and significantly reduce the impact of renewable energy and load uncertainty. By comparing the real-time scheduling results under different uncertainties, it is illustrated that the model has good robustness. Even when there is 10% uncertainty, the real-time scheduling still closely follows the DA plan, and the fluctuation of the devices’ power output is far less than the increase of uncertainty. Furthermore, the results show that the rolling optimization and feedback correction mechanism of MPC can fully consider the uncertainty of real-time prediction results, effectively correct the deviation caused by real-time fluctuations, and guarantee the economy and security of the operation of MEG.
Data Availability Statement
The original contributions presented in the study are included in the article/supplementary material, further inquiries can be directed to the corresponding authors.
Author Contributions
XH, BY, and WX contributed to conception and design of the study. FY organized the database. JP performed the statistical analysis. XH and WX wrote the first draft of the manuscript. XH, BY, QX, and WX wrote sections of the manuscript. All authors contributed to manuscript revision, read, and approved the submitted version.
Funding
This work was supported by technology project of Guangzhou Power Supply Bureau of Guangdong 9 Power Grid Co., Ltd. (GZHKJXM20180152). The funder provided the research object, data source and financial support of the article.
Conflict of Interest
Authors XH, BY, FY, JP, and QX are employed by Guangzhou Power Supply Bureau, Guangdong Power Grid Co., Ltd., Guangzhou, China. The authors also declare that this study received funding from Guangzhou Power Supply Bureau of Guangdong 9 Power Grid Co., Ltd. The funder provided the research object, data source and financial support of the article.
Publisher’s Note
All claims expressed in this article are solely those of the authors and do not necessarily represent those of their affiliated organizations, or those of the publisher, the editors and the reviewers. Any product that may be evaluated in this article, or claim that may be made by its manufacturer, is not guaranteed or endorsed by the publisher.
Abbreviations
BES, bedrock energy storage; DA, day-ahead; DG, diesel generator; EES, electric energy storage; EHP, electric heat pump; EV, electric vehicle; HTWT, high temperature water tank; LBR, lithium bromide refrigerator; MEG, micro-energy grid; MLER, magnetic levitation electric refrigeration; MPC, model predictive control; MTWT, medium temperature water tank; PV, hotovoltaic; RER, renewable energy resources; RT, Real-time; SCS, solar collector system; SOC, state of charge; SOFC, solid oxide fuel cell; V2G, Vehicle-to-grid; WT, wind turbine.
References
Alipour, M., Zare, K., and Abapour, M. (2018). MINLP Probabilistic Scheduling Model for Demand Response Programs Integrated Energy Hubs. IEEE Trans. Ind. Inf. 14 (1), 79–88. doi:10.1109/tii.2017.2730440
Cheng, Y., Liu, M., Liu, Z., and Zhan, C. (2021). Operation Analysis and Optimization of Small Solar Absorption Refrigeration System Driven by Flat Plate Collector. Renew. Energ. Resour. 39 (8), 1023–1029. doi:10.13941/j.cnki.21-1469/tk.2021.08.006
Daneshvar, M., Mohammadi-Ivatloo, B., Zare, K., and Asadi, S. (2020). Two-Stage Robust Stochastic Model Scheduling for Transactive Energy Based Renewable Microgrids. IEEE Trans. Ind. Inf. 16 (11), 6857–6867. doi:10.1109/tii.2020.2973740
Dong, L., Chen, H., Pu, T., Chen, N., and Wang, X. (2016). Multi-Time Scale Dynamic Optimal Dispatch in Active Distribution Network Based on Model Predictive Control. Proc. CESS 36 (17), 4609–4617. doi:10.13334/j.0258-8013.pcsee.151262
e Silva, D. P., Félix Salles, J. L., Fardin, J. F., and Rocha Pereirac, M. M. (2020). Management of an Island and Grid-Connected Microgrid Using Hybrid Economic Model Predictive Control with Weather Data. Appl. Energ. 278, 115581. doi:10.1016/j.apenergy.2020.115581
He, C., Wu, L., Liu, T., and Bie, Z. (2018). Robust Co-Optimization Planning of Interdependent Electricity and Natural Gas Systems with a Joint N-1 and Probabilistic Reliability Criterion. IEEE Trans. Power Syst. 33 (2), 2140–2154. doi:10.1109/tpwrs.2017.2727859
Hu, J., Shan, Y., Guerrero, J. M., Ioinovici, A., and Chan, K. W. (2020). Model Predictive Control of Microgrids – An Overview. Renew. Sustain. Energ. Rev. 136, 1–12. doi:10.1016/j.rser.2020.110422
Li, Z., Li, Y., Liu, Y., Wang, P., Lu, R., and Gooi, H. B. (2021). Deep Learning Based Densely Connected Network for Load Forecasting. IEEE Trans. Power Syst. 36 (4), 2829–2840. doi:10.1109/tpwrs.2020.3048359
Liu, C., Wang, D., and Yin, Y. (2019). Two-Stage Optimal Economic Scheduling for Commercial Building Multi-Energy System Through Internet of Things. IEEE Access 7, 174562–174572. doi:10.1109/access.2019.2957267
Liu, D., Wu, J., Liu, H., Song, P., and Wang, K. (2020). “Multi-Time Scale Energy Management Strategy of Micro Energy Grid Based on Model Predictive Control,” in Proceeding of the 2020 IEEE Sustainable Power and Energy Conference (iSPEC), Chengdu, China, 23-25 Nov. 2020, 1511–1516. doi:10.1109/ispec50848.2020.9351153
Liu, N., Cheng, M., Yu, X., Zhong, J., and Lei, J. (2018). Energy-Sharing Provider for PV Prosumer Clusters: A Hybrid Approach Using Stochastic Programming and Stackelberg Game. IEEE Trans. Ind. Electron. 65 (8), 6740–6750. doi:10.1109/tie.2018.2793181
Liu, N., He, L., Yu, X., and Ma, L. (2018). Multiparty Energy Management for Grid-Connected Microgrids with Heat- and Electricity-Coupled Demand Response. IEEE Trans. Ind. Inf. 14 (5), 1887–1897. doi:10.1109/tii.2017.2757443
Liu, N., Tan, L., Zhou, L., and Chen, Q. (2020). Multi-party Energy Management of Energy Hub: A Hybrid Approach with Stackelberg Game and Blockchain. J. Mod. Power Syst. Clean Energ. 8 (5), 919–928. doi:10.35833/mpce.2019.000545
Mei, S., Li, R., Xue, X., Chen, Y., Lu, Q., Chen, X., et al. (2017). Paving the Way to Smart Micro Energy Grid: Concepts, Design Principles, and Engineering Practices. Csee Jpes 3 (4), 440–449. doi:10.17775/cseejpes.2016.01930
Neyestani, N., Yazdani-Damavandi, M., Shafie-khah, M., Chicco, G., and Catalão, J. P. S. (2015). Stochastic Modeling of Multienergy Carriers Dependencies in Smart Local Networks with Distributed Energy Resources. IEEE Trans. Smart Grid 6 (4), 1748–1762. doi:10.1109/tsg.2015.2423552
Pazouki, S., and Haghifam, M.-R. (2016). Optimal Planning and Scheduling of Energy Hub in Presence of Wind, Storage and Demand Response under Uncertainty. Int. J. Electr. Power Energ. Syst. 80, 219–239. doi:10.1016/j.ijepes.2016.01.044
Sharma, S., Xu, Y., Verma, A., and Panigrahi, B. K. (2019). Time-Coordinated Multienergy Management of Smart Buildings Under Uncertainties. IEEE Trans. Ind. Inf. 15 (8), 4788–4798. doi:10.1109/tii.2019.2901120
Solanki, B. V., Raghurajan, A., Bhattacharya, K., and Cañizares, C. A. (2017). Including Smart Loads for Optimal Demand Response in Integrated Energy Management Systems for Isolated Microgrids. IEEE Trans. Smart Grid 8 (4), 1739–1748. doi:10.1109/tsg.2015.2506152
Thirugnanam, K., Kerk, S. K., Yuen, C., Liu, N., and Zhang, M. (2018). Energy Management for Renewable Microgrid in Reducing Diesel Generators Usage with Multiple Types of Battery. IEEE Trans. Ind. Electron. 65 (8), 6772–6786. doi:10.1109/tie.2018.2795585
Xu, D., Zhou, B., Liu, N., Wu, Q., Voropai, N., Li, C., et al. (2021). Peer-to-Peer Multienergy and Communication Resource Trading for Interconnected Microgrids. IEEE Trans. Ind. Inf. 17 (4), 2522–2533. doi:10.1109/tii.2020.3000906
Zhou, B., Zou, J., Yung Chung, C., Wang, H., Liu, N., Voropai, N., et al. (2021). Multi-Microgrid Energy Management Systems: Architecture, Communication, and Scheduling Strategies. J. Mod. Power Syst. Clean Energ. 9 (3), 463–476. doi:10.35833/mpce.2019.000237
Zhou, L., Liu, N., Guo, B., and Dong, D. (2018). Optimized Energy Management Method of Multi-Operating Mode for Integrated Energy System in Commercial Area. South. Power Syst. Technol. 12 (3), 91–97. doi:10.13648/j.cnki.issn1674-0629.2018.03.013
Keywords: micro energy grid, optimal dispatch, uncertainty, model predictive control, rolling optimization
Citation: Huang X, Yang B, Yu F, Pan J, Xu Q and Xu W (2021) Optimal Dispatch of Multi-Energy Integrated Micro-Energy Grid: A Model Predictive Control Method. Front. Energy Res. 9:766012. doi: 10.3389/fenrg.2021.766012
Received: 28 August 2021; Accepted: 20 October 2021;
Published: 30 November 2021.
Edited by:
Bin Zhou, Hunan University, ChinaReviewed by:
Li He, The University of Texas at Dallas, United StatesQifang Chen, Beijing Jiaotong University, China
Tianyang Zhao, Jinan University, China
Copyright © 2021 Huang, Yang, Yu, Pan, Xu and Xu. This is an open-access article distributed under the terms of the Creative Commons Attribution License (CC BY). The use, distribution or reproduction in other forums is permitted, provided the original author(s) and the copyright owner(s) are credited and that the original publication in this journal is cited, in accordance with accepted academic practice. No use, distribution or reproduction is permitted which does not comply with these terms.
*Correspondence: Xurui Huang, aHVhbmd4dXJ1aUBob3RtYWlsLmNvbQ==