- 1School of Economics and Management, Beijing University of Chemical Technology, Beijing, China
- 2School of Management, University of Science and Technology of China, Anhui, China
- 3Beijing Institute of Petrochemical Technology, Beijing, China
- 4Department of International Exchange and Cooperation, Beijing University of Chemical Technology, Beijing, China
- 5Chinese Research Academy of Environmental Sciences, Beijing, China
As the largest producing country of municipal solid waste (MSW) around the world, China is always challenged by a lower utilization rate of MSW due to a lack of a smart MSW forecasting strategy. This paper mainly aims to construct an effective MSW prediction model to handle this problem by using machine learning techniques. Based on the empirical analysis of provincial panel data from 2008 to 2019 in China, we find that the Deep Neural Network (DNN) model performs best among all machine learning models. Additionally, we introduce the SHapley Additive exPlanation (SHAP) method to unravel the correlation between MSW production and socioeconomic features (e.g., total regional GDP, population density). We also find the increase of urban population and agglomeration of wholesales and retails industries can positively promote the production of MSW in regions of high economic development, and vice versa. These results can be of help in the planning, design, and implementation of solid waste management system in China.
Introduction
Over the past decade, the urban population in China has reached up to 900 million residents with an urbanization rate of over 60% (NBSC, 2021), which significantly challenges the existing urban sources (e.g., water, air, and energy) related to residents’ life quality (Hoornweg and Bhada-Tata, 2012). The municipal solid waste (MSW), as renewable energy, is considered an essential part of the Waste-to-Energy (WtE) system (Ouda et al., 2013; Kuznetsova et al., 2019; Mukherjee et al., 2020). It is reported that the production of MSW in China was around 242 million tons in 2020 compared with that of 8.17 million tons in 2008 (NBSC, 2020). In other words, the efficient management of municipal solid waste is becoming an important concern for urban sustainability governance. However, the utilization efficiency of MSW was merely about 45% in China, which was much lower than that in other advanced countries, such as over 80% in Japan (Ding et al., 2021). Therefore, how to increase the utilization efficiency of MSW would impact both central and local governments in China to promote urban sustainable development (He and Lin, 2019).
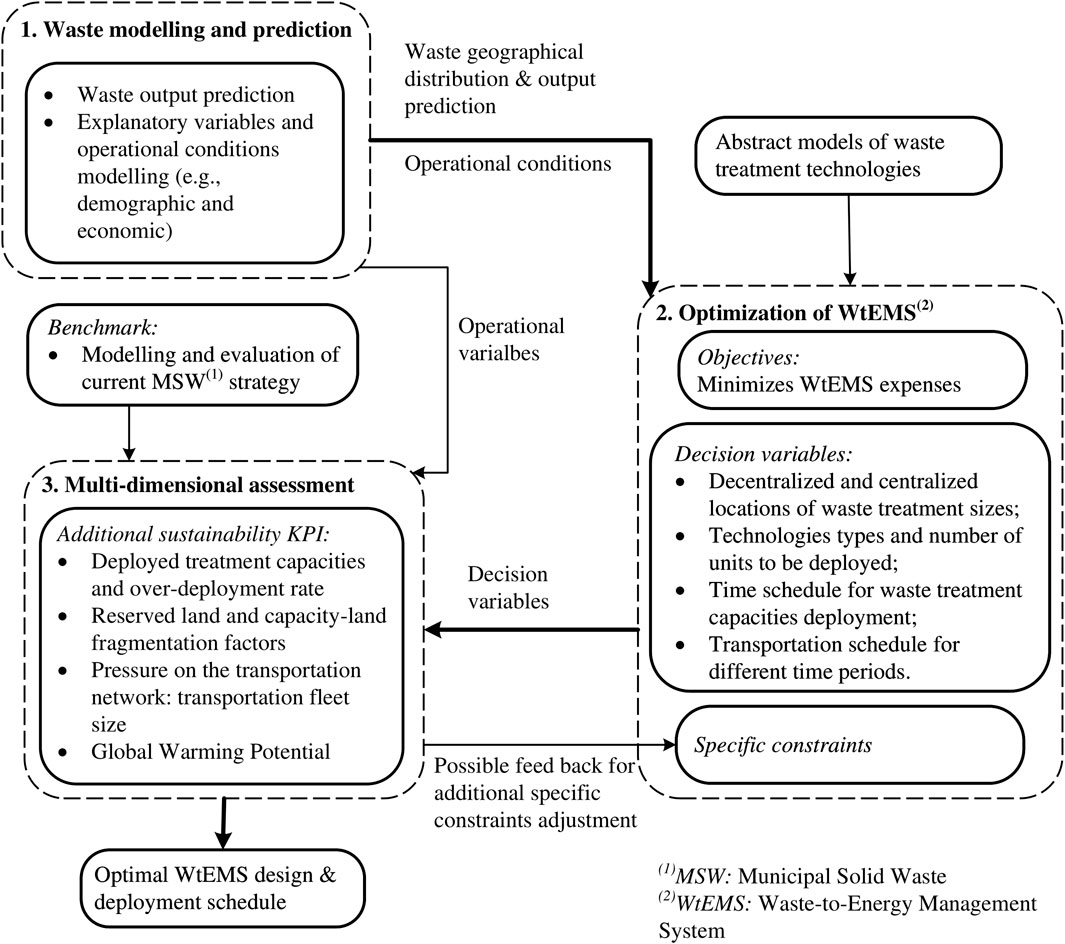
In general, an integrated decision-support methodology for waste-to-energy management systems (WtEMS) design is mainly composed of three modules: 1) the waste modeling and prediction, 2) optimization of WtEMS, and 3) a multi-dimensional assessment, as shown in Figure 1 (Kuznetsova et al., 2019). Among these three modules, waste modeling and its prediction of MSW play a fundamental role in effectively conducting urban planning and energy management. Many international scholars have carried out extensive studies on this module by using group comparisons, time series analysis, and system dynamics (Beigl et al., 2008). Recently, with the popularity of machine learning (ML) methods, alternative methods were put forward to forecast the quantity of generated municipal solid waste effectively (Guo et al., 2021). For instance, based on the example of Suzhou (Niu et al., 2021), constructed the long short-term memory (LSTM) neural network, autoregressive integrated moving average (ARIMA), and traditional neural network to predict the MSW production. They found that the LSTM played a vital role in predicting MSW production but did not reveal the correlation between the production of MSW and socio-economic variables. Nguyen et al. (2021) selected residential areas in Vietnam as a case of study and figured out that both the random forest (RF) and the k-nearest neighbor (KNN) approaches performed effectively in predicting the amount of urban waste. Birgen et al. (2021) developed a Gaussian Processes Regression (GPR) method to predict the daily lower heating value of MSW by combining the historical data of a WtE plant and the weather and calendar data. In addition, other ML methods, such as the support vector machine (SVM) (Kumar et al., 2018) and decision tree (Kannangara et al., 2018) have also been employed to predict the MSW production.
Similar to other energy forecasting research topics (e.g., crude oil prices, gas consumption), MSW production is also was highly influenced by various socio-economic factors (Zhang et al., 2009; Liang et al., 2019; Huang et al., 2021a). However, previous studies neither revealed the correlation between each factor and MSW production nor identified their interaction in different socio-economic circumstances (Kannangara et al., 2018; Niu et al., 2021; Nguyen et al., 2021). In the context of China, existing studies scarcely discussed the performances and applications of different ML methods in predicting MSW. Therefore, this paper mainly aimed to construct a prediction model by using machine learning models by using provincial panel data of 2008–2019 in China. Besides, it also discussed the comparison of the performances of six different ML models in predicting China’s municipal solid waste generation. Considering that data input form and model hyperparameters have a great influence on prediction results, we tested different preprocessing strategies to ensure robust estimation and prediction of the ML model. Finally, this paper provided some potential implications for both policy-makers and other industry stakeholders in terms of convincing evidence concluded from the ML prediction model.
The initial contributions of this paper are threefold. First, it emphasized the good performance of machine learning approaches in predicting MSW production and extended the existing literature to construct a prediction model by comparing six supervised learning algorithms. These models varied from linear, non-linear to ensemble methods and artificial neural network methods, including a body of discussions on data preprocessing, resampling, model training, testing, and interpretation steps. Therefore, the constructed prediction model of MSW would theoretically shed light on other similar research related to prediction issues in the future. Second, this paper estimated the impacts of diverse socio-economic factors on MSW production, such as the regional economic development level (e.g., regional GDP, population density, per capita disposable income), industrial structure (e.g., wholesale and retail values added), and waste generation characteristics. Third, to improve the interpretations of ML models, this paper employed the SHapley Additive exPlanation (SHAP) approach and visualized the SHAP value of each explanatory variable. This technique would also provide good evidence to explain the outcomes of ML models for other researchers in the future.
The remaining sections of this paper are organized as follows: Materials and Methods describes the models adopted in this paper and the process of data acquisition. Results reports the results of comparison among six ML models, via presenting the predictive capability and SHAP analysis. Conclusion provides conclusions and some implications.
Materials and Methods
Figure 2 outlines the main steps of the methodology used in this study. In this paper, we first preprocessed the original database and selected critical variables for MSW prediction. Second, this paper focused on comparing with six ML models, including the multiple linear regression (MLR), support vector regression (SVR), Random Forest, extreme gradient boosting (XGBoost), k-nearest neighbor, and deep neural network (DNN). Thirdly, three evaluation metrics are used to compare the prediction performance of each algorithm. Finally, the SHAP method is employed to analyze and discuss the output.
ML-Based Models and Applications for Waste Prediction
The Multiple Linear Regression Liner Model
The multiple linear regression is a commonly used ML method to estimate the marginal effects of independent variables (or called feature vector in machine learning techniques) on the dependent variable. It is widely applied to waste prediction of desirable explanatory power in different regions and countries (Beigl et al., 2008). In China, this approach is also employed to predict the MSW production in “Calculation and Prediction Method of Municipal Solid Waste Production (CJ/T 106-1999)”, which is the official guide compiled by the Ministry of Construction, China.
The model can be expressed as Eq. 1:
where
Usually, MLR uses the ordinary least squares (OLS) method to estimate the parameters that can achieve the lowest sum-of-squared errors between the observed and predicted responses. Under the OLS estimation, MLR’s results could be easily interpreted. However, some drawbacks have to be considered in MLR. For instance, the multicollinearity among the predictors can result in estimation errors, as well as the omitted variables could induce a biased estimation. In this paper, we mainly concentrated on the performance of each ML model and considered the variables selection based on earlier studies (Kannangara et al., 2018; Namlis and Komilis, 2019; Niu et al., 2021; Nguyen et al., 2021). The multicollinearity and omitted variables problems are not our concerns.
Support Vector Regression
SVM was originally used to deal with pattern recognition problems, and recently extended to estimate regression models due to its properties of the sparse solution and good generalization (Demir and Bruzzone, 2014). By introducing an
A great body of literature has discussed the SVR and SVM models in predicting the generation of MSW. For example (Abbasi and El Hanandeh, 2016), adjusted the hyper-parameters of SVR by combining the grid search method and applying the model with the optimal parameters to the monthly prediction of MSW in Logan City, Australia. They found that SVR can effectively reduce the mean absolute error (MAE) and root-mean-square error (RMSE), and improve prediction performance (R-square). Besides (Nguyen et al., 2021), applied SVM to the prediction of MSW production in Vietnam with an MAE of 131.07, which confirmed that the SVM model performed a better prediction. Kumar et al. (2018) applied it to the prediction of the production rate of plastic waste, and found that the prediction result of SVM (
Random Forest
Random Forest is an evolution of Bagging which aims to reduce the variance of a statistical model, simulates the variability of data through the random extraction of bootstrap samples from a single training set and aggregates predictions on a new record (see Breiman, 1996). It performs a more stable and better prediction of explained variables than other machine learning models (Huang et al., 2021b). Generally, the RF algorithm implementation can be expressed as follows:
1) Bagging is used to randomly generate sample subsets;
2) Use the idea of random subspace by randomly extracting features, splitting nodes, and building a regression sub-decision tree;
3) Repeat the above steps to construct
4) Take the predicted values of
The RF model was widely used in the prediction of waste. Kumar et al. (2018) used RF for the prediction of plastic waste generation rate that showed an R-square of 0.66. The size of the random forest, that is, the number of decision trees (
Extreme Gradient Boosting
XGBoost algorithm, proposed in 2016, is a relatively new approach (Chen and Guestrin, 2016). Different from RF model using bagging integration method, XGBoost model is an integration tree model using boosting method to integrate classification and regression tree (CART). It has the advantages of fast training speed and high prediction accuracy. The result of XGBoost is the sum of prediction scores of all CARTs (Chen and Guestrin, 2016) as formed in Eq. 2:
where
Since its introduction, the XGBoost model has been widely used in the prediction of oil price (Costa et al., 2021) and energy usage (Feng et al., 2021). However, up to date, XGBoost model has not been applied to the research of MSW generation prediction. Similar to RF, the number of integrated CARTs (
K-Nearest Neighbor
KNN algorithm is a non-parametric learning method first proposed by Cover and Hart (Cover and Hart, 1967). Since its introduction, it has been widely used in regression and classification due to its simple and intuitive mathematical form (Wu et al., 2008). It is essentially a supervised learning technique that via the clustering algorithm classify the similarity between the test sample and K nearest training samples (Zheng et al., 2020). Here, K is a user-defined number, normally an odd number, and the similarity is measured by the commonly used Euclidean distance. The test sample is classified based on the most frequent classification among the training samples. The mean value of the K nearest training samples is regarded as the predicted value. The mathematical measurement of Euclidean distance is expressed in Eq. 3:
One drawback of KNN approach is the pre-selected number of K, a hyperparameter, because it would greatly influence the numbers of nearest samples (Wu et al., 2008; Zheng et al., 2020). In the following section, we first limit K to positive integers between 1 and 30, and then cross-verify them on a 10-fold sample to avoid this drawback.
Several studies applied the KNN approach into the prediction of MSW. For example, (Abbasi and El Hanandeh, 2016) first attempt to evaluate the ability of KNN to forecast MSW generation. They concluded that KNN can give good prediction performance and may be applied to establish the forecasting models that could provide accurate and reliable MSW generation prediction. Nguyen et al. (2021) predicted the MSW production in Vietnam and the R-square was over 0.96, which indicated that more than 96% of MSW production would be explained by the KNN model.
Artificial Neural Network
The ANN model is a computational system composed of multiple layers of neurons (input-hidden-output) (Al-Dahidi et al., 2019). This model is widely used in waste management because of its strong fault-tolerant ability to describe the complex relationship between variables in a multivariate system. (Abbasi and El Hanandeh, 2016; Mehrdad et al., 2021; Nguyen et al., 2021; Niu et al., 2021). The deep neural network is a branch of ANN based on a perceptron model. Indeed, an ANN model with multiple hidden layers is called a DNN since it has to train and process through multiple layers (Liu et al., 2017). The structure of DNN also includes input layer, hidden layer, and output layer. In general, the structure of DNN and ANN is similar, and their training algorithm is not different. However, studies showed that DNN tends to provide better performance and accuracy than conventional ANN models (Yang et al., 2021).
In this paper, a DNN with four layers of structure is constructed, namely the input layer, the first hidden layer, the second hidden layer and the output layer with one neuron. The number of neurons in the hidden layer has a great influence on the prediction performance of DNN. The smaller the number of neurons, the more likely it is to lead to insufficient fitting. On the contrary, an excessive number of neurons may lead to over-fitting. Therefore, selecting the appropriate number of neurons for DNN is also one of the bases to improve the model performance. In this paper, the number of neurons in the first hidden layer (
Data Collection
In this paper, we aim to construct a ML-based prediction model of MSW production that is the predictor in all ML models. However, because there are no relevant statistics of MSW production in China at present, we utilize a proxy indicator of the MSW removal volume (Niu et al., 2021; Namlis and Komilis, 2019). More specifically, we obtained this annual statistical data for all provinces in mainland China from 2008 to 2019 to support our research.
The input variables of this paper in predicting MSW production are collected from provincial panel databases of the China Statistical Yearbook 2008–2019. Nine diverse socio-economic factors on MSW production, such as the regional economic development level (e.g., regional GDP, population density, per capita disposable income), industrial structure (e.g., wholesale and retail values added), and waste generation characteristics are obtained (Nguyen et al., 2021). Table 1 reported the variable definition and descriptive statistics. As plotted in Figure 3, the skewness and kurtosis of each variable existed noticeable differences. To mitigate the influences in predicting the MSW production, we employ three different data preprocessing methods and proceed to explore the model’s performance under different circumstances in the following sub-sections.
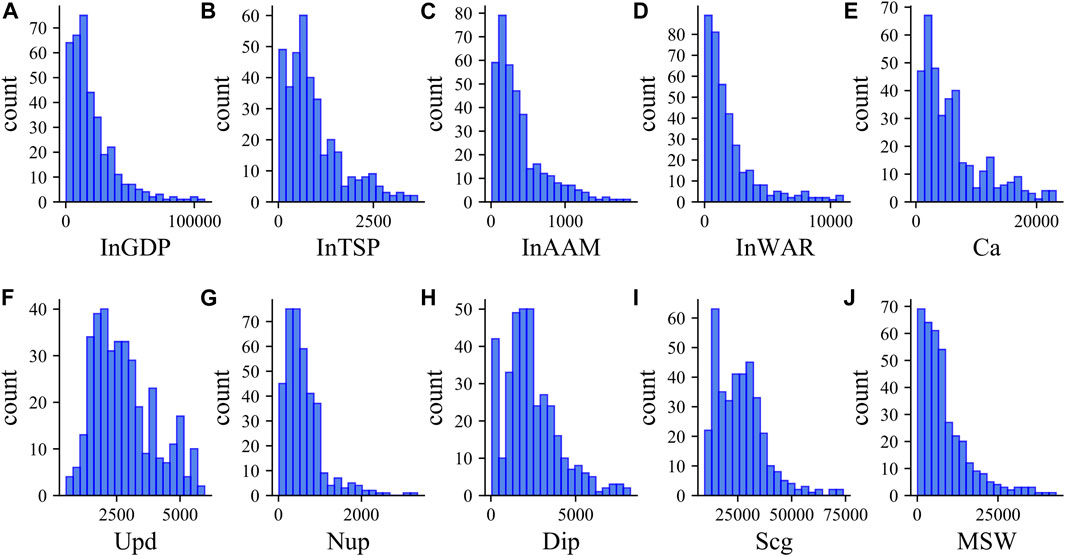
FIGURE 3. Histogram plots for the different inputs and output variables used to train the ML methods. (A) is
Machine Learning Techniques
Data Preprocessing and Re-Sampling
The preprocessing methods adopted include linear normalization (Range) and standard deviation normalization (Scale), as shown in Eq. 4 and Eq. 5 respectively. For ML models (such as KNN) that need to calculate the distance between samples, different orders of magnitude between variables will greatly affect the performance of the model. We retained the original input data in this paper (Raw), and conducted two normalization strategies of Range and Scale to reduce the influence of data’s dimensions and skewness on the predictions. Thus, the results of the three preprocessing methods would be comparable.
where
To minimize the deviation caused by sampling and prevent the model from over-fitting, we adopted the 10-folds cross validation method of resampling technique to create a random sample subset of input data as a training set. The remaining data was used as test set to obtain the generalization ability of the algorithms.
Metrics of the Model
To evaluate the performance of each machine learning algorithm, we use three metrics of the MAE, RMSE and the coefficient of determination (
where
Model Interpretation
Model interpretability is a major challenge to applications of ML methods, which has not been given enough attention in the field of ML and MSW forecasting research. To improve the interpretations of machine learning models, this paper employed the SHAP method that assigned each input variable a value reflecting its importance to predictor (Lundberg and Lee, 2017).
For socio-economic factor subset
However, a major limitation of Eq. 9 is that as the number of features/socio-economic factors increases, the computation cost will grow exponentially. To solve this problem (Lundberg et al., 2020), proposed a computation-tractable explanation method, i.e., TreeExplainer, for decision tree-based ML models such as RF. The TreeExplainer method marks it much more efficient to calculate a risk factor’s SHAP value both locally and globally (Ayoub et al., 2021).
The SHAP combines optimal allocation with local explanations using the classic Shapley values. It would help users to trust the predictive models, not only what the prediction is but also why and how the prediction is made (Ayoub et al., 2021). Thus, the SHAP interaction values can be calculated as the difference between the Shapley values of factor i with and without factor j in Eq. 10:
For this superiority, we employ it to explain RF models which is based on decision trees. Therefore, compared with the existing methods (Nguyen et al., 2021), SHAP can reflect the influence of features in each sample, show the positive and negative effects of the influence, and thereby improve the explanatory of the model output.
Results
Comparison of Model Results
The programming environment used in this study is Python (version 3.8.3) with additional support packages namely scikit-learn (version 0.24.1), Tensorflow (version 2.2.2) to calculate and run the ML algorithms.
Tuning
In this section, parameters of machine learning models are tuned, excluding multiple linear regression approach because it doesn’t involve any hyper-parameters. Specific adjustment for parameters is shown in Table 2.
In the tuning process of SVR, we conduct the aforementioned three data preprocessing strategies (the Raw, Range, and Scale) respectively. As shown in Table 3, in the Raw strategy, that is to retain the original form of input data, the penalty parameter (
where
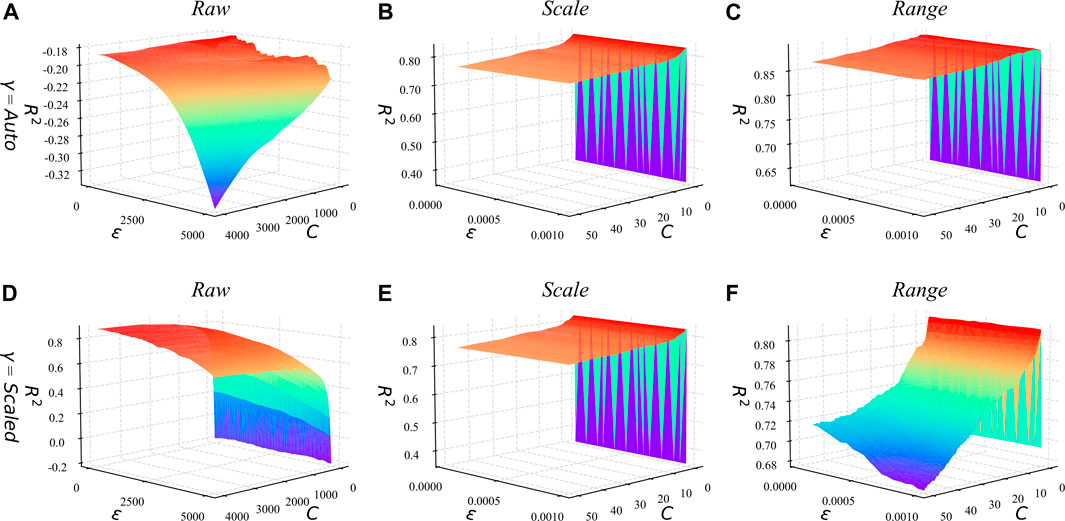
FIGURE 4. Grid search results of SVR under different preprocess methods and different
The hyper-parameters in other ML models are also tuned. For RF, the number of variables tried in each segmentation (
Moreover, the Adma method is used as the optimization method, MAE is set as the loss function and the maximum number of epochs is set to 200. Meanwhile, to prevent over-fitting of the DNN, the EarlyStop mechanism is introduced, and the minimum learning rate is set as 0.003 and the tolerance is set as 20. The hyper-parameter selection results of KNN, XGBoost, and DNN are shown in Figure 6. The hyper-parameters adopted by each method are shown in Table 4.

FIGURE 6. Hyperparameter optimization results of different methods under different preprocess approaches. (A) is KNN and
Model Application and Generation Ability
Figure 7 presents the prediction performance of different ML models by using three preprocessing strategies. Several findings can conclude from the comparison among models. First, the prediction performance of MLR is the worst among all the methods because it doesn’t involve hyper-parameter and responding adjustments. Second, the overall performances of SVR and KNN are similar, but the prediction ability of SVR is slightly higher than that of KNN except for results in Scale processing. Normally, the conducting SVR model needs a more complex process than KNN. By inputting different forms of data, the KNN only needs to adjust one super parameter, which requires less work than SVR. Third, the RF and XGBoost models present significant and similar advantages in predicting MSW production compare with MLR, SVR, and KNN according to the performance measurement of
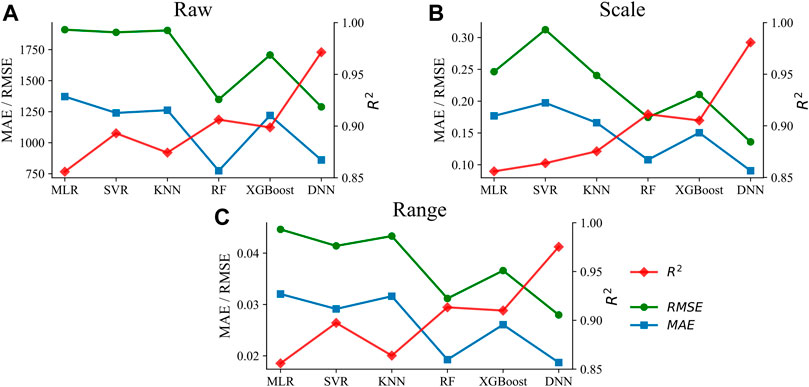
FIGURE 7. Comparisons of algorithms predicts performance under different preprocess methods. (A) is
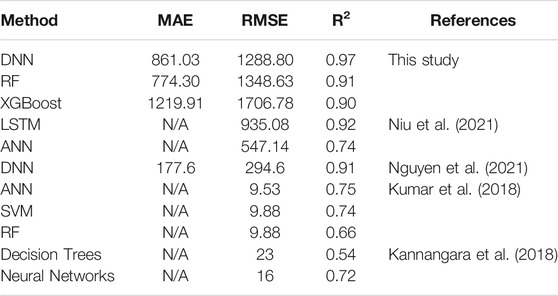
In this study, the RF and DNN models showed high
SHAP Analysis
Overall Analysis
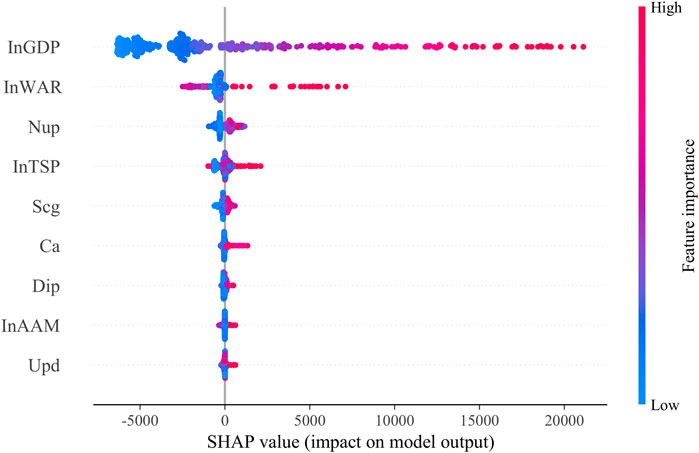
Figure 8 shows the SHAP summary plot that orders features based on their importance to predict MSW production. Specifically, a higher SHAP value of a feature indicates higher-ranked importance to the MSW production volume. For example, the difference in the region’s GDP has the greatest impact on the model’s prediction of MSW production. It is likely because waste production is highly related to the household wealth that directly influences one’s daily consumption and potential production of MSW (Malinauskaite et al., 2017). Moreover, higher value of this feature result in higher SHAP values, which correspond to a higher output amount of MSW.
In addition, the industry structure presents a great influence on MSW production because of its indirect impacts on the citizens’ consumption. For instance, a higher degree of the added value of wholesale and retail trade indicates higher production of MSW compared with other industries (e.g., transportation, warehousing, and postal services industries). Some studies have argued that consumption patterns and population increase are important factors that contribute to MSW production in developing countries (Liu et al., 2019; Nguyen et al., 2021). Besides, the urban population also shows a significant impact on MSW production, because of its functioning on the total amount of MSW production. In contrast, other socio-economic features have a relatively insignificant impact on MSW in China. In the following paper, we will continue to analyze the dependency among these three features to discover the generation mode of MSW in China.
Dependence Analysis
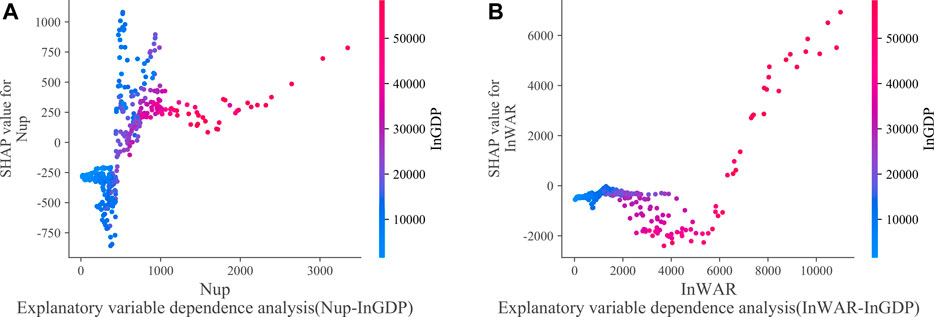
Figure 9 plots the relationship between a feature and its SHAP value dependent on another feature in the RF model. We select
Figure 9A plots the moderating effects of GDP on the impacts of urban population on MSW production. It shows that under the condition of a low
Figure 9B reflects the interaction between GDP and the added value of wholesale and retail industries on MSW production. For example, before
Conclusion
To address the prediction in the production of municipal solid waste and support the WtE system design, we mainly constructed the MSW prediction method in China by using machine learning algorithms. In the comparisons of six ML models, we concentrated our attention on the predictive performances of each algorithm, particularly, by introducing three preprocessing strategies. As a result, SVR had the lowest hyperparameter consistency under different preprocessing strategies. Among the six ML methods established in this study, DNN has the best predictive ability, with an R-square of over 0.97 under all three data preprocessing strategies. The prediction performance of the machine learning methods developed in this paper is also significantly higher than the current standard (MLR) in China.
In addition, we find that the form of input hyper-parameter had a great influence on the models’ performances. Specifically, the explanatory indicators of the regional GDP, urban population, the added values of wholesale and retail industries, are the most important variables that affect MSW production in different provinces of China. With the development of the urban economy, the urban population increase will promote the generation of municipal solid waste. Inversely, in less developed regions, the increase of the urban population will reduce the generation of MSW. Besides, the different stages of the development of the wholesale and retail industries also impact the production of MSW. It means that in the less developed regions, a less added value of the wholesale and retail industries indicates a weak impact on MSW production, and vice versa.
Our findings provide a reliable forecasting method for stakeholders. By increasing the prediction capability of MSW production, national and local policymakers could effectively conduct a series of governance policies to promote a friendly residential environment and urban sustainability. However, if given data from lower administrative, we can build even more powerful predictive models. Future studies can make effort on this to achieve more reliable and accurate results.
Data Availability Statement
The original contributions presented in the study are included in the article/Supplementary Material, further inquiries can be directed to the corresponding author.
Author Contributions
JW and LY conceived, designed, and performed the experiments. YZ, XN, and ZS prepared, analyzed the data. QG contributes policy suggestions. LY and XN wrote the early version of the paper and all authors contributed discussion and revisions, all authors have read and approved the final manuscript.
Funding
This research is supported by Beijing Social Science Foundation (No. 17GLB014), National Key Research and Development Program of China (2018YFF0214804), BUCT Funds for First-Class Discipline Construction (XK1802-5), BUCT (G-JD202002).
Conflict of Interest
The authors declare that the research was conducted in the absence of any commercial or financial relationships that could be construed as a potential conflict of interest.
Publisher’s Note
All claims expressed in this article are solely those of the authors and do not necessarily represent those of their affiliated organizations, or those of the publisher, the editors and the reviewers. Any product that may be evaluated in this article, or claim that may be made by its manufacturer, is not guaranteed or endorsed by the publisher.
References
Abbasi, M., and El Hanandeh, A. (2016). Forecasting Municipal Solid Waste Generation Using Artificial Intelligence Modelling Approaches. Waste Manag. 56, 13–22. doi:10.1016/j.wasman.2016.05.018
Al-Dahidi, S., Ayadi, O., Adeeb, J., and Louzazni, M. (2019). Assessment of Artificial Neural Networks Learning Algorithms and Training Datasets for Solar Photovoltaic Power Production Prediction. Front. Energ. Res. 7, 130. doi:10.3389/fenrg.2019.00130
Ayoub, J., Yang, X. J., and Zhou, F. (2021). Combat COVID-19 Infodemic Using Explainable Natural Language Processing Models. Inf. Process. Manag. 58, 102569. doi:10.1016/j.ipm.2021.102569
Beigl, P., Lebersorger, S., and Salhofer, S. (2008). Modelling Municipal Solid Waste Generation: A Review. Waste Manag. 28, 200–214. doi:10.1016/j.wasman.2006.12.011
Birgen, C., Magnanelli, E., Carlsson, P., Skreiberg, Ø., Mosby, J., and Becidan, M. (2021). Machine Learning Based Modelling for Lower Heating Value Prediction of Municipal Solid Waste. Fuel 283, 118906. doi:10.1016/j.fuel.2020.118906
Chai, J., Zhao, C., Hu, Y., and Zhang, Z. G. (2021). Structural Analysis and Forecast of Gold price Returns. J. Manag. Sci. Eng. 6, 135–145. doi:10.1016/j.jmse.2021.02.011
Chen, T., and Guestrin, C. (2016). Xgboost: A Scalable Tree Boosting System. in Proceedings of the 22nd Acm Sigkdd International Conference on Knowledge Discovery and Data Mining, August 13-17, 2016. San Francisco, CA, USA, 785–794.
Costa, A. B. R., Ferreira, P. C. G., Gaglianone, W. P., Guillén, O. T. C., Issler, J. V., and Lin, Y. (2021). Machine Learning and Oil price point and Density Forecasting. Energ. Econ. 102, 105494. doi:10.1016/j.eneco.2021.105494
Cover, T., and Hart, P. (1967). Nearest Neighbor Pattern Classification. IEEE Trans. Inform. Theor. 13, 21–27. doi:10.1109/TIT.1967.1053964
Demir, B., and Bruzzone, L. (2014). A Multiple Criteria Active Learning Method for Support Vector Regression. Pattern Recognition 47, 2558–2567. doi:10.1016/j.patcog.2014.02.001
Ding, Y., Zhao, J., Liu, J.-W., Zhou, J., Cheng, L., Zhao, J., et al. (2021). A Review of China's Municipal Solid Waste (MSW) and Comparison with International Regions: Management and Technologies in Treatment and Resource Utilization. J. Clean. Prod. 293, 126144. doi:10.1016/j.jclepro.2021.126144
Feng, Y., Duan, Q., Chen, X., Yakkali, S. S., and Wang, J. (2021). Space Cooling Energy Usage Prediction Based on Utility Data for Residential Buildings Using Machine Learning Methods. Appl. Energ. 291, 116814. doi:10.1016/j.apenergy.2021.116814
Guo, H.-n., Wu, S.-b., Tian, Y.-j., Zhang, J., and Liu, H.-t. (2021). Application of Machine Learning Methods for the Prediction of Organic Solid Waste Treatment and Recycling Processes: A Review. Bioresour. Tech. 319, 124114. doi:10.1016/j.biortech.2020.124114
Hariharan, R. (2021). Random forest Regression Analysis on Combined Role of Meteorological Indicators in Disease Dissemination in an Indian City: A Case Study of New Delhi. Urban Clim. 36, 100780. doi:10.1016/j.uclim.2021.100780
He, J., and Lin, B. (2019). Assessment of Waste Incineration Power with Considerations of Subsidies and Emissions in China. Energy Policy 126, 190–199. doi:10.1016/j.enpol.2018.11.025
Hoornweg, D., and Bhada-Tata, P. (2012). What a Waste: A Global Review of Solid Waste Management. Urban development series; knowledge papers no. 15. Washington, DC: World Bank.
Huang, B., Sun, Y., and Wang, S. (2021). A New Two-Stage Approach with Boosting and Model Averaging for Interval-Valued Crude Oil Prices Forecasting in Uncertainty Environments. Front. Energ. Res. 9, 707937. doi:10.3389/fenrg.2021.707937
Huang, Q., Yu, Y., Zhang, Y., Pang, B., Wang, Y., Chen, D., et al. (2021). Data-driven-based Forecasting of Two-phase Flow Parameters in Rectangular Channel. Front. Energ. Res. 9, 10. doi:10.3389/fenrg.2021.641661
Kannangara, M., Dua, R., Ahmadi, L., and Bensebaa, F. (2018). Modeling and Prediction of Regional Municipal Solid Waste Generation and Diversion in Canada Using Machine Learning Approaches. Waste Manag. 74, 3–15. doi:10.1016/j.wasman.2017.11.057
Kumar, A., Samadder, S. R., Kumar, N., and Singh, C. (2018). Estimation of the Generation Rate of Different Types of Plastic Wastes and Possible Revenue Recovery from Informal Recycling. Waste Manag. 79, 781–790. doi:10.1016/j.wasman.2018.08.045
Kuznetsova, E., Cardin, M.-A., Diao, M., and Zhang, S. (2019). Integrated Decision-Support Methodology for Combined Centralized-Decentralized Waste-To-Energy Management Systems Design. Renew. Sust. Energ. Rev. 103, 477–500. doi:10.1016/j.rser.2018.12.020
Li, R., Li, W., Zhang, H., Zhou, Y., and Tian, W. (2021). On-Line Estimation Method of Lithium-Ion Battery Health Status Based on PSO-SVM. Front. Energ. Res. 9, 693249401. doi:10.3389/fenrg.2021.693249
Liang, T., Chai, J., Zhang, Y.-J., and Zhang, Z. G. (2019). Refined Analysis and Prediction of Natural Gas Consumption in China. J. Manag. Sci. Eng. 4, 91–104. doi:10.1016/j.jmse.2019.07.001
Liu, J., Li, Q., Gu, W., and Wang, C. (2019). The Impact of Consumption Patterns on the Generation of Municipal Solid Waste in China: Evidences from Provincial Data. Ijerph 16, 1717. doi:10.3390/ijerph16101717
Liu, W., Wang, Z., Liu, X., Zeng, N., Liu, Y., and Alsaadi, F. E. (2017). A Survey of Deep Neural Network Architectures and Their Applications. Neurocomputing 234, 11–26. doi:10.1016/j.neucom.2016.12.038
Lundberg, S. M., Erion, G., Chen, H., DeGrave, A., Prutkin, J. M., Nair, B., et al. (2020). From Local Explanations to Global Understanding with Explainable AI for Trees. Nat. Mach Intell. 2, 56–67. doi:10.1038/s42256-019-0138-9
Lundberg, S. M., and Lee, S. I. (2017). A Unified Approach to Interpreting Model Predictions. In 31st conference on neural information processing systems, 4768–4777.
Malinauskaite, J., Jouhara, H., Czajczyńska, D., Stanchev, P., Katsou, E., Rostkowski, P., et al. (2017). Municipal Solid Waste Management and Waste-To-Energy in the Context of a Circular Economy and Energy Recycling in Europe. Energy 141, 2013–2044. doi:10.1016/j.energy.2017.11.128
Mehrdad, S. M., Abbasi, M., Yeganeh, B., and Kamalan, H. (2021). Prediction of Methane Emission from Landfills Using Machine Learning Models. Environ. Prog. Sust. Energ. 40, e13629. doi:10.1002/ep.13629
Mukherjee, C., Denney, J., Mbonimpa, E. G., Slagley, J., and Bhowmik, R. (2020). A Review on Municipal Solid Waste-To-Energy Trends in the USA. Renew. Sust. Energ. Rev. 119, 109512. doi:10.1016/j.rser.2019.109512
Namlis, K.-G., and Komilis, D. (2019). Influence of Four Socioeconomic Indices and the Impact of Economic Crisis on Solid Waste Generation in Europe. Waste Manag. 89, 190–200. doi:10.1016/j.wasman.2019.04.012
NBSC (2020). China Statistical Yearbook 2020. Beijing, China: Transport and Disposal of Consumption Wastes in Cities by Region. (in Chinese).
NBSC (2021). Urban and Rural Population and Floating Population. Beijing, China: Bulletin of the Seventh National Census. (No. 7) (in Chinese).
Nguyen, X. C., Nguyen, T. T. H., La, D. D., Kumar, G., Rene, E. R., Nguyen, D. D., et al. (2021). Development of Machine Learning - Based Models to Forecast Solid Waste Generation in Residential Areas: A Case Study from Vietnam. Resour. Conservation Recycling 167, 105381. doi:10.1016/j.resconrec.2020.105381
Niu, D., Wu, F., Dai, S., He, S., and Wu, B. (2021). Detection of Long-Term Effect in Forecasting Municipal Solid Waste Using a Long Short-Term Memory Neural Network. J. Clean. Prod. 290, 125187. doi:10.1016/j.jclepro.2020.125187
Ouda, O. K. M., Cekirge, H. M., and Raza, S. A. R. (2013). An Assessment of the Potential Contribution from Waste-To-Energy Facilities to Electricity Demand in Saudi Arabia. Energ. Convers. Manag. 75, 402–406. doi:10.1016/j.enconman.2013.06.056
Wu, X., Kumar, V., Ross Quinlan, J., Ghosh, J., Yang, Q., Motoda, H., et al. (2008). Top 10 Algorithms in Data Mining. Knowl Inf. Syst. 14, 1–37. doi:10.1007/s10115-007-0114-2
Yang, L., Nguyen, H., Bui, X.-N., Nguyen-Thoi, T., Zhou, J., and Huang, J. (2021). Prediction of Gas Yield Generated by Energy Recovery from Municipal Solid Waste Using Deep Neural Network and Moth-Flame Optimization Algorithm. J. Clean. Prod. 311, 127672. doi:10.1016/j.jclepro.2021.127672
Zhang, X., Yu, L., Wang, S., and Lai, K. K. (2009). Estimating the Impact of Extreme Events on Crude Oil price: An EMD-Based Event Analysis Method. Energ. Econ. 31, 768–778. doi:10.1016/j.eneco.2009.04.003
Keywords: municipal solid waste, influencing factors, machine learning, deep learning, SHAP value
Citation: Yang L, Zhao Y, Niu X, Song Z, Gao Q and Wu J (2021) Municipal Solid Waste Forecasting in China Based on Machine Learning Models. Front. Energy Res. 9:763977. doi: 10.3389/fenrg.2021.763977
Received: 24 August 2021; Accepted: 19 October 2021;
Published: 08 November 2021.
Edited by:
Xun Zhang, Academy of Mathematics and Systems Science (CAS), ChinaReviewed by:
Kenneth E. Okedu, National University of Science and Technology (Muscat), OmanBo Liu, King Fahd University of Petroleum and Minerals, Saudi Arabia
Copyright © 2021 Yang, Zhao, Niu, Song, Gao and Wu. This is an open-access article distributed under the terms of the Creative Commons Attribution License (CC BY). The use, distribution or reproduction in other forums is permitted, provided the original author(s) and the copyright owner(s) are credited and that the original publication in this journal is cited, in accordance with accepted academic practice. No use, distribution or reproduction is permitted which does not comply with these terms.
*Correspondence: Jun Wu, d3VqdW5AbWFpbC5idWN0LmVkdS5jbg==
 Liping Yang
 Yigang Zhao3
 Xiaxia Niu
 Zisheng Song
 Jun Wu