 Zhang Zhongyu1*
 Zhang Zhongxiang2
- 1College of Management and Economics, Tianjin University, Tianjin, China
- 2Ma Yinchu School of Economics, Tianjin University, Tianjin, China
Global climate change has become one of the core issues of world governance. Many countries have put forward the goal of carbon neutrality one after another, leading to the intensification of international low-carbon economy competition. To assess the current low-carbon competitiveness among countries, this article constructs an evaluation index system of international low-carbon economy development, and obtains the scores and rankings of countries in energy, society, economy and environment, as well as overall. Taking 20 countries with the highest carbon emissions in the world in 2019 as samples, starting from the concept of low-carbon economy and five evaluation principles, this article selects 40 low-carbon evaluation indicators from five aspects, including economy, society, science and technology, environment, and energy structure. By using the principal component factor analysis method to calculate and test, the four factors, energy factor, society factor, economy factor, and environment factor, are finally extracted to construct the evaluation index system. Results show that South Korea, France, China, Canada, and Germany are among the world’s top five low-carbon economies. The overall competitiveness of China’s low-carbon economy is in a relatively favorable position (3rd overall), with the most outstanding performance in terms of economic strength (1st), but poor performance in terms of social development (9th) and environmental carrying capacity (9th), and the biggest disadvantage in terms of energy structure (13th).
Introduction
With the release of the IPCC AR6 Synthesis Report on August 9, 2021, the world will fully enter the era of “carbon neutrality,” and countries will strive to achieve carbon neutrality by the middle of the century. This ambitious goal will bring about the transformation of the whole social economy and the arrival of a new round of competition. Global competition for low-carbon economy is further intensified, and green and low-carbon development has become the focus of boosting global economic prosperity.
The European Union (EU), the US, and Japan were the first to peak carbon in 1979, 2007, and 2008 and will take 40–70 years to become carbon neutrality. As a developing country and the world’s largest CO2 emitter (accounted for 28.82% of the world’s emissions in 2019), China will strive to achieve these two goals within 30 years. Then, compared with other countries, what advantages and obstacles does China have in developing a low-carbon economy? In what areas should China stick to its own development path, and in what areas should China learn from the experience of other countries? How does China fit into the global low-carbon economy?
However, there has not yet been an authoritative evaluation index system for low-carbon economy in the world, which makes it impossible to give guidance and suggestions on the development direction of low-carbon economy at the national level.
First, it is necessary to clarify the objective of the index system evaluation—low-carbon economy. The term “Low Carbon Economy” was first proposed by Kinzig and Kammen (1998), and was officially used as an official term in the UK Energy White Paper in 2003 (Vivid Economics 2009), the report (2009) on G20 countries’ low-carbon competitiveness defined the Low Carbon Economy was an economic form with a certain level of carbon productivity and sustainable development, which had characteristics about low energy consumption, low pollution, low emission and environment friendly, and global shared vision to control greenhouse gas emissions and develop social economy (Lu and Zhu, 2013).
As early as in 2005, the research on low-carbon economy in China started from Zhuang (2005, 2007), He et al. (2010), Fu and Liu (2010) et al. (e.g., Bao et al., 2008; Fu et al., 2008; Zhang et al., 2009). They took the lead in discussing low-carbon economy from the aspects of development form, development mode, and development process. Pan et al. (2010) believed that low-carbon economy had three core characteristics, namely “low-carbon emissions,” “high carbon productivity,” and “stages.”
Therefore, it can be seen that the essence of low-carbon economy is the efficient utilization of energy and the development of clean energy. Its core is technological and institutional innovation, and its goal is to control greenhouse gas emissions and promote the sustainable development of human beings (e.g., Yang, 2012; Xie et al., 2017; Zhong, 2018). In recent years, governments around the world have been racing to turn the development of a low-carbon economy from idea into practice. The EU took the lead in developing a number of low-carbon policies to change the traditional lifestyle of residents (Dagoumas and Barker, 2010; Hughes and Strachan, 2010; Government, 2009). The US paid more attention to technological innovation to solve environmental problems. Japan rapidly developed high and new technologies and applied them in the field of clean energy (Strachan et al., 2008; “2050 Japan Low-Carbon Society” project team, 2008). Countries in economic transition and developing countries, such as Russia, South Korea, China, South Africa, Brazil, and India, have joined the international competition led by low-carbon economy one after another.
Second, in terms of establishing the evaluation index system of low-carbon economy, Chinese scholars Fu and Zhuang (2010) were the first to set indicators with different linear weights (AHP and DEA) and rank them. Then, Zhuang and Pan et al. (2011) constructed an evaluation system by judging whether various indicators were within the preset threshold. To further refine the indicators, Fu and Zheng et al. (2011) designed an index system of evaluating the level of low-carbon economy development, which involved one target layer, five rule layers, and nineteen index layers, and then used the Analytic Hierarchy Process (AHP) method to carry out quantitative evaluation on the low-carbon economy at the provincial scale in China, and compared and contrasted some key indicators with those of other countries. Luo and Tong (2011) used the factor analysis method and the entropy weight method to calculate and rank the low-carbon economy development capacity of China’s provinces, and thus summarized the national low-carbon economy development capacity; Yan and Ma (2015) took Chongqing as the research object and comprehensively applied the expert scoring method (Delphi method), AHP, entropy weight method, and TOPSIS method (the superior and inferior solution distance method); Duan et al. (2016) took Dalian as the research object and adopted the AHP-entropy method; Azizalrahman and Hasyimi (2018) established a general multi-criteria evaluation model to evaluate ten cities around the world.
Most importantly, the existing literature fails to consider, from the nation level, to construct international low-carbon economy development indicators, and compare the low-carbon economy development level among counties. Most of current domestic and foreign research objects involve: first, the industry level, such as manufacturing (Wang and Pan, 2019), tourism (Tao, 2017), transportation (Fan et al., 2018), etc.; second, the city level (Xu and Liu, 2014; Pei and Tan, 2013; Yuan et al., 2017); third, the provincial level (Yang, 2012; Shi et al., 2018) and regional level (Xie et al., 2017; Zhong, 2018).
The main contributions of this article are as follows:
1) A new evaluation index system of international low-carbon economy development is designed and applicable to the national level.
2) Using principal component factor analysis, four principal factors are extracted (energy factor, social factor, economic factor, and environmental factor).
3) A clear list of four factor rankings and scores for 20 countries, as well as total scores and rankings, in which China presents clear strengths and weaknesses.
The rest of this article is organized as follows. Construction of evaluation index system is presented in Construction of Evaluation Index System. Empirical analysis is studied in Empirical Analysis. And conclusions and suggestions are drawn in Conclusions and Suggestions.
Construction of Evaluation Index System
Significance, Theoretical Basis, and Principles of Index Construction
Reexamining the international low-carbon economy evaluation index system is of great theoretical and practical significance for further vigorously promoting global climate governance. To assess the main nations by multiple dimensions, we can understand the status quo of the world’s low-carbon economy development, identify the advantages and disadvantages of different countries, and put forward the universal evaluation standard. At the same time, for China, it can clearly identify the level and shortcoming, which is conducive to exploring excellent, replicable, and generalizable institutional achievements of other countries, learning effective major reform measures and successful experiences, and promoting the realization of carbon neutrality goals.
This evaluation system is a means and tool to objectively evaluate the level of low-carbon economy development of each country at the nation level. Its theoretical basis consists of the connotation and characteristics of core concepts, such as sustainable development, green economy, low-carbon economy, ecological civilization, new climate economics, carbon emission decoupling, and coping with climate change (Zhuang et al., 2020; Zhou et al., 2018).
The five principles of the index system construction are: 1) Comprehensiveness: the selected indicators should fully reflect the factors affecting the development of a country’s low-carbon economy from multiple aspects; 2) Effectiveness: the selected indicators should have a high adoption rate in reflecting the low-carbon economy; 3) Applicability: the selected indicators should be applicable to the evaluation needs at the nation level, and the data should be available; 4) Correlation: the selected indicators should be representative, but the highly overlapping indicators with complete correlation (correlation coefficient 1, p value 0) should not be retained at the same time; 5) Foresight: the selected indicators should reflect both the current situation and the potential of low-carbon economy development in the future (Lan and Zheng, 2013; Lv et al., 2013; Cao, 2018).
Index Screening and Data Collection
Based on the policy evaluation of domestic low-carbon construction and the review of domestic and foreign low-carbon economy index system, we preliminarily established an evaluation index system according to the development and operability of low-carbon economy.
The index system includes five dimensions: economy, society, science and technology, environment, and energy structure. For screening indicators of dimension, we searched and collected relevant information extensively, drew on the low-carbon development indicator system of relevant regions, provinces, and industries. Then, we sorted, summarized, classified, and summarized nearly one hundred effective indicators with high adoption rate, and screened out suitable indicators at the national level and available data (2009–2019). In addition, we solicited the opinions of low-carbon economic experts. Finally, the correlation test was carried out on all the variables according to the correlation principle, and the indexes that were completely correlated with each other were eliminated. A total of 40 indexes covering 5 dimensions were retained to ensure that the above five principles were met.
As shown in Table 1, the index system mainly includes three levels: target layer, criterion layer, and indicator layer (Fu et al., 2011). The target layer is the international low-carbon economy development level, the criterion layer includes five dimensions of economy, society, science and technology, environment, and energy structure, and the index layer includes 11 first-level indicators and 40 second-level indicators.
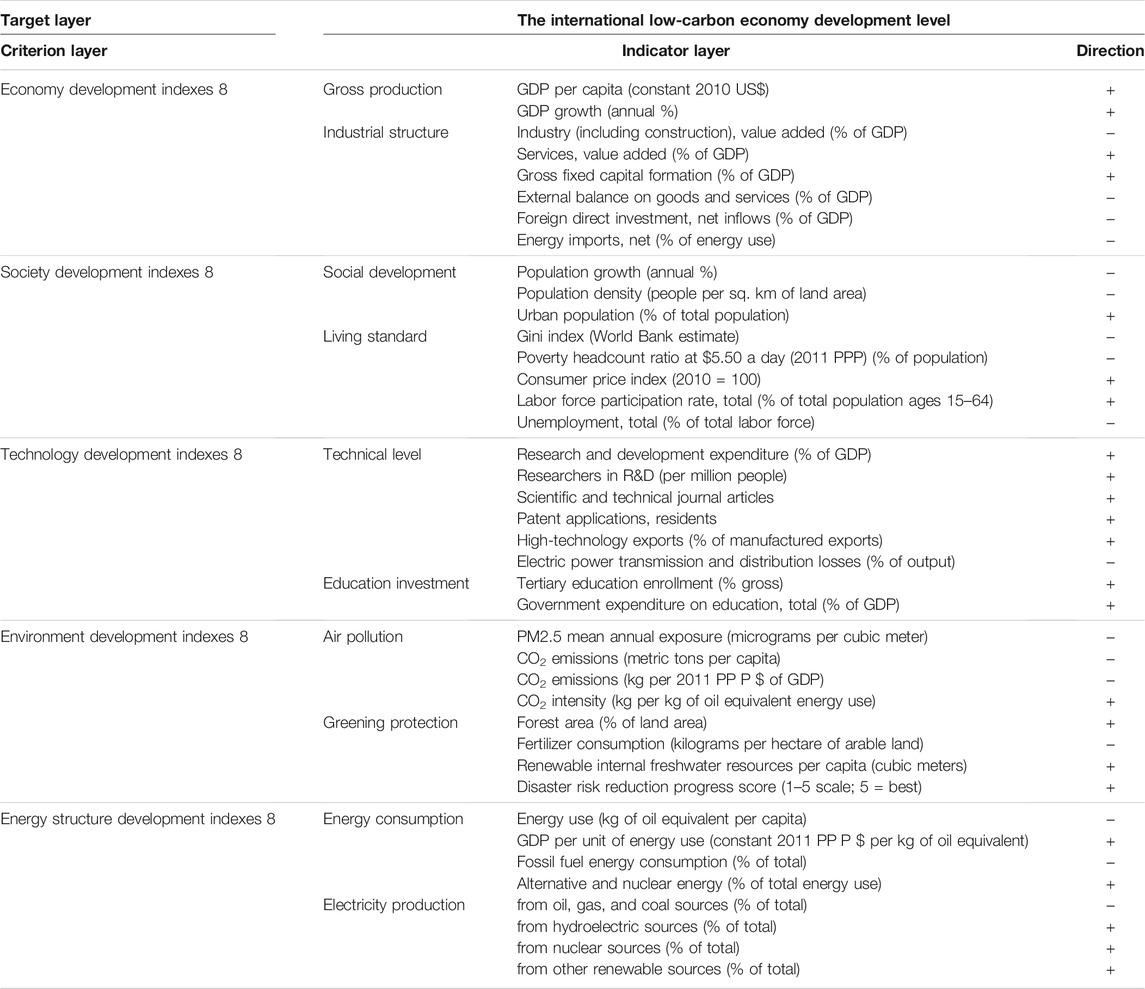
TABLE 1. The evaluation index system of international low-carbon economy development.
It is worth noting that the positive and negative correlation (Table 1) between the indexes and low-carbon economy is limited to the general economic laws, and the specific and detailed change laws are not within the scope of this article.
In accordance with the principles of openness, reliability, and consistency in the process of data collection, basic data from open channels were used as much as possible in this article. The data of the 40 development indexes of the above 20 countries were mainly derived from the World Bank database, International Energy Agency (IEA), U.S. Energy Information Administration (EIA), the World Economic Yearbook, the BP Statistical Review of World Energy, the report of the United Nations Food and Agriculture Organization, and other relevant statistics.
To maintain the authenticity, accuracy, and availability of the data, for the difference in the updating time of different indexes in the statistical data, data of 2019 were selected uniformly in this article for comparative analysis. For statistical data differences caused by different statistical calibers, the World Bank database shall prevail in this article. For the default values, the method of substitution of adjacent years, or averaging or substitution of similar countries were adopted.
Empirical Analysis
Selection of Representative Countries
This article selects the world’s top 20 CO2 emitters in 2019, and the total carbon emissions of these countries reach nearly 80% of the world’s total carbon emissions. Table 2 lists the proportion and growth rate of CO2 emissions in 20 countries in 2019, as well as in the past 10 years.
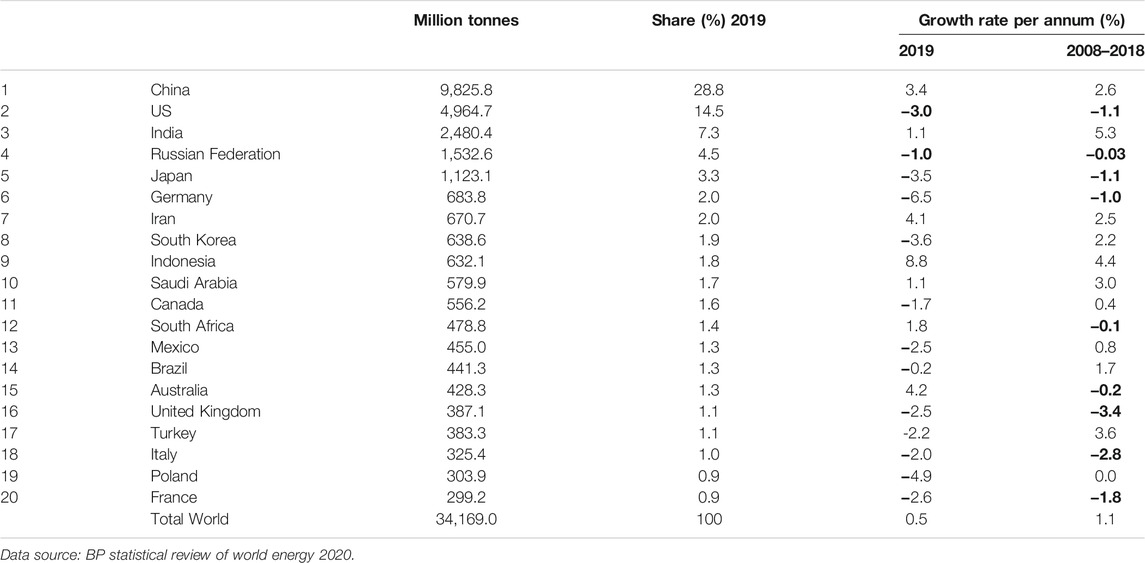
TABLE 2. Countries rank of carbon dioxide.
In Table 2, the global CO2 emission in 2019 reaches 34.17 billion tons, among which China (28.76%), the United States (14.53%), and India (7.26%) account for nearly half of the global carbon emissions. In 2019, global carbon emissions grow by 0.5%, less than half the average growth rate of 1.1% over the past decade. Nine countries, including the United States, Russia, Japan, the United Kingdom, and some EU countries, have experienced long-term negative growth in their carbon emissions, which means that they have reached “carbon peak.” With economic growth slowing in 2019 and some of the one-off factors driving energy demand easing in 2018, the growth of energy markets across the world has slowed, especially in the US and Russia, where carbon emissions’ growth has fallen back from 2.61 and 4.19% in 2018 to −2.97 and −1.02% in 2019, respectively. With the exception of China, its carbon emissions are still growing at a faster pace (3.4%) in 2019, indicating a good economic growth.
Principal Component Factor Analysis
As we know, there are numerous indicators or variables that reflect the low-carbon economy development of a nation. It is necessary to reduce the data dimension and the complexity of problem analysis. Moreover, there are some structures or dimensions in the data that exist but cannot be observed directly, or variables that have, between themselves, relatively high correlation coefficients, so new variables that capture the joint features of the original variables are desired to be established for subsequent multivariate analyses.
Factor analysis is a multivariate technique that tries to identify a relatively small number of factors that represent the joint behavior of interdependent original variables. Each one of these new variables is called common factor, which can be understood as the cluster of variables from the previously established criteria (Fávero and Belfiore, 2019). Among the methods used to determine factors, the one known as principal components is, without a doubt, the most widely used in factor analysis, because it is based on the assumption that uncorrelated factors can be extracted from linear combinations of the original variables.
The principal component factor analysis has four main objectives: 1) to identify correlations between the original variables to create factors that represent the linear combination of those variables (structural reduction); 2) to verify the validity of the previously established constructs, bearing in mind the allocation of the original variables to each factor; 3) to prepare rankings by generating performance indexes from the factors; and 4) to extract orthogonal factors for future use in confirmatory multivariate techniques that need the absence of multicollinearity (Fávero and Belfiore, 2019).
The Model
Let us assume a dataset that has
where
Hypotheses are that
In this article, we discuss the orthogonal factor model (1), which satisfies hypothesis (2)–(4).
Next, when choosing the number of factors, only the factors that correspond to eigenvalues greater than one are considered. This criterion is often used and known as the latent root criterion or Kaiser criterion. Also, these extracted factors have respective proportions of variance shared by the original variables and the first factor
Next, the principal components method is used to calculate the factor loadings, which simply are Pearson correlations between the original variables and each one of the factors. This method expresses the factor
where
Next, to better visualize the variables represented by a certain factor, we can think about a rotation around the origin of the originally extracted factor F, so that we can bring the points corresponding to variable
Based on Expression 1, the new rotated factor is expressed as a linear combination of the original variables again, and factor scores are calculated.
where B is the regression coefficient that needs to be estimated; X is the standardized variable;
The Results
The overall adequacy of the factor analysis needs to be evaluated based on the KMO statistic and, mainly using the result of Bartlett’s test of sphericity. These 15 index variables (Table 4) are the optimal combination results of the factor analysis model. The KMO statistic provides the proportion of variance considered common to all the variables present in the analysis, and by calculating, KMO = 0.628, which suggests that the overall adequacy of the factor analysis is middling. On the other hand,
In Table 3, based on the Kaiser criterion, only four factors that correspond to eigenvalues greater than 1 are taken into consideration, formed by sharing 81.541% of the total variance of the original variables, that is, with a total variance loss of 18.459%. After factor rotation, 22.572, 21.929, 20.610, and 16.429% of the total variance are shared to form each factor respectively, representing the weight of each factor in the total score.
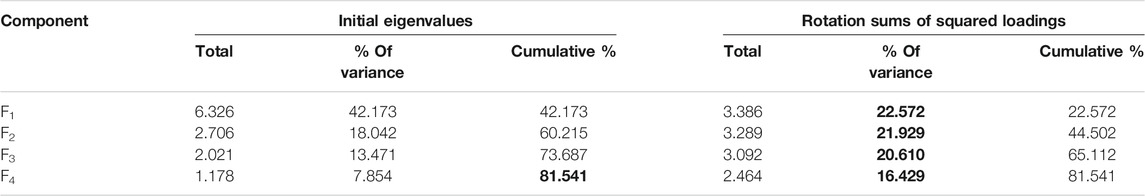
TABLE 3. Extracted principal components and total variance explained.
Further combined with Table 4, it is found that after rotation, variables X1-X4 have high loadings on the first factor, named as “energy factor,” variables X5-X8 have high loadings on the second factor, named as “society factor,” variables X9-X12 have high loadings on the third factor, named as “economy factor,” variables X13-X15 have high loadings on the fourth factor, named as “environment factor.”
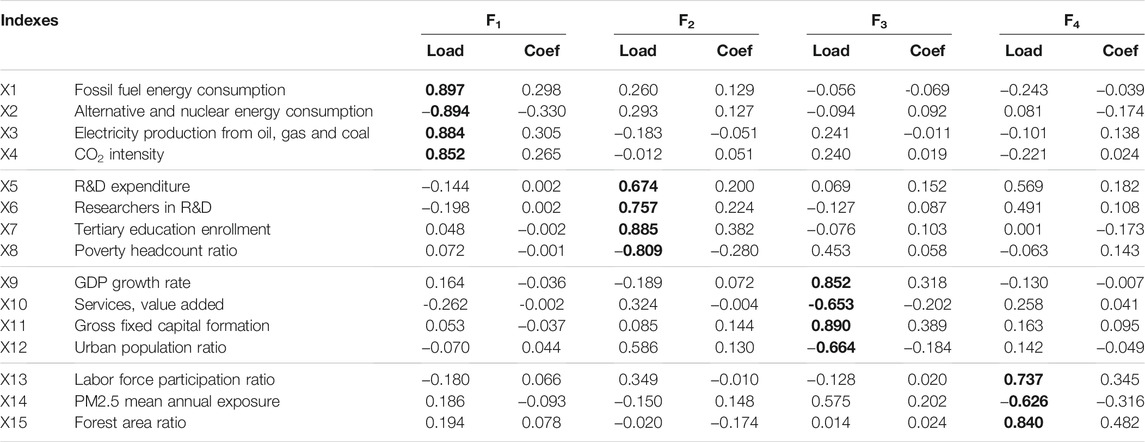
TABLE 4. Rotated factor loadings matrix and component score coefficient matrix.
Based on Expression (6), we can calculate the factor scores expressions from the loadings. The rotated factor scores can be obtained through the estimation of four multiple linear regression models, in which a certain factor is considered to be a dependent variable in each one of them, and as explanatory variables, the standardized variables. For example, we are able to write the expressions for factor F1 as follows:
The four factor scores of each country are shown in Table 5, with higher scores leading to higher rankings. However, for the energy factor, the lower the score, the smaller the energy consumption, the more in line with the requirements of low-carbon economy, so the higher the ranking.
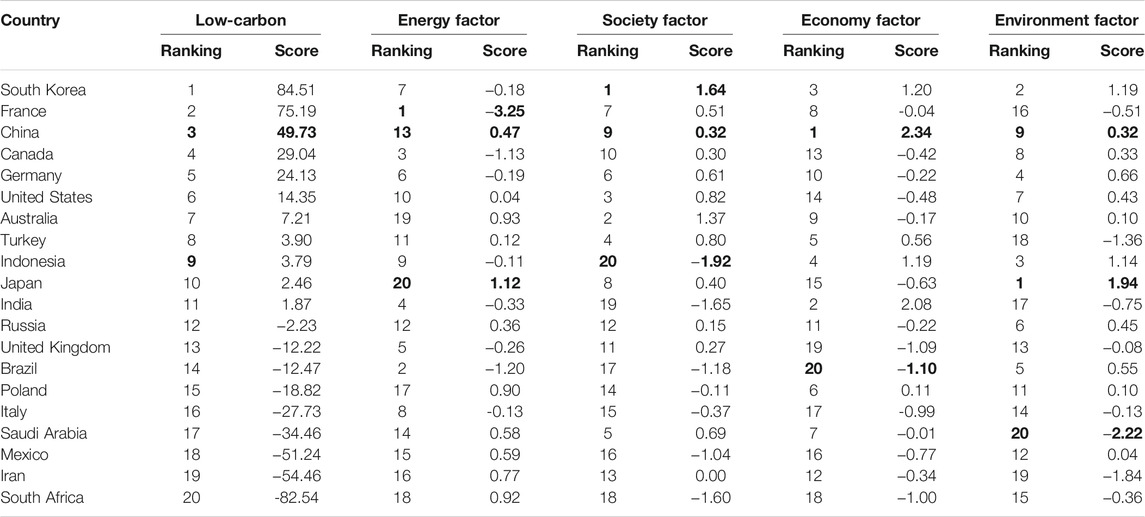
TABLE 5. Rankings and scores of low-carbon economy development level.
Finally, a well-accepted criterion that is used to form integrated rankings from factors is known as weighted rank-sum criterion. In this criterion, for each country, the values of all the extracted factors obtained weighted by the respective proportions of shared variance are added, with the subsequent ranking of the countries based on the results obtained. In Table 5, for example:
Result Analysis
From Tables 4, 5, we can see that the first factor has a relatively high factor loading in the four indicators, such as energy consumption, power generation, and CO2 intensity, which indicate that the low-carbon economy is first and most significantly affected by the energy consumption and structure. In the ranking of “energy factor,” France (−3.25), Brazil (−1.20), and Canada (−1.13) rank the top three, indicating that these three countries have the best performance in energy factor. Combined with the statistics of the World Bank in 2019, the main reasons are as follows: Brazil and Canada have abundant water resources, and their hydropower generation accounts for about 60% of the total electricity generation; nuclear power accounts for 77.63% of France’s electricity generation. Thus, these three countries are relatively low in fossil energy dependence and CO2 intensity. On the contrary, Japan, Australia, South Africa, Poland, and Iran rank at the bottom, whose fossil energy consumption accounts for about 90%, since they have basically given up nuclear power generation, or lack of domestic water resources or abundant fossil resources, respectively.
The second factor has a relatively high factor loading in the four indicators, such as R&D expenditure and researchers, school enrolment ratio, and poverty ratio, which indicates that the low-carbon economy is secondary affected by science and technology, education, social security, and other social factors. In the ranking of “society factor,” South Korea (1.64), Australia (1.37), and United States (0.82) rank the top three, indicating that as developed countries, they have higher levels of science, technology, education, and income, and can realize low-carbon production and life style. For example, factories use more advanced low-carbon production technology and equipment, and residents generally accept low-carbon and environmentally friendly life style and have the economic ability to take actions and implement it. On the contrary, Indonesia, India, and South Africa, as developing countries, rank at the bottom. Since the government does not invest enough in research and education, citizens are too poor to attend higher education institutions, and factories are lack of high-tech talent and high-tech enterprises, which hinder the transition to low-carbon economy severely.
The third factor has a relatively high factor loading in the four indicators, such as GDP growth rate, services value added, gross fixed capital formation, and the urbanization ratio, which indicates that the low-carbon economy is based on the economic foundation and vitality. In the ranking of “economy factors,” China (2.34), India (2.08), and South Korea (1.20) rank the top three, while Brazil, the United Kingdom, and South Africa rank the bottom three. In 2019, the world economy faces downward pressure due to a combination of major uncertainties, such as trade frictions, trade protection, geopolitics, and recession risks. Regardless of the backdrop of weak global business confidence and investment motivation, emerging economies, such as China, India, and South Korea, are likely to gain momentum (Zhi, 2020).
The fourth factor has a relatively high factor loading in the three indicators, such as forest coverage rate, PM2.5 concentration, and labor force participation ratio, which indicates that the low-carbon economy cannot be separated from a country’s environmental carrying capacity. In the ranking of “environment factors,” Japan (1.94), South Korea (1.19), and Indonesia (1.14) rank the top three, mainly due to their extremely high proportion of forest area, which reaches 68.5, 63.4, and 49.9%, respectively. In addition, the three countries are all island countries or peninsulas, where the air is highly mobile and the PM2.5 concentration is relatively low. On the contrary, Saudi Arabia and Iran are at the bottom, with weak environmental carrying capacity due to their arid deserts, low forest cover, oil production, and high levels of PM2.5. In addition, the labor force participation rate is included as an environmental factor. According to the test, the labor force participation rate is significantly negatively correlated with the PM2.5 concentration at the level of 1%, and significantly positively correlated with the forest coverage rate at the level of 5%.
In terms of overall scores, the top five countries are South Korea (84.51), France (75.19), China (49.73), Canada (29.04), and Germany (24.13), the last three are Mexico, Iran, and South Africa. Combined with the statistical data of 2019 and the factor scores in Table 5, every country has different status quo and advantages of the low-carbon economy.
South Korea, which ranks first overall, also ranks among the world’s top three in terms of technology, environment, and economy. While its population is just 51million, the per capita income is $31,400. In 2019, industrial output ranked the sixth in the world, with manufacturing and service industries as the main industries, particularly shipbuilding, automobile, electronics, steel, textile, and other industries ranked among the world’s top 10 in output, and semiconductor sales ranked the first in the world, and tourism was also relatively developed. Moreover, South Korea attaches great importance to the development of education and science and technology, such as high-speed Internet services, the aerospace industry, robot, and biotechnology, which are highly competitive in the world. However, South Korea is at a relative disadvantage in terms of energy factors in developing low-carbon economy, due to its small land area, few mineral resources, lack of natural resources, and dependence on imports of major industrial raw materials.
Interestingly, France, which ranks second overall, ranks first in energy factor, in complete contrast to South Korea. France has low CO2 intensity, due to its high use of clean energy. It has closed all iron and coal mines, fully exploited hydropower and geothermal resources, and even approximately 78% of electricity is provided by nuclear power. Its GDP ranks seventh in the world; the service sector employees account for approximately 77% of the total labor force; it is the world’s largest tourist reception country, but also the world’s consumption center, due to developed business. In addition, in the world, it ranks second in nuclear power equipment capacity, petroleum and petroleum processing technology, third in aviation and aerospace industry, and sixth in steel and textile industry. It is also a high-welfare country with a well-developed social insurance system.
China’s Ranking
China, which ranks third overall, ranks first in economy factor. The rapid accumulation of capital has become the most important factor for a country’s economic growth, since natural resources are limited by land area and labor force is restricted by population growth rate. 1) Based on these three factors of production, China is the fourth largest in land area and the first largest in population in the world. 2) China’s GDP growth rate is 6.81%, and gross fixed capital formation accounts for 42.29% of GDP, compared with 2 and 20% in most developed countries, respectively.
The disadvantages of China’s low-carbon economy are also obvious. In terms of the other two indicators of “economy factors,” China’s added value of services and the urbanization rate, rank fourth from the bottom and third from the bottom among the 20 countries, respectively. 1) Although China has advantages in production factors, it obviously does not allocate the factors in the tertiary industry with higher added value, and the industrial structure is unreasonable. 2) In addition, although the urbanization rate has increased from 10.64% in 1949 to 59.58% in 2019, with an average annual increase of 0.71 percentage points, making it the largest and fastest urbanization in the history of the world, there is insufficient support in basic areas and frequent problems in urban development.
China ranks 9th in society factor. In the process of economic growth, technological progress can break the law of declining returns on capital while accumulating capital and maintaining high enthusiasm for capital accumulation, which is also conducive to product innovation and industrial upgrading. 1) China spends 2.13% of its GDP on R&D, much less than South Korea (4.5%), Japan (3.2%), and Germany (3.04%). 2) China has 1,234 R&D researchers per million people, compared with 7,514 in South Korea and 5,304 in Germany. 3) As the support of education is undoubtedly behind the talents, the enrollment rate of Chinese colleges and universities is 50.6%, while that of South Korea is 94.35%. 4) In addition to the urgent need for national investment in education, poverty is a top priority. According to the World Bank’s standard of $5.50/day, China’s poverty rate is 27.2%, while that of developed countries is only 0.2–3.5%. China’s GDP per capita is $7,752, only 14% of that of the United States. Therefore, compared with developed countries, China still has a higher proportion of poor population, insufficient development of higher education, and shortage of research funds and researchers, which leads to the relatively backward pace of low-carbon economy development.
China ranks 9th in environment factor. 1) China’s forest coverage rate is only 22.35%. On the one hand, because of the serious desertification, rocky desertification, and soil erosion in northwest China, on the other hand, because of the high proportion of domestic agriculture, there is a great demand for water resources and arable land. 2) Meanwhile, China’s rich coal, poor oil, a little gas, and energy-intensive industries have resulted in a PM2.5 concentration of 52.66, compared with 7.41 in the United States.
China ranks 13th in energy factor. China is the world’s largest energy consumer, accounting for 24% of global energy consumption and 34% of global growth in energy consumption in 2019. 1) In the primary energy consumption, fossil fuels account for 87.67% of energy consumption, among which coal account for 58%. 2) Fossil fuels account for 72.96% of electricity generation. 3) Due to China’s heavy reliance on fossil fuels, CO2 intensity is as high as 3.37, compared with 1.25 in France. 4) China has been optimizing its energy structure for many years, with coal consumption accounting for 58%, down from 72% a decade ago. In 2019, renewable energy consumption grows 29%, accounting for 45% of global growth.
Conclusions and Suggestions
Research Conclusions
This article focuses on the low-carbon economy development evaluation indicators at the nation level, taking the world’s top 20 countries in CO2 emissions as the research observations, closely concentrating on the concept of low-carbon economy, based on the five principles of index evaluation (comprehensiveness, effectiveness, applicability, correlation, and foresight), 40 indicators were selected from five dimensions of economy, society, science and technology, environment, and energy structure.
Since there are so many indicators to measure the development of a country’s low-carbon economy, we need to reduce the data dimension. Factor analysis is a multivariate technique that tries to identify a relatively small number of factors that represent the joint behavior of interdependent original variables. Thus, by using correlation coefficients to group variables, four factors, energy factor, society factor, economy factor, and environment factor, are generated and extracted. Then, based on the factor scores, the ranking of the four factors and the total score of 20 countries are given. In the end, South Korea, France, China, Canada, and Germany ranked among the world’s top five countries in terms of low-carbon economy development and competitiveness.
Furthermore, through the evaluation index system of international low-carbon economy development, we have clearly identified the strengths and weaknesses of the 20 countries in developing a low-carbon economy, which will help China to define its own position, discover its own problems, identify the right development direction, learn useful experience, draw lessons from the experience, and avoid repeating the same mistakes.
Measures and Suggestions
Overall, China’s low-carbon economy development is in a relatively favorable position, ranking the third in the world. It is most prominent in terms of economic strength (No. 1), but underperforms in terms of social development (No. 9) and environmental carrying capacity (No. 9). The biggest weakness is in the energy structure (No. 13).
Taking into account China’s national conditions, development stage, sustainable development strategy, and international responsibility, China should accelerate the development of low-carbon economy, focus on key points, strengthen weak areas, and refine various indicators and tasks.
1) Promoting high-quality, efficient, and steady economic development. We will accelerate the development of advanced manufacturing and modern service industries, and apply the concept of low-carbon development to the whole process of urban planning, construction and management, and raise people’s income through targeted poverty alleviation and full employment.
2) Strengthening support for science, technology, and human resources. For developing countries, in a relatively short period of time and at a lower cost, for realizing low-carbon technological innovation, we can not only introduce, imitate, and purchase patents, but also need to strengthen the research and development new technologies such as energy saving and consumption reduction, renewable energy and advanced nuclear energy, carbon capture, utilization, and storage. And most importantly, giving priority to education.
3) Increasing carbon sink and reducing environmental pollution. We will continue to take action to prevent and control air pollution from its source with all the people, and build an environmental governance system in which the government plays the leading role, enterprises play the main role, and social organizations and the public participate.
4) Building a low-carbon energy system and forming an energy-saving and low-carbon industrial system. In 2019, China’s energy structure continued to improve: the proportion of coal consumption in the primary energy reached a record low (57.7%); renewable energy consumption grew 14.2%, accounting for 26% of global growth. China’s electricity generation accounted for 96% of net global growth. Compared with 2018, solar power generation increased by 26.5%, wind power by 10.9%, biomass and geothermal energy by 9.7%, and water power by 5.9%. Nuclear power generation grew by 18.2%, higher than the 10 years average growth rate (+15%), and China accounted for 56% of the global increase (Dudley Bob, 2020). China will continue to follow a new path of industrialization, develop the circular economy, improve the industrial structure, strictly control the expansion of industries that have high emissions and energy intensive, speed up the phasing out of backward production facilities, and vigorously develop the service sector and strategic emerging industries.
Data Availability Statement
The original contributions presented in the study are included in the article/Supplementary Material, further inquiries can be directed to the corresponding author.
Author Contributions
All authors listed have made a substantial, direct, and intellectual contribution to the work and approved it for publication.
Conflict of Interest
The authors declare that the research was conducted in the absence of any commercial or financial relationships that could be construed as a potential conflict of interest.
Publisher’s Note
All claims expressed in this article are solely those of the authors and do not necessarily represent those of their affiliated organizations, or those of the publisher, the editors and the reviewers. Any product that may be evaluated in this article, or claim that may be made by its manufacturer, is not guaranteed or endorsed by the publisher.
References
Azizalrahman, H., and Hasyimi, V. (2018). Towards a Generic Multi-Criteria Evaluation Model for Low Carbon Cities. Sustain. Cities Soc. 39, 275–282. doi:10.1016/j.scs.2018.02.026
Bao, J. Q., Miao, Y., and Chen, F. (2008). Low Carbon Economy: Revolution in the Way of Human Economic Development. China Ind. Econ. 241 (4), 153–160. doi:10.19581/j.cnki.ciejournal.2008.04.018
Cao, Y. P. (2018). Research on the Evaluation Method of Low Carbon Economy index System under the Background of Supply-Side Reform. Knowledge Economy 10, 18–19. doi:10.15880/j.cnki.zsjj.2018.10.009
Dagoumas, Α. S., and Barker, T. S. (2010). Pathways to a Low-Carbon Economy for the UK with the Macro-Econometric E3MG Model. Energy Policy 38 (6), 3067–3077. doi:10.1016/j.enpol.2010.01.047
Duan, Y., Mu, H., Li, N., Li, L., and Xue, Z. (2016). Research on Comprehensive Evaluation of Low Carbon Economy Development Level Based on AHP-Entropy Method: a Case Study of Dalian. Energ. Proced. 104, 468–474. doi:10.1016/j.egypro.2016.12.079
Fan, H. M., Xu, Z. L., and Zhang, R. (2018). The Urban Low-Carbon Traffic Evaluation index System Based on DPSIR Model: the Case of Dalian. Ecol. Economy 34 (04), 64–69.
Fávero, L. P., and Belfiore, P. (2019). “Principal Component Factor Analysis,” in Data Science for Business and Decision Making. Editors L. P. Fávero, and P. Belfiore, Cambridge, MA: Academic Press, 383–438. doi:10.1016/B978-0-12-811216-8.00012-4
Fu, J. F., and Liu, X. M. (2010). A Framework for China’s Low Carbon Economy on the Basis of Scenario Analysis and Discussion on Relevant Issues. Resour. Sci. 32 (2), 205–210.
Fu, J. F., Zheng, L. C., and Cheng, X. L. (2011). China's Low-Carbon Economic Development: an Inter-provincial and International Comparison. Resour. Sci. 33 (04), 664–674.
Fu, J. F., Zhuang, G. Y., and Gao, Q. X. (2010). Conceptual Identification and Evaluation index System for Low Carbon Economy. China Popul. Resour. Environ. 20 (8), 38–43. doi:10.3969/j.issn.1002-2104.2010.08.007
Fu, Y., Ma, Y. H., Liu, Y. J., and Niu, W. Y. (2008). Development Patterns of Low Carbon Economy. China Popul. Resour. Environ. 18 (3), 14–18.
Government, H. M. (2009). The UK Low Carbon Transition Plan: National Strategy for Climate and Energy. London: Department of Energy & Climate Change. TSO (The Stationery Office) http://www.decc.gov.uk/.
He, J. K., Zhou, J., Liu, B., and Sun, Z. Q. (2010). Global Trends of Low Carbon Economy and China’s Responses. World Econ. Polit. 9 (04), 18–35+156.
Hughes, N., and Strachan, N. (2010). Methodological Review of UK and International Low Carbon Scenarios. Energy policy 38 (10), 6056–6065. doi:10.1016/j.enpol.2010.05.061
Kinzig, A. P., and Kammen, D. M. (1998). National Trajectories of Carbon Emissions: Analysis of Proposals to foster the Transition to Low-Carbon Economies. Glob. Environ. Change 8 (3), 183–208. doi:10.1016/S0959-3780(98)00013-2
Lan, Q. X., and Zheng, X. D. (2013). Study on index System and International Evaluation of China's Low-Carbon Economy Development Level: an Observation Based on the Comparison of G20 Countries. J. Beijing Normal Univ. (Social Sciences) 58 (02), 135–144.
Lu, S. H, and Zhu, Q. G. (2013). Review on the Evaluation System of China's Low Carbon Economy. Mod. Manag. Sci. (12), 12–14. doi:10.4236/lce.2013.41002
Luo, Z.-q., and Tong, X.-f. (2011). “Evaluation on Development Capability of Low-Carbon Economy and Countermeasures in China,” in Procedia Environmental Sciences in Proceedings of 2011 3rd International Conference on Environmental Science and Information Application Technology (ESIAT 2011). Xian, China, August 20-21, 2011, 902–907. doi:10.1016/j.proenv.2011.09.144
Lv, X. D., WangHuang, Y. P. C., and Sun, J. (2013). Research on Assessment Method on index System of Low-Carbon Economy. China Popul. Resour. Environ. 23 (07), 27–33. doi:10.3969/j.issn.1002-2104.2013.07.005
Pan, J. H., Zhuang, G. Y., Zheng, Y., Zhu, S. X., and Xie, Q. Y. (2010). Clarification of the Concept of Low-Carbon Economy and Analysis of its Core Elements. Int. Econ. Rev. 18 (04), 88–101+5.
Pei, X. J., and Tan, Y. (2013). Research Progress of Urban Low Carbon Economic Development Evaluation. Stat. Decis. 29 (24), 30–34. doi:10.13546/j.cnki.tjyjc.2013.24.018
Shi, X. F., Sun, Y., and Cui, Y. (2018). Evaluation of Low Carbon Economic Development Level in Tianjin Based on Entropy Principal Component Analysis. Sci. Tech. Manag. Res. 38 (03), 247–252. doi:10.3969/j.issn.1000-7695.2018.03.037
Strachan, N., Foxon, T., and Fujino, J. (2008). Modelling Long-Term Scenarios for Low Carbon Societies (Climate Policy). London: Earths can Publications Ltd.
Tao, W. (2017). Multi-point Cooperative Multicast Video Design and Research. Coop. Economy Sci. 33 (20), 36–38. doi:10.1109/iccnea.2017.36
Wang, X. Y., and Pan, J. Y. (2019). Evaluation of Development Level of Low Carbon Economy in Manufacturing Industry of Shaanxi Province Based on Drift. Sci. Tech. Manag. Res. 39 (24), 240–246. doi:10.3969/j.issn.1000-7695.2019.24.032
Xie, Z. X., QinShen, Y. C. W., and Rong, P. J. (2017). Efficiency and Impact Factors of Low Carbon Economic Development in China. Econ. Geogr. 37 (03), 1–9. doi:10.15957/j.cnki.jjdl.2017.03.001
Xu, X., and Liu, C. Y. (2014). Construction and Demonstration of Urban Low Carbon Competitiveness Evaluation index System. Stat. Decis. 12 (21), 60–61. doi:10.13546/j.cnki.tjyjc.2014.21.016
Yan, Y. G., and Ma, M. (2015). Research on the Evaluation Indicator System of Regional Low Carbon Competitiveness Based on AHP-EM-TOPSIS Resultant Evaluation Methods-Based on the Empirical Evaluation Study of Chongqing. Sci. Tech. Manag. Res. 35 (7), 39–45+57. doi:10.3969/j.issn.1000-7695.2015.07.008
Yang, Y. (2012). Research on Evaluation of Sichuan Low-Carbon Economy Efficiency. China Popul. Resour. Environ. 22 (06), 52–56. doi:10.3969/j.issn.1002.2104.2012.06.009
Yuan, H. C., Chen, Z. M., Wang, M., Li, W. W., and Liu, X. Y. (2017). Research on the Evaluation Index System of International Low-Carbon Cities. Sci. Tech. Economy Market (08), 76–77.
Zhang, K. M., Pan, J. H., and Cui, D. P. (2009). Low Carbon Development Theory. Beijing: China Environmental Science Press.
Zhi, Y. (2020). Weak and Stable World Economy: New Variables, New Drivers and New Opportunities. World Economy Stud. 39 (01), 3–10. doi:10.13516/j.cnki.wes.2020.01.001
Zhong, Y. Y. (2018). Construction and Empirical Analysis of Regional Low-Carbon Economic Evaluation index System in China. J. Nanjing Univ. Posts Telecommunications (Social Sci. Edition) 20 (01), 93–102. doi:10.14132/j.cnki.nysk.2018.01.013
Zhou, Z. G., Zhuang, G. Y., and Chen, Y. (2018). Assessment of Low-Carbon City Development: Theoretical Basis,analysis Framework and Policy Implications. China Popul. Resour. Environ. 28 (6), 160–169. doi:10.12062/cpre.20180317
Zhuang, G. Y. (2005). Analysis of the Ways and Potential of China's Low Carbon Economic Development. Stud. Int. Tech. Economy 8 (3), 79–87.
Zhuang, G. Y. (2020). Evaluation of Urban Low-Carbon Construction in China: Methods and Empirical Studies. Beijing: Social Sciences Academic Press.
Zhuang, G. Y. (2007). Low Carbon Economy: China's Development Road under the Background of Climate Change. Beijing: China Meteorological Press.
Zhuang, G. Y., Pan, J. H., and Zhu, S. X. (2011). The Connotation of Low Carbon Economy and the Construction of Comprehensive Evaluation index System. Econ. Perspect. 52 (1), 132–136.
2050 Japan Low-Carbon Society Project Team (2008). Japan Scenarios and Actions Towards Low-Carbon Societies (LCS). Available at: http://2050.nies.go.jp/LCS/jpn/japan.html (Accessed Mar 3, 2021).
Keywords: low-carbon economy, evaluation index system, international competitive power, principal component, factor analysis, China
Citation: Zhongyu Z and Zhongxiang Z (2021) The Construction and Empirical Study on Evaluation Index System of International Low-Carbon Economy Development. Front. Energy Res. 9:761567. doi: 10.3389/fenrg.2021.761567
Received: 20 August 2021; Accepted: 14 September 2021;
Published: 08 October 2021.
Edited by:
Jian Chai, Xidian University, ChinaReviewed by:
Ting Liang, Hunan University, ChinaQuanying Lu, Academy of Mathematics and Systems Science (CAS), China
Copyright © 2021 Zhongyu and Zhongxiang. This is an open-access article distributed under the terms of the Creative Commons Attribution License (CC BY). The use, distribution or reproduction in other forums is permitted, provided the original author(s) and the copyright owner(s) are credited and that the original publication in this journal is cited, in accordance with accepted academic practice. No use, distribution or reproduction is permitted which does not comply with these terms.
*Correspondence: Zhang Zhongyu, amd4eXp6eUB0anUuZWR1LmNu