 Qi Wang
 Zhou Zhang1,2
- 1Harbin Marine Boiler and Turbine Research Institute, Harbin, China
- 2National Engineering Laboratory for Marine and Ocean Engineering Power System—Marine Engineering Gas Turbine Laboratory, Harbin, China
In this paper, a numerical model based on the mass flow rate of seal leakage is presented, and a 3D numerical method of a multistage axial compressor with good engineering practicability is established. Validation consists of modeling a nine-stage axial compressor in all operating rotation speeds and calculating results of the performance characteristic curves in good agreement with test data. Comparisons are made against different cases of seal leakage mass flow rate for analyzing the impact of increasing seal leakage on the aerodynamic performance of the multistage axial compressor. The results indicate that the performance of the nine-stage axial compressor is degenerated faster and faster with seal leakage increasing in all operating working points, and the degeneration of performance of this compressor can be evaluated by the relationships of main performance parameters with the mass flow rate of seal leakage. Comparisons of flow distribution in the compressor for different cases of seal leakage also show that stators located in front stages of the multistage axial compressor are affected more seriously by the increasing seal leakage, and it can be confirmed that relatively larger flow losses in front stages bring significant impact on the decay of aerodynamic performance of a multistage axial compressor.
Introduction
A compressor plays a decisive role in the performance of aero-engines and gas turbines as an important core component. Nowadays, the compressor has a higher total pressure ratio, higher efficiency, and larger surge margin than itself in past years. To satisfy the requirement, more advanced aerodynamic design methods need to be developed and used. With the improvement of the compressor performance and aerodynamic design methods, the influence of actual structure on performance has been a key factor during the research of an advanced compressor. While a compressor aerodynamic scheme is designed, the impact level of any actual structure on performance must be thoughtful. It could ensure the performance directly when the designed compressor is applied practically. Up to now, a lot of research studies directed at the actual structure which has great influence on the internal flow of compressor have been carried out, such as the blade fillet (Debruge, 1980; Curlett, 1991; Hoeger et al., 2002), the tip clearance of rotor (Wang et al., 2018), the hub clearance of stator (Lu and Li, 2016), and so on (Khaleghi, 2019). Among them, the seal structure between the stator root and the disk is one of the most important actual structures and has a strong impact on compressor performance.
When the compressor stator has an inner ring, radial clearance must exist between the inner ring of the stator and disk. For this reason, the seal structure is usually used to reduce the air leakage at the radial clearance such as labyrinth seal and brush seal. Because the internal flow of seal cavity is very complex, and it has a strong interaction with the main flow region in the compressor, degeneration of seal effect can lead to the performance reduction of aero-engines and even the accident. Considering the specific fuel consumption, thrust–weight ratio, and reliability, advanced seal technology needs to be invented and used. And a lot of fundamental research studies on the seal effect and leakage flow have been carried out. For many years, the research studies in the field of seal technology mainly centered around theoretical, experimental, and numerical analysis (Wellborn, 2001; wellborn and Okiishi, 1996; Liu et al., 2014; Kong et al., 2017; Kim et al., 2019).
On the contrary, because of many reasons, for example, the seal cavity model is complex and the seal actual radial clearance is varied during the compressor operation, many research studies on seal performance have just been stopped at the principle analysis for seal itself. Few research studies are carried out on the effect of seal engineering application on the aerodynamic performance of a multistage axial compressor. Therefore, a numerical model which can be used to simulate the seal leakage at the stator root is set up based on the commercial code ANSYS CFX in this paper. And the impact of seal leakage at the stator root on the aerodynamic performance of a nine-stage axial compressor is investigated and analyzed.
Numerical Study
Numerical Model for Seal Leakage
The actual seal structure at the stator root is very complex, and the characteristic length in the seal cavity is much less than that in the main flow region. When an actual seal model (the scale is 1:1) is added to the three-dimensional numerical simulation of the multistage axial compressor, more difficulties will be faced and more time will be cost because of the heavy work of geometry modeling and meshing, and these problems may bring a long engineering design cycle. This is very adverse to the engineering application. Moreover, the main mode of action between the seal cavity and the main flow region in the compressor is the level of air leakage. To avoid the above problems, the mass flow rate of seal leakage can be chosen as the key research parameter of the effect of seal engineering application on the aerodynamic performance of a multistage axial compressor, and a simplified numerical model can be set up on this basis.
First, a two-dimensional meridian flow model is set up for seal leakage at the stator root. The meridian flow model can be carried out by the Meridional Techno Effects function in the AutoGrid5 package of NUMECA software. Figure 1A shows the schematic diagram of the meridian flow model. In this model, an interface for the definition of leakage needs to be set. Second, based on the two-dimensional meridian flow model, a three-dimensional seal leakage fluid domain model for the numerical simulation of signal blade passage of the multistage axial compressor can be set up. Figure 1B shows the three-dimensional seal leakage fluid domain model and the kinds of its boundary conditions which need to be set in ANSYS CFX software.
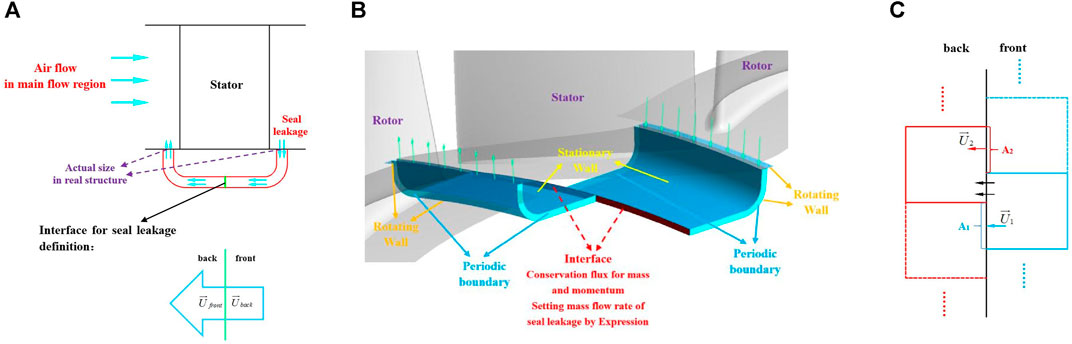
FIGURE 1. Meridian and Three-dimensional flow model of seal leakage. Meridian flow model for seal leakage at stator root (A), Three-dimensional seal leakage fluid domain model (B), Conservative flux transmissin method through the interface (C).
Through the interface, flux conservation transfer must be ensured. Because the model is a circular periodic symmetric model and the radial heights on either side of the interface are the same, the areas on either side of the interface must be equal. Figure 1C shows the flux transmission method through the interface. The flux on the intersection surface will be transported directly to the other side, and the flux
Flux conservation transfer through the interface (from
The mass control equation is
The momentum control equation is
For a Newtonian fluid,
The energy control equation is
And ht can be calculated as follows:
Physical Model
In this study, a nine-stage axial compressor is taken as the research object. The mass flow of this compressor exceeds 85.0 kg/s at its design rotation speed of 7285 rpm at the ISO ambient reference condition. The compressor has an inlet hub ratio of 0.371 and an inlet aspect ratio of 1.443. The inlet tip speed and inlet relative tip Mach number of this compressor are 355.6 m/s and 0.89, respectively. Table 1 shows the parameters of this compressor in detail.
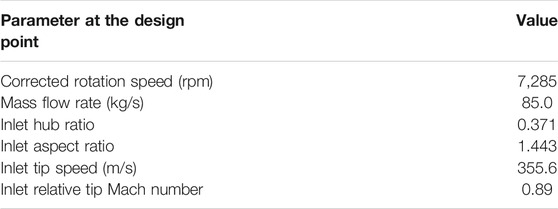
TABLE 1. Main parameters of the nine-stage axial compressor.
Figure 2A shows the main structures of the nine-stage axial compressor. The compressor consists of 19 blade rows that include one row of the inlet guide vane, nine rows of the rotor blade, and nine rows of the stator blade. It contains three rows of variable stators (IGV, S1, and S2), and they move in the range of 0.82∼0.9 n which are controlled by the corrected rotation speed as depicted in Figure 2B. From S3 to S8, there are labyrinth seals at the roots of stators.
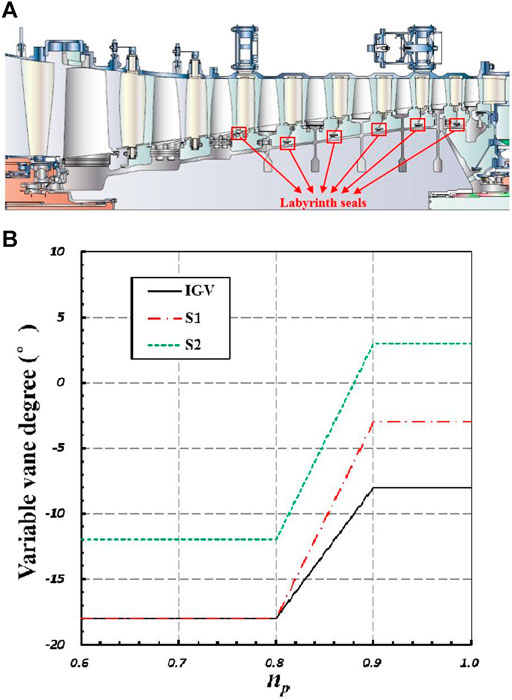
FIGURE 2. Basic structural parameters of the nine-stage axial compressor. Main structures of the nine-stage axial compressor (A), Variable vane degree related to non-dimensional corrected rotation speed (B).
Numerical Research Method
The steady and viscous three-dimensional numerical simulation of the nine-stage axial compressor is carried out in this study. Figure 3 shows the computational mesh generation of the compressor. A structure grid is generated in the mesh discretization of computational regions with the AutoGrid5 package of NUMECA software. The O4H grid topology is used in the main flow region of compressor blade passage, and the H grid topology is used in the fluid domain of seal cavity. The tip clearance of rotor is 0.5 mm, and a butterfly mesh topology is used in this region. The fillets at each root of the rotor and top of the stator have the same actual size as the compressor rig. The present simulation uses the commercial code ANSYS CFX to solve the 3D compressible Reynolds-averaged Navier–Stokes equations, which is conducted on a parallel computer. And the standard κ-ε turbulence model is adopted to calculate the turbulence in this study, which is a two-path turbulence model proposed by Launder and Spalding in 1972.
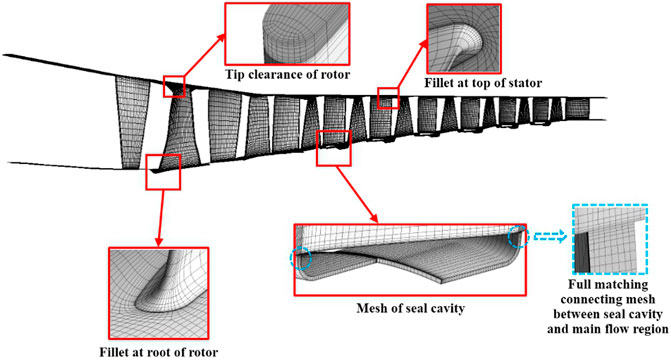
FIGURE 3. Computational mesh generation of the nine-stage axial compressor.
In the process of mesh generation, the dimensionless wall distance parameter y+ is considered by controlling the distance between the first layer grid nodes adjacent to the wall. The equation of y+ is as follows:
where
For meeting the y+ requirement of the standard κ-ε turbulence model, the height of the first layer of grids is determined as 0.01 mm, and the scalable wall function is used as the wall-function method which can be a consistent solution for any encrypted grid and avoid the deterioration of computed results when y+ < 15 (Chedevergne, 2018).
The leakage mass flow rate at the interface of every seal cavity is determined as the test result of the nine-stage compressor. During the compressor test, the leakage mass flow rate at every seal structure is measured, and the test results are 0.27–0.32% of the mass flow rate at the compressor inlet. For letting it be more convenient to compare the effect of different leakages, the leakage mass flow rate at every seal structure is determined as 0.3% of the mass flow rate at the compressor inlet to simulate the experiment condition.
The total pressure and total temperature at the inlet and the circumferential averaged static pressure at the outlet are given in the boundary conditions of the nine-stage axial compressor. The fractional intensity and eddy length scale of inlet turbulence boundary conditions are specified as 0.02 and 0.003 m, respectively. The rotor–stator interface conditions are set as the mixing plane. No slip and adiabatic conditions are specified on the hub, shroud, and blade wall.
Validation of Numerical Method
For proving the applicability of the numerical model to seal leakage and the numerical method in this study, the three-dimensional numerical simulation of the nine-stage axial compressor by the above method is carried out and the boundary conditions are set the same as the compressor test conditions. At the same time, the isentropic efficiency is calculated by the method of compressor test as
where the value of k can be calculated as follows when the temperature of air is between 242 and 1000 K:
Here, the values of Bi which are the temperature polynomial coefficients of air thermal properties are shown as follows: B1 = 0.72806730 × 101, B2 = −0.14341481 × 10⁻², B3 = 0.23482926 × 10⁻⁵, B4 = −0.10484129 × 10⁻⁸, and B5 = 0.12429040 × 10⁻¹².
At first, the effect of grid number on the numerical results is evaluated. Different cases of grid number for each blade row are determined as 50 thousand, 100 thousand, 200 thousand, 300 thousand, 500 thousand, and 700 thousand grid cells. The grid sensitivity has been studied by evaluating G/GDP, π/πDP, and η/ηDP at the design point of the compressor, as shown in Figure 4. According to the results, the compressor performance parameters are considered sufficiently refined to obtain results which are independent of the grid number after each blade row exceeds 300 thousand grid cells. To minimize the computational time, the case of 300 thousand grid cells for each blade row is determined for considering the nine-stage axial compressor in this study.
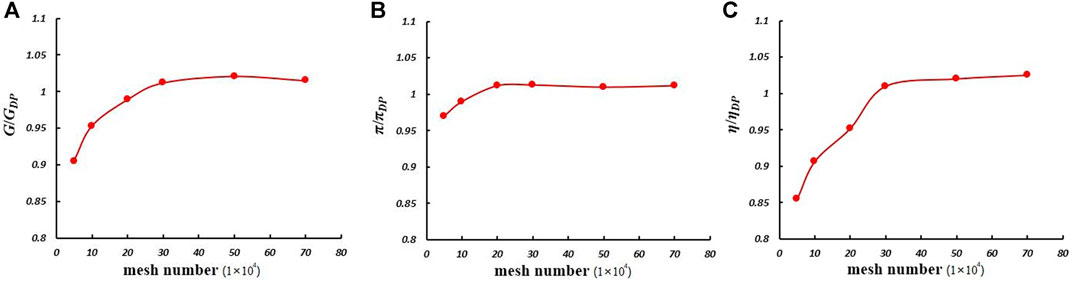
FIGURE 4. Grid sensitivity analysis for the computational results of total performance parameters. Corrected mass flow (A), Total pressure ratio (B), Isentropic efficiency (C).
Figure 5 shows the result comparison of characteristic curves for the compressor performance between computation and test. The computational results are consistent with the test results. At 100%n and 95%n, the values of G, π, and η match with the test results very well. From 60%n to 90%n, the computational results have a few deviations from the test results and the largest deviation appears at 60%n. Nonetheless, the surge line of computational results is very consistent with the test results. According to the comparison, the configurations of the numerical method and grid number in this study are considered sufficiently refined to obtain results.
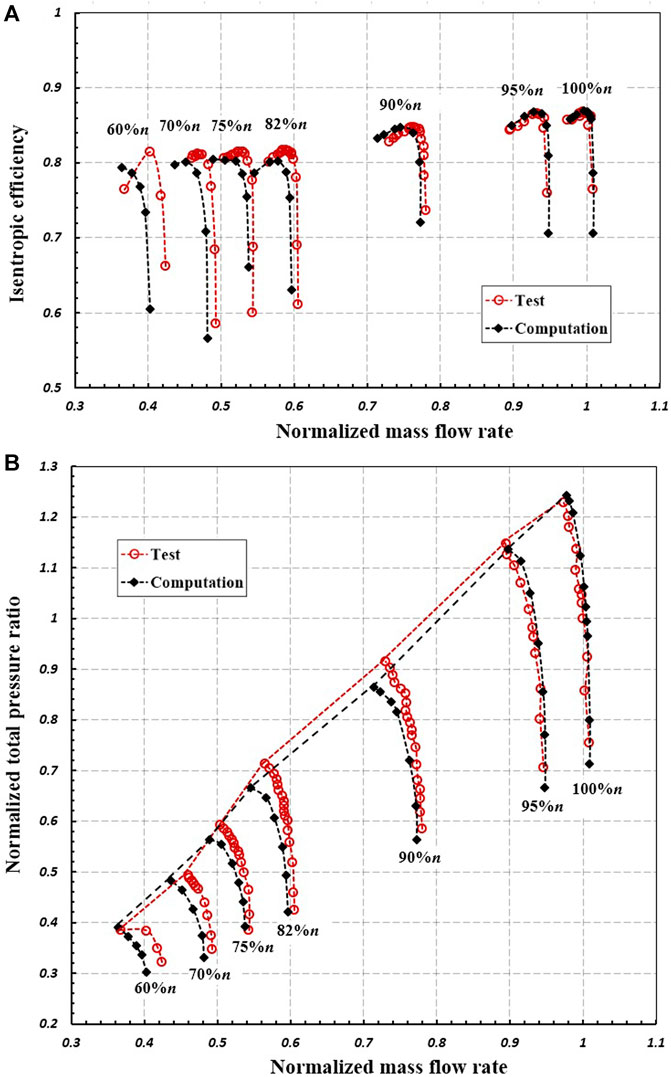
FIGURE 5. Comparison of characteristic curves for the compressor performance between computation and test. Characteristics of isentropic efficiency relative to normalized mass flow rate (A), Characteristics of normalized total pressure ratio relative to normalized mass flow rate (B).
Results and Discussions
In this section, different cases of seal leakage for the nine-stage axial compressor are simulated and compared to research the effect on aerodynamic performance. These cases are 0 (no leakage), 0.3, 0.5, and 0.7% of the mass flow rate at the compressor inlet. 75%n, 90%n, and 100%n are selected as the rotation speeds analyzed.
Impact on Overall Performance of Compressor
The computational results of overall performance parameters in different cases of seal leakage at the design point of the compressor are shown in Figure 6. In the figure, the changing rules of
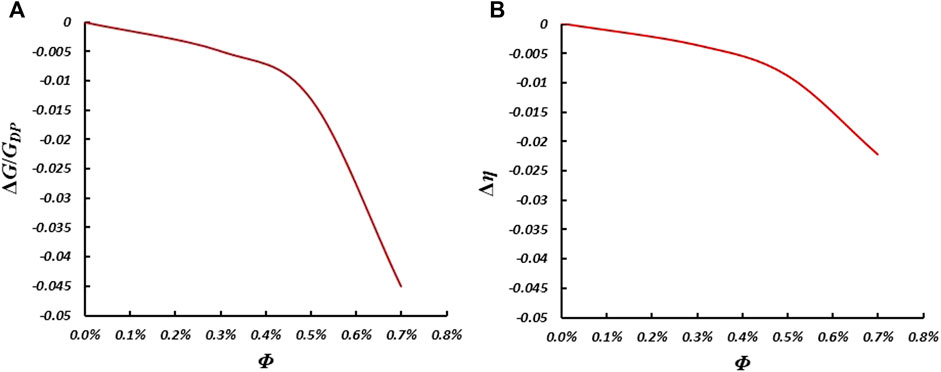
FIGURE 6. Changing curves of compressor performance parameters related to the seal leakage at design point. ΔG/GDP related to Φ (A), Δη related to Φ (B).
Figure 7 shows the result comparison of characteristic curves for the compressor performance in different cases of seal leakage. With the increasing seal leakage, the performance of the compressor is degenerated obviously. When the seal leakage increases, the corrected mass flow rate, the self-pressurizing ability, the isentropic efficiency, and the surge margin are fully degenerated.
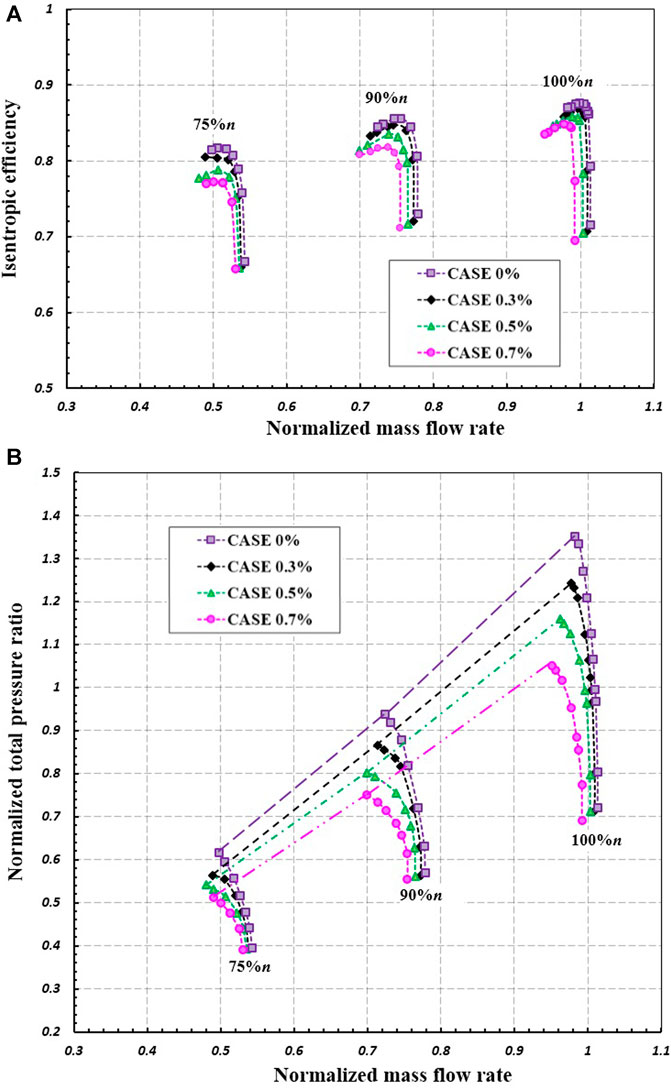
FIGURE 7. Comparison of characteristic curves for the compressor performance on different cases of seal leakage. Characteristics of isentropic efficiency relative to normalized mass flow rate (A), Characteristics of normalized total pressure ratio relative to normalized mass flow rate (B).
For investigating the changing multistage compressor performance related to the seal leakage in different rotation speed curves, the variation of equivalent corrected mass flow rate ΔGequ is defined as
where N is the interpolation point between the choke point and the stall point on each rotation speed curve of this compressor.
The variation of equivalent corrected mass flow rate
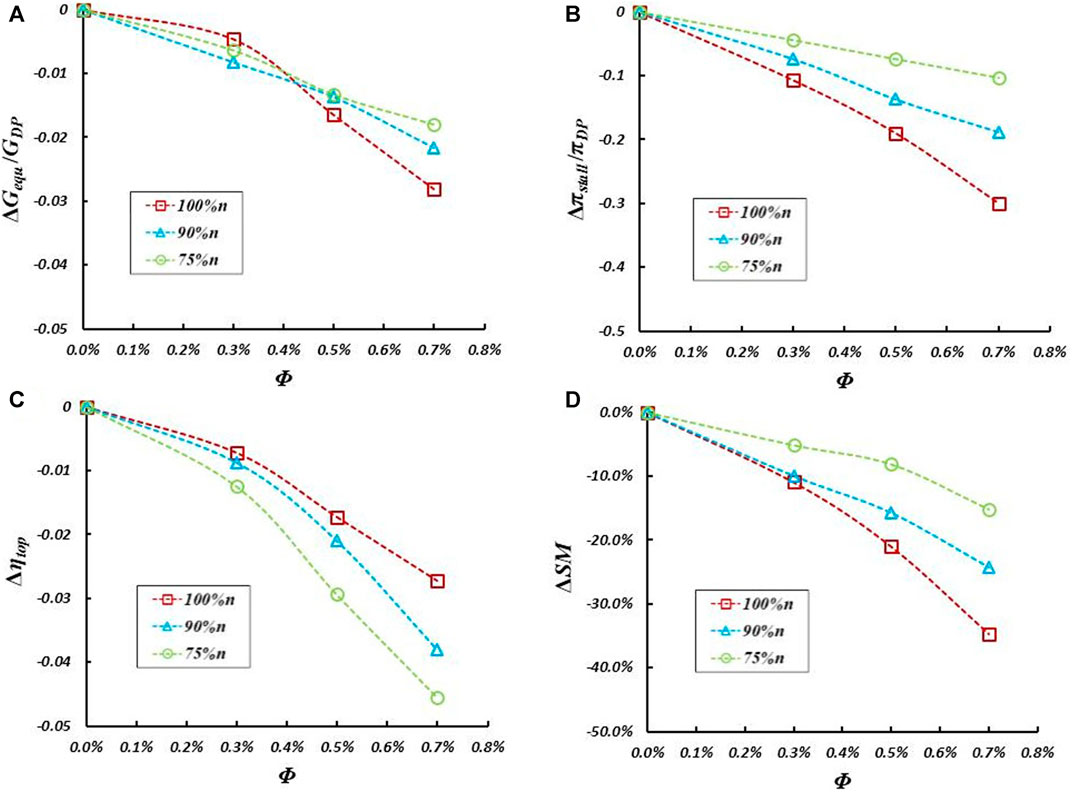
FIGURE 8. Changing curves of compressor performance parameters related to the seal leakage at different rotation speeds. ΔGequ/GDP related to Φ (A), Δπstall/πDP related to Φ (B), Δηtop related to Φ (C), ΔSM related to Φ (D).
Analysis of Compressor Internal Flow Distribution
For analyzing the loss situation in stator passage, the total pressure loss coefficient proposed by Lieblein and Roudebush (1956) is used. It is given as
where
Figures 9A,B, respectively, show the distribution along the span of the blade from S3 to S8 at the design point of 100%n and the nearest stall point of 75%n when the mass flow rate of seal leakage changes. As shown in Figure 9A, at the design point of 100%n, the total pressure loss of each stator is increased with the increasing seal leakage and the affected region of each stator is mainly under 20% span of blade height. When the mass flow rate of seal leakage becomes 0.7% of the inlet mass flow rate, flow field degradation occurs in S3 passage first, almost 40% span of S3 blade height from the root is affected, and the total pressure loss is obviously increased. It is the main reason which brings the decay of performance when the mass flow rate of seal leakage becomes greater than 0.5% for the nine-stage compressor, as shown in Figure 6.
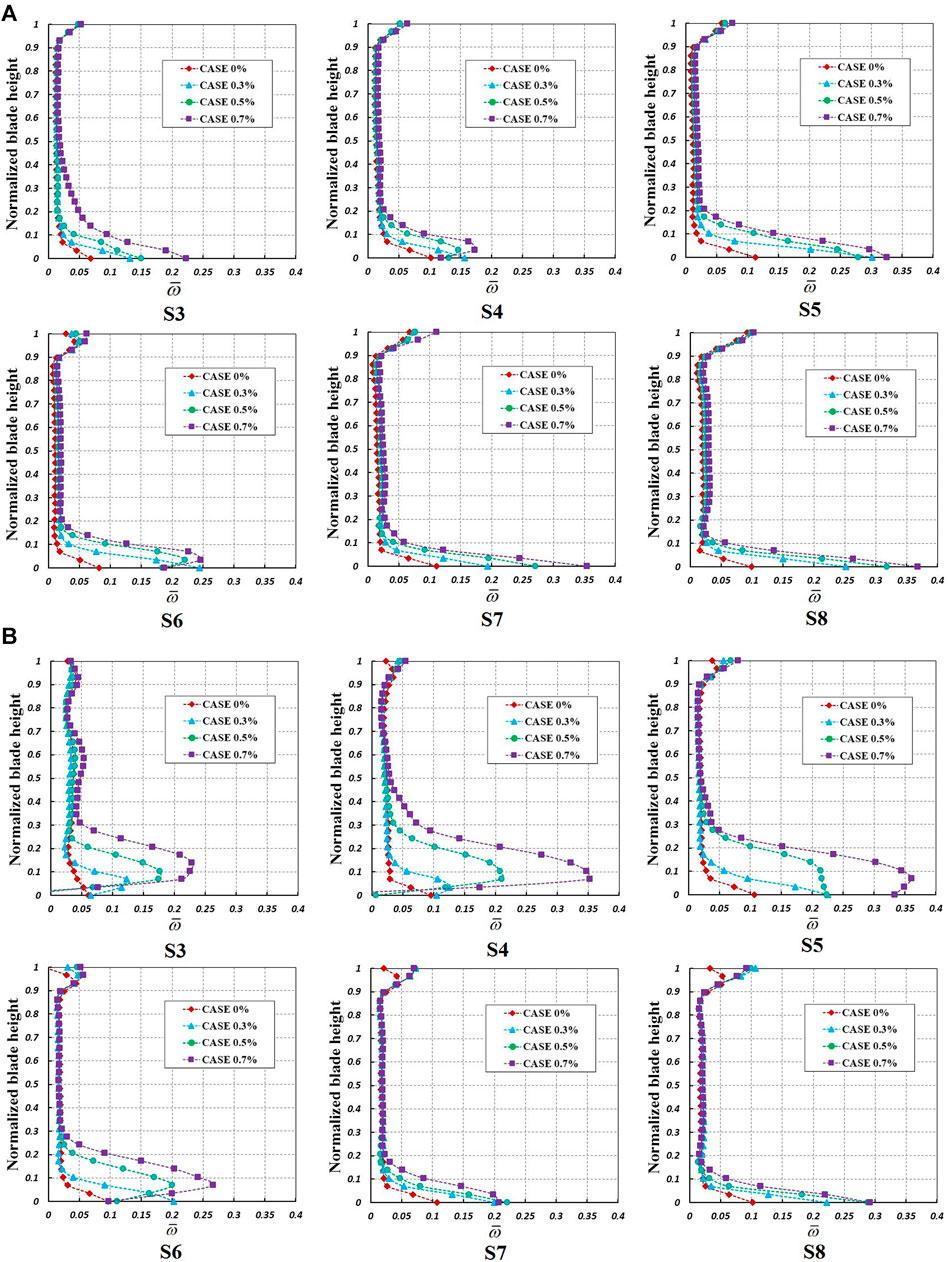
FIGURE 9. Distribution of
As shown in Figure 9B, at the nearest stall point of 75%n, the total pressure loss of each stator is also increased with the increasing seal leakage like the phenomenon at the design point of 100%n. For stators from S3 to S6, when the mass flow rate of seal leakage becomes greater than 0.3%, the total pressure loss near the root of these stators is obviously increased, and the affected blade height of these stators is almost developed near 30% span. When the mass flow rate of seal leakage becomes 0.7% of the inlet mass flow rate, the affected region of S4 is close to 50% span of blade height. The performance degradation of these stators causes the decay of compressor performance and serious stall, so both isentropic efficiency and surge margin of the compressor have a fast decline. As illustrated in Figures 9A,B, for the nine-stage compressor, the stators located in front stages are affected more seriously by the increasing seal leakage than the stators located in back stages wherever the working point of the compressor is.
For further verifying the impact of increasing seal leakage, the distribution of flow angle α2 at each stator outlet along the span of the blade from S3 to S8 at the above two operating points is shown in Figures 10A,B, respectively. As illustrated in the figures, the outlet flow angle of each stator is increased with the increasing seal leakage at both the design point of 100%n and the nearest stall point of 75%n. And the phenomenon is consistent with the distribution shown in the above figures. It indicates that the internal flow of each stator passage is affected by the increasing seal leakage. When the seal leakage increases, the flow loss of the stator is increased, and it causes the deviation angle to increase. It influences the flow matching of blade passages, which can obviously cause compressor performance degradation. With the increasing seal leakage, it can also be seen that the stators located in front stages have larger deviation angles than the stators located in back stages of the nine-stage compressor, which is the same as the phenomenon of total pressure loss distribution.
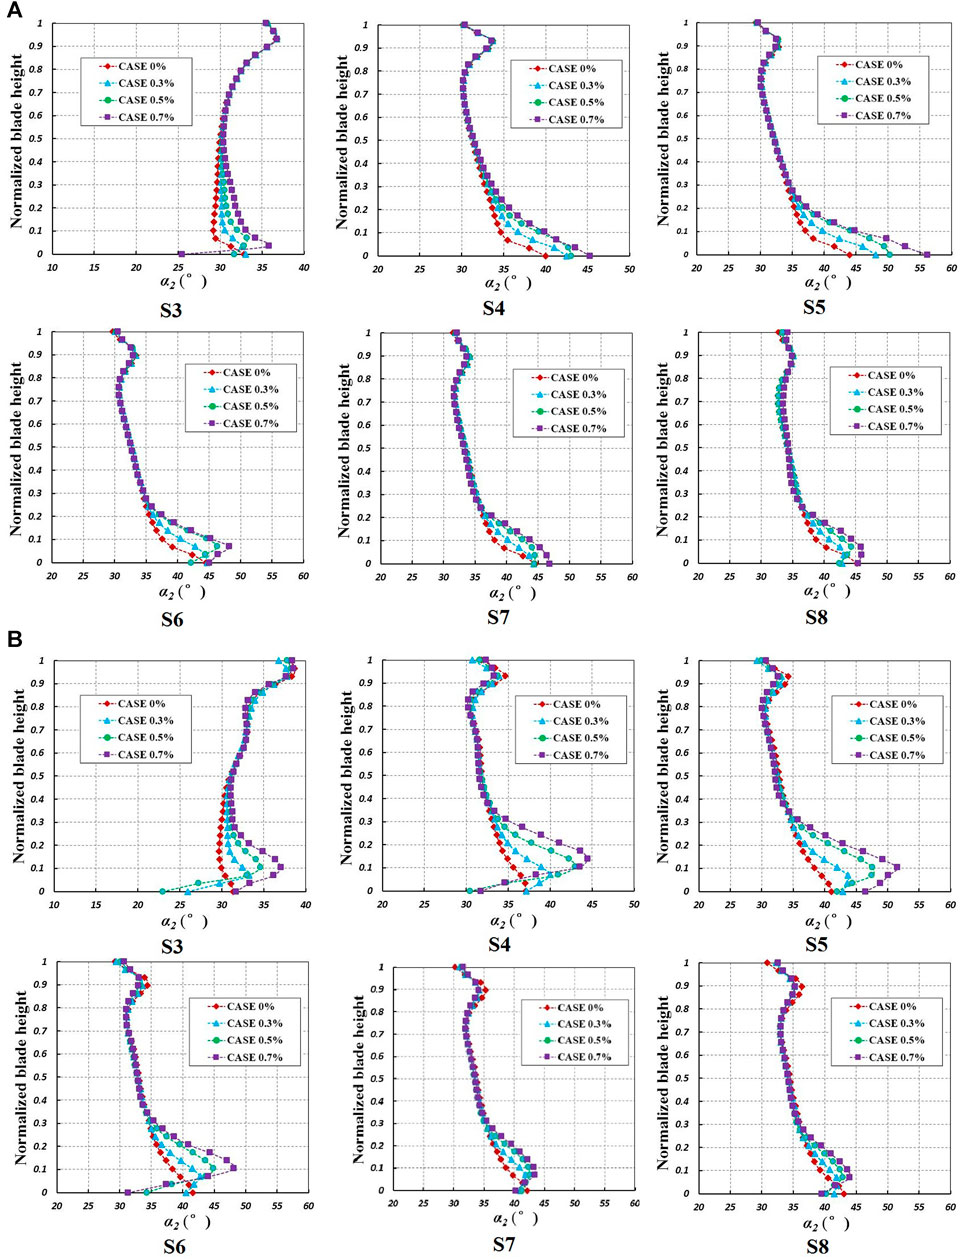
FIGURE 10. Distribution of α2 at each stator along its span at the design point of 100%n (A), The nearest stall point of 75%n (B).
Figures 11, 12, respectively, show the relative Mach number contours of 10% span on the blade-to-blade surface at the design point of 100%n and the nearest stall point of 75%n when the mass flow rate of seal leakage changes. At the design point, an obvious separation appears at the 10% span of S3 when the mass flow rate of seal leakage becomes 0.7% of the inlet mass flow rate. And at the nearest stall point of 75%n, serious flow separations occur at the 10% span of stators from S3 to S6 when the mass flow rate of seal leakage becomes 0.5% of the inlet mass flow rate, and the separations are developed more seriously when the seal leakage increases to 0.7% of the inlet mass flow rate. The separation vortices choke the whole passage of stators from S3 to S6, and the flow of downstream rotors is affected and separated.
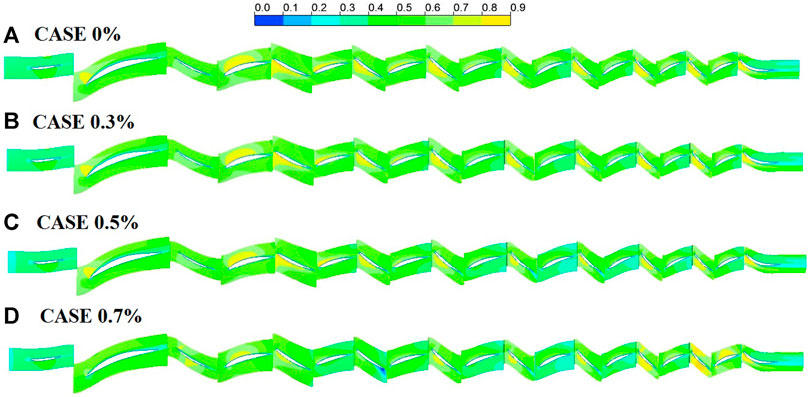
FIGURE 11. Relative Mach number contours of 10% span at the design point of 100%n. CASE 0% (A), CASE 0.3% (B), CASE 0.5% (C), CASE 0.7% (D).
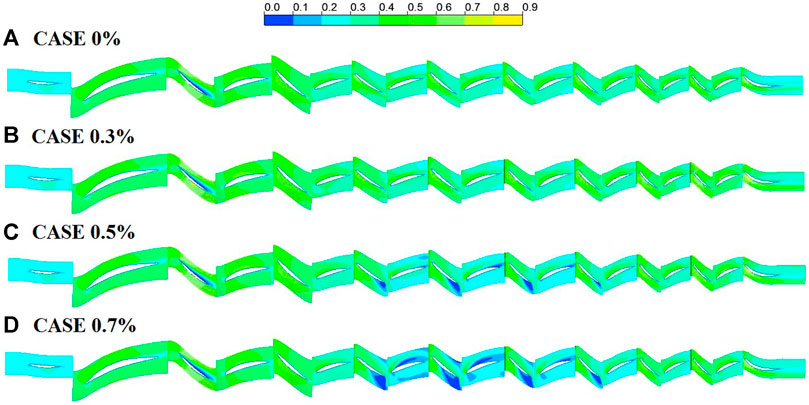
FIGURE 12. Relative Mach number contours of 10% span at the nearest stall point of 75%n. CASE 0% (A), CASE 0.3% (B), CASE 0.5% (C), CASE 0.7% (D).
For further analysis of the impact of increasing seal leakage on the details of flow distribution at the stator root, S3 is chosen because it is one of the most serious stators in front stages which is affected by seal leakage. Figure 13 shows the 3D streamlines near the root region of S3 with the increasing mass flow rate of seal leakage at the nearest stall point of 75%n. The 3D flow details near the space of the stator root region can be clearly seen from the figure. At the stator root region, the air enters the seal cavity from the trailing edge of the stator and flows out from the leading edge. It mixes with the main flow of blade passage, and strong interaction occurs between leakage flow and main flow. With the increasing seal leakage, the interaction becomes stronger and the affected region increases larger. It causes more serious flow separation at the trailing edge of the blade root and aggravates the corner stall of the stator.
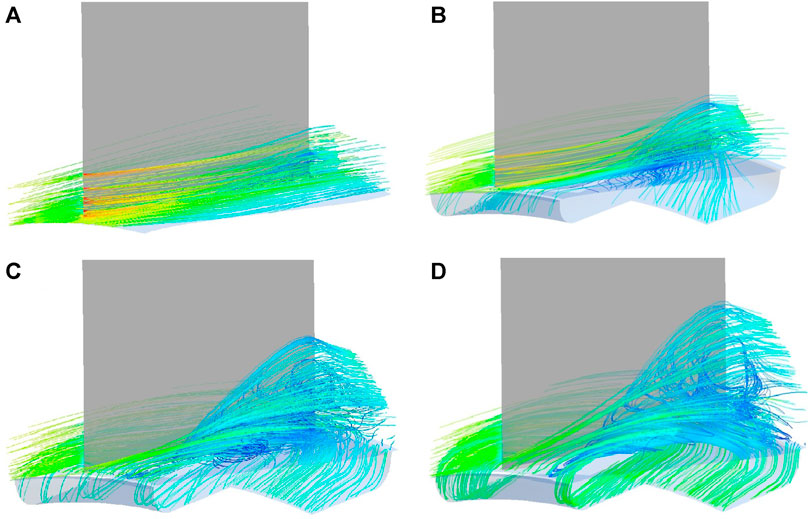
FIGURE 13. 3D streamlines near the root region of S3 at the nearest stall point of 75%n. CASE 0% (A), CASE 0.3% (B), CASE 0.5% (C), CASE 0.7% (D).
Conclusion
In this paper, a numerical model which can be used to simulate the seal leakage at the stator root is set up, and it is used in the analysis of the impact of increasing seal leakage on the aerodynamic performance of a nine-stage axial compressor. The performance characteristic parameters of the compressor are calculated, and their changing curves which are related to the mass flow rate of seal leakage are obtained. The flow conditions in the nine-stage compressor for different cases of seal leakage are simulated and compared at the same time. Based on the results, the main conclusions can be made as follows:
1) According to the comparison between computation and test, the engineering practicability and applicability of this numerical model to seal leakage in the multistage axial compressor is proved. Combined with the 3D numerical simulation method which is used in this paper, the aerodynamic performance of the nine-stage axial compressor can be predicted well. The numerical model and method are considered sufficiently refined to obtain results.
2) For a multistage compressor, with the increasing mass flow rate of seal leakage, the performance of the compressor is degenerated faster and faster when its working point is at the design point or others. The flow capacity, working capacity, efficiency, and surge margin of the compressor have an overall decline.
3) According to the internal flow distribution of the nine-stage compressor, when the mass flow rate of seal leakage increases, the stators located in front stages are affected more seriously by the increasing seal leakage than the stators located in back stages of a multistage compressor wherever the working point of the compressor is. Both degradation of flow condition and increase of flow loss in stators located in front stages develop faster with the increasing seal leakage. And this is the main reason that causes the decay of aerodynamic performance of a multistage compressor.
Data Availability Statement
The raw data supporting the conclusions of this article will be made available by the authors, without undue reservation.
Author Contributions
QW, ZZ, and QH contributed to conception and design of the study. WQ contributed to the numerical model. ZZ and HQ performed the numerical calculations. LR checked and helped analyze the calculation results. All authors contributed to manuscript revision and read and approved the submitted version.
Funding
This study was funded by the National Science and Technology Major Project (2017-Ⅱ-0006-0019).
Conflict of Interest
The authors declare that the research was conducted in the absence of any commercial or financial relationships that could be construed as a potential conflict of interest.
Publisher’s Note
All claims expressed in this article are solely those of the authors and do not necessarily represent those of their affiliated organizations, or those of the publisher, the editors, and the reviewers. Any product that may be evaluated in this article, or claim that may be made by its manufacturer, is not guaranteed or endorsed by the publisher.
Acknowledgments
The authors would like to acknowledge the support of National Engineering Laboratory for Marine and Ocean Engineering Power System—Marine Engineering Gas Turbine Laboratory.
References
Alizadeh, M., Nikkhahi, B., Farahani, A. S., and Fathi, A. (2014). Numerical Study on the Effect of Geometrical Parameters on the Labyrinth-Honeycomb Seal Performance. ASME Paper No. GT2014-25147.
Chedevergne, F. (2018). Analytical wall Function Including Roughness Corrections. Int. J. Heat Fluid Flow 73, 258–269. doi:10.1016/j.ijheatfluidflow.2018.08.001
Curlett, B. P. (1991). The Aerodynamic Effect of Fillet Radius in a Low Speed Compressor cascade. Cleveland, Ohio: NASA-TM-105347 Lewis Research Center.
Danish, S. N., Qureshi, S. R., Imran, M. M., Khan, S. U.-D., Sarfraz, M. M., El-Leathy, A., et al. (2016). Effect of Tip Clearance and Rotor-Stator Axial gap on the Efficiency of a Multistage Compressor. Appl. Therm. Eng. 99, 988–995. doi:10.1016/j.applthermaleng.2016.01.132
Debruge, L. L. (1980). The Aerodynamic Significance of Fillet Geometry in Turbocompressor Blade Rows. J. Eng. Gas Turb. Power 102, 984–993. doi:10.1115/1.3230371
Denecke, J., Dullenkopf, K., Wittig, S., and Bauer, H.-J. (2005). Experimental Investigation of the Total Temperature Increase and Swirl Development in Rotating Labyrinth Seals. ASME Paper No. GT2005-68677, 1161–1171. doi:10.1115/gt2005-68677
Galindo, J., Tiseira, A., Navarro, R., and López, M. A. (2015). Influence of Tip Clearance on Flow Behavior and Noise Generation of Centrifugal Compressors in Near-Surge Conditions. Int. J. Heat Fluid Flow 52, 129–139. doi:10.1016/j.ijheatfluidflow.2014.12.004
Hoeger, M., Baier, R. D., Müller, R., and Engber, M. (2006). “Impact of a Fillet on Diffusing Vane Endwall Flow Structure,” in The 11th International Symposium on Transport Phenomena and Dynamics of Rotating Machinery. ISROMAC2006-057, Honolulu, Hawaii, Feb 2006.
Hoeger, M., Schmidt-Eisenlohr, U., Gomez, S., Sauer, H., and Müller, R. (2002). Numerical Simulation of the Influence of a Fillet and a Bulb on the Secondary Flow in a Compressor cascade. Task Q. 6, 25–37.
Kumar, S. S., Bhanudasji Alone, D., Thimmaiah, S. M., Mudipalli, J. R. R., Ganguli, R., Kandagal, S. B., et al. (2018). Aerodynamic Characterization of a Transonic Axial Flow Compressor Stage - with Asymmetric Tip Clearance Effects. Aerospace Sci. Tech. 82-83, 272–283. doi:10.1016/j.ast.2018.09.001
Khaleghi, H. (2019). Effect of Discrete Endwall Recirculation on the Stability of a High-Speed Compressor Rotor. Aerosp. Sci. Technol. 85, 171–179.
Kim, S., Kim, K., and Son, C. (2019). Three-dimensional Unsteady Simulation of a Multistage Axial Compressor with Labyrinth Seals and its Effects on Overall Performance and Flow Characteristics. Aerospace Sci. Tech. 86, 683–693. doi:10.1016/j.ast.2019.01.055
Kong, X., Liu, G., Liu, Y., and Zheng, L. (2017). Experimental Testing for the Influences of Rotation and Tip Clearance on the Labyrinth Seal in a Compressor Stator Well. Aerospace Sci. Tech. 71, 556–567. doi:10.1016/j.ast.2017.10.003
Liu, G. W., Chen, K., Gang, T., and Zheng, H.-L. (2015). Influences of Pressure Ratio and Reynolds Number on Flow Characteristics of Labyrinth Seal in Compressor Stator Well. J. Aerosp. Power 30, 1554–1560. doi:10.13224/j.cnki.jasp.2015.07.003
Launder, B. E., and Spalding, D. B. (1972). Mathematical Models of Turbulence. London, UK: Academic Press.
Lieblein, S., and Roudebush, W. H. (1956). Theoretical Loss Relations for Low-Speed Two-Dimensional-cascade Flow. NACA-TN-3662.
Liu, G. W., Kong, X. Z., and Cheng, K. (2014). Numerical Study for Effects of Rotation and Swirl on Labyrinth Sealing in a Compressor Stator Well. J. Propuls. Technol. 35, 1687–1693.
Lu, H., and Li, Q. S. (2016). Cantilevered Stator Hub Leakage Flow Control and Loss Reduction Using Non-uniform Clearances. Aerosp. Sci. Technol. 51, 1–10. doi:10.1016/j.ast.2016.01.013
Micio, M., Facchini, B., Innocenti, L., and Simonetti, F. (2011). Experiment Investigation on Leakage Loss and Heat Transfer in a Straight through Labyrinth Seal. ASME Paper No. GT2011-46402, 967–979. doi:10.1115/GT2011-46402
Ramakrishna, P. V., and Govardhan, M. (2009). Stall Characteristics and Tip Clearance Effects in Forward Swept Axial Compressor Rotors. J. Therm. Sci. 18, 40–47. doi:10.1007/s11630-009-0040-6
Straka, P., and Němec, M. (2016). Influence of the Radial gap under the Stator Blade on Flow Around the Hub-End of the Rotor Blade. Amm 821, 120–128. doi:10.4028/www.scientific.net/amm.821.120
Straka, P. (2014). Numerical Simulation of Flow in Hub-gap of Axial Stator Blades. EPJ Web of Conferences 67, 1–6. doi:10.1051/epjconf/20146702112
Suder, K. L., and Celestina, M. L. (1996). Experimental and Computational Investigation of the Tip Clearance Flow in a Transonic Axial Compressor Rotor. ASME Paper No. 99-GT-365.
Szwaba, R., Kaczynski, P., and Doerffer, P. (2014). Roughness Effect on Shock Wave Boundary Layer Interaction Area in Compressor Fan Blades Passage. Aerosp. Sci. Technol. 37, 130–137.
Taghavi-Zenouz, R., and Ababaf Behbahani, M. H. (2018). Improvement of Aerodynamic Performance of a Low Speed Axial Compressor Rotor Blade Row through Air Injection. Aerospace Sci. Tech. 72, 409–417. doi:10.1016/j.ast.2017.11.028
Wang, Z., Lu, B., Liu, J., and Hu, J. (2018). Numerical Simulation of Unsteady Tip Clearance Flow in a Transonic Compressor Rotor. Aerospace Sci. Tech. 72, 193–203. doi:10.1016/j.ast.2017.11.012
Waschka, W., Wittig, S., and Kim, S. (1990). Influence of High Rotational Speeds on the Heat Transfer and Discharge Coefficients in Labyrinth Seals. ASME Paper No. GT1990-330. doi:10.1115/90-gt-330
Wellborn, S. R. (2001). Details of Axial Compressor Shrouded Stator Cavity Flows. ASME Paper No. 2001-GT-0495.
Wellborn, S. R., and Okiishi, T. H. (1996). Effects of Shrouded Stator Cavity Flows on Multistage Axial Compressor Aerodynamic Performance. NASA-CR-198536.
Zhong, J., Han, S., Lu, H., and Kan, X. (2013). Effect of Tip Geometry and Tip Clearance on Aerodynamic Performance of a Linear Compressor cascade. Chin. J. Aeronautics 26, 583–593. doi:10.1016/j.cja.2013.04.020
Zhu, J. Q., and Sun, L.(2005). Experimental Investigation on the Layout of Tip Clearance for an Axial-Flow Compressor Rotor, Paper No. AIAA 2005-808, in 43rd AIAA Aerospace Sciences Meeting, Reno, Nevada, USA,January 2005, pp.1–9. doi:10.2514/6.2005-808
Glossary
ρ density (kg/m3)
t time (s)
p pressure (Pa)
p* total pressure (Pa)
T * total temperature (K)
I unit tensor
ht total enthalpy (J/kg)
h static enthalpy (J/kg)
Sh heat source (J/kg)
y+ non-dimensional distance
n corrected rotation speed at the design point (rpm)
np non-dimensional corrected rotation speed
η isentropic efficiency
π total pressure ratio,
Θ total temperature ratio,
γ specific heat ratio
G corrected mass flow rate (kg/s)
Gleak corrected mass flow rate of seal leakage (kg/s)
SM surge margin,
ΔG variation of corrected mass flow rate (kg/s), G–G0
Δη variation of isentropic efficiency, η–η0
Δπ variation of total pressure ratio, π–π0
ΔSM variation of surge margin, SM–SM0
ΔGequ variation of equivalent corrected mass flow rate (kg/s)
α2 flow angle at the stator outlet (the angle between the flow direction and the axial direction)
Subscript
in compressor inlet
out compressor outlet
ave average value of the compressor inlet and outlet
0 case of no seal leakage
DP test value of compressor performance parameter at design point
op compressor working point
st compressor stall point
Keywords: numerical model, seal leakage, multistage axial compressor, characteristic curves, different working conditions
Citation: Wang Q, Zhang Z, Hong Q and Ren L (2021) Impact Investigation of Stator Seal Leakage on Aerodynamic Performance of Multistage Compressor. Front. Energy Res. 9:760477. doi: 10.3389/fenrg.2021.760477
Received: 18 August 2021; Accepted: 22 September 2021;
Published: 28 October 2021.
Edited by:
Xiao Liu, Harbin Engineering University, ChinaReviewed by:
Bing Ge, Shanghai Jiaotong University, ChinaBin Jiang, Harbin Engineering University, China
Copyright © 2021 Wang, Zhang, Hong and Ren. This is an open-access article distributed under the terms of the Creative Commons Attribution License (CC BY). The use, distribution or reproduction in other forums is permitted, provided the original author(s) and the copyright owner(s) are credited and that the original publication in this journal is cited, in accordance with accepted academic practice. No use, distribution or reproduction is permitted which does not comply with these terms.
*Correspondence: Qi Wang, b3Zlcmx1Y2tlZEAxNjMuY29t