
95% of researchers rate our articles as excellent or good
Learn more about the work of our research integrity team to safeguard the quality of each article we publish.
Find out more
ORIGINAL RESEARCH article
Front. Energy Res. , 14 January 2022
Sec. Bioenergy and Biofuels
Volume 9 - 2021 | https://doi.org/10.3389/fenrg.2021.758149
This article is part of the Research Topic Electricity-bioenergy Hybrids: Solutions for Improving the Resource Efficiency of Biomass Conversion View all 12 articles
 Koteswara R. Putta
 Umesh Pandey
 Ljubisa Gavrilovic†Kumar R. RoutErling RytterEdd A. Blekkan
 Magne Hillestad*
By adding energy as hydrogen to the biomass-to-liquid (BtL) process, several published studies have shown that carbon efficiency can be increased substantially. Hydrogen can be produced from renewable electrical energy through the electrolysis of water or steam. Adding high-temperature thermal energy to the gasifier will also increase the overall carbon efficiency. Here, an economic criterion is applied to find the optimal distribution of adding electrical energy directly to the gasifier as opposed to the electrolysis unit. Three different technologies for electrolysis are applied: solid oxide steam electrolysis (SOEC), alkaline water electrolysis (AEL), and proton exchange membrane (PEM). It is shown that the addition of part of the renewable energy to the gasifier using electric heaters is always beneficial and that the electrolysis unit operating costs are a significant portion of the costs. With renewable electricity supplied at a cost of 50 USD/MWh and a capital cost of 1,500 USD/kW installed SOEC, the operating costs of electric heaters and SOEC account for more than 70% of the total costs. The energy efficiency of the electrolyzer is found to be more important than the capital cost. The optimal amount of energy added to the gasifier is about 37–39% of the energy in the biomass feed. A BtL process using renewable hydrogen imports at 2.5 USD/kg H2 or SOEC for hydrogen production at reduced electricity prices gives the best values for the economic objective.
According to the International Energy Agency (IEA) world energy outlook 2019, global energy-related CO2 emissions were about 33.1 Gt CO2 (IEA, 2019) and were 70% higher than those in 2010. CO2 emissions from the aviation industry were 0.92 Gt CO2, that is, 2.4% of global CO2 emissions as per the International Council on Clean Transportation (Graver et al., 2019). Aviation industry emissions correspond to 12% of CO2 emissions from all transport sources. Europe aims to reduce aviation emissions by 40% relative to 2005 by 2030. Norway emitted 2.8 million tons of CO2 from the aviation industry in 2017. To achieve the emission targets, the use of alternative fuels, in particular sustainable aviation fuels, is needed. Norway has mandated that 0.5% of aviation fuel should be advanced biofuels from January 2020 and has an ambitious target of reducing greenhouse gas emissions by half from the transport sector in Norway by 2030. In addition to this, the goal is that 30% of aviation fuels sold in Norway by 2030 will be biofuels (Ministry of Climate and Environment, 2019). Currently, both the EU and Norway rely on imported biofuels instead of domestic production. Due to the limited availability of biofuels, Norway is exploring the potential for large-scale biofuel production using Norwegian forestry biomass feedstocks.
Renewable energy technologies and carbon capture and storage are essential to control the global temperature rise below 1.5°C above pre-industrial levels (IPCC, 2018). Biomass is a unique renewable energy resource due to its ability to produce hydrocarbons and replace fossil fuels. Biomass utilization to replace fossil fuels to produce energy, heat, and fuels is essential to achieve the United Nations Sustainable Development Goals (SDG) through sustainable natural resource management, production, and consumption, and taking immediate action on climate change (United Nations, 2015). Biomass resources include all forms of organic materials. Biomass typically contains moisture, carbon, hydrogen, oxygen, and traces of sulfur, chlorine, nitrogen, and ash.
Currently, biomass conversion into useful forms of energy is performed using biochemical and thermochemical methods. Typical biomass-specific energy content on dry basis is around 19–20 MJ/kg (Neves et al., 2011). Among the biomass conversion technologies, gasification is one of the most promising technologies due to its ability to convert solid biomass into a gaseous fuel, known as syngas or producer gas, a mixture of hydrogen (H2) and carbon monoxide (CO). During gasification, the majority of the energy content in the fuel/feed biomass is converted into the syngas, the energy in the syngas is mostly chemical bound (around 80%), and cooling down of syngas for impurities removal only loses the thermal energy content (about 20%) (Quaak et al., 1999; Srinivasakannan and Balasubramanian, 2010). After removing the contaminants, syngas can replace fossil fuels used in both conventional and advanced energy conversion processes. The cleaned syngas can be used in a wide range of applications like power production by firing in gas turbines or engines; production of methanol, hydrogen, synthetic natural gas, and di-methyl-ether (DME); and to produce aviation fuel, jet fuel, naphtha, and LPG via Fischer–Tropsch (FT) synthesis.
Advanced biofuels can be produced from biomass using the biomass-to-liquid (BtL) fuel process. In the BtL process, biomass is converted to syngas by gasification and the syngas is converted via FT synthesis to liquid fuels. FT synthesis using a cobalt-based catalyst requires syngas with an H2/CO ratio of around 2.0, whereas the syngas from biomass gasification contains an H2/CO ratio of less than 1 without steam addition and between 1 and 1.5 with steam addition to the gasifier (Weiland et al., 2013). In a conventional BtL process, the water–gas shift (WGS) reaction is used by adding steam to get extra H2 required to obtain the H2/CO ratio for FT synthesis, as shown in Eq. 1.
Due to the conversion of CO to CO2 in the water–gas shift reaction, more carbon in the biomass is converted to CO2, resulting in a further reduced and very low carbon efficiency. From an energy balance viewpoint [lower heating value (LHV) basis], biomass feed has an energy content of 19 MJ/kg (dry), whereas jet fuel contains 43 MJ/kg and gasoline has 44 MJ/kg, which is substantially higher than the biomass feedstock.
The literature survey for the conventional BtL process and advanced BtL process with integration of renewable energy are summarized in Tables 1 and 2, respectively.
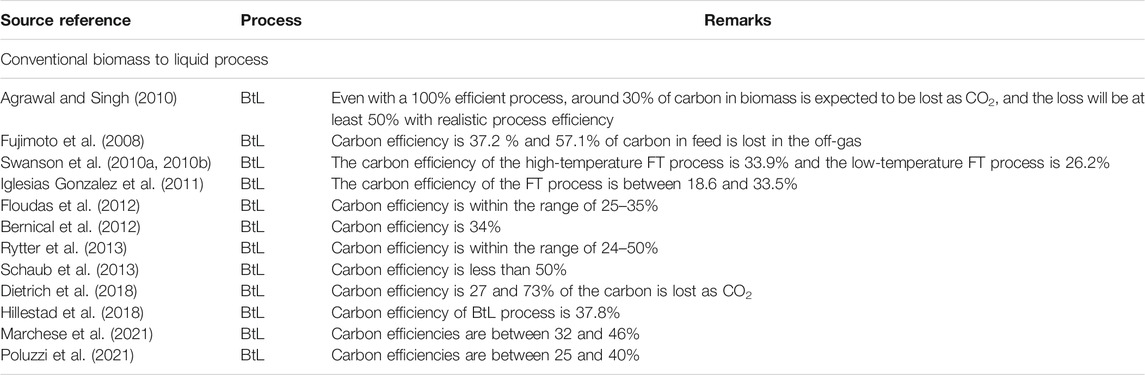
TABLE 1. Literature survey for BtL process without energy addition.
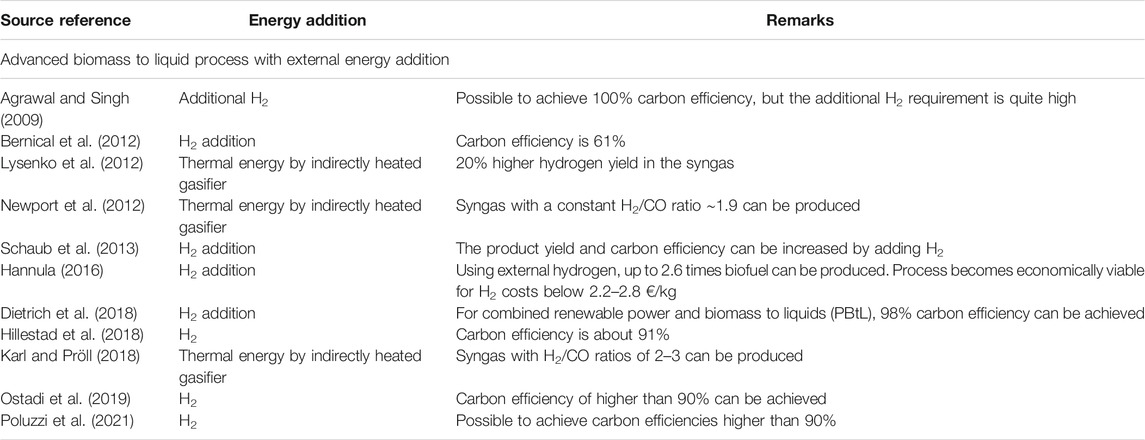
TABLE 2. Literature survey for the BtL process with external energy addition.
All the studies listed above in Table 2 studied the possibility of increasing the carbon efficiency of a conventional BtL process by adding extra energy in the form of hydrogen or indirect thermal energy.
As SOEC is not yet a fully commercial technology, the investment costs (CAPEX) are high and the addition of extra energy to the BtL process in the form of hydrogen generated using SOEC might therefore become expensive. On the positive side, SOEC requires less electrical work because some of the energy is provided as heat, and this provides better heat integration with high-temperature processes like entrained flow gasification. This relates to the issue of the economic feasibility of the integrated process, in addition to technical challenges in scale-up. Electricity is a high-quality energy source compared to thermal energy at low-to-medium temperatures. The Carnot efficiency increases with increasing temperatures. At entrained flow gasification temperatures, for example, 1,300–1,600°C, the Carnot efficiency is about 81–84%, and, as expected, the addition of thermal energy at high temperatures is also expensive.
It is clear from the studies performed in the literature (Agrawal and Singh, 2009; Bernical et al., 2012; Lysenko et al., 2012; Newport et al., 2012; Schaub et al., 2013; Hannula, 2016; Dietrich et al., 2018; Hillestad et al., 2018; Karl and Pröll, 2018; Ostadi et al., 2019; Poluzzi et al., 2021) that addition of energy to the BtL process, either in the form of hydrogen or directly to the gasifier, improves the carbon efficiency. Here, the process concept with energy addition to the BtL process is further improved by optimally distributing the amount of energy added through SOEC as hydrogen and directly to the gasifier as heat.
A detailed model of the process is implemented in Aspen Hysys. The energy added to the BtL process is varied to maintain the gasifier outlet temperature of 1,300°C and a H2/CO ratio of 2.05 in the syngas produced. To make the process more efficient, the off-gas from FT synthesis is recycled into the gasifier. This study explores the effect of distributing the added energy between the SOEC and the gasifier on the amount of syngas (H2 + CO) produced, the size of SOEC, and carbon conversion efficiency. In addition to the effect on key process variables, an economic analysis of the effect of adding a fraction of the energy directly to the gasifier and partly to SOEC to generate hydrogen to adjust the H2/CO ratio is also performed.
The proposed process is described in Figure 1 (block diagram) and Figure 2 (more detailed flowsheet). An entrained flow gasifier is considered for the gasification of biomass. Pretreated biomass suitable for the entrained flow gasifier is used as the feed. Gasification is generally an endothermic process, and heat is required in order to make the gasification happen. The required heat for gasification is normally provided by the combustion of a part of the biomass using oxygen, which is known as autothermal gasification. In the current study, heat is directly added to the gasifier using high-temperature electrical heaters. Entrained flow gasification of biomass normally occurs at temperatures greater than 1,300°C. Steam and/or oxygen are used as gasifying agents. Syngas produced in the entrained flow gasifier has a low H2/CO ratio, typically <1, while the Fischer–Tropsch (FT) synthesis requires a syngas with H2/CO ∼ 2.05. A possible way to increase the H2/CO ratio in the syngas from the gasifier is simply by adding hydrogen produced from renewable electric power. However, if hydrogen is added at high temperatures, some CO2 will be converted to CO via the reverse water–gas shift reaction (rWGS), thereby increasing the amount of syngas. The hydrogen flow rate is varied to get the required syngas composition for FT synthesis. Syngas at the outlet of the reverse water–gas shift reactor (rWGS) is hot and highly reactive in nature. In order to avoid material issues in the process, and avoid back-reactions, the hot and aggressive syngas needs to be cooled very rapidly. A waste-heat boiler reduces the syngas temperature to a chemically more stable condition (<500–600°C). The high-temperature heat released by cooling down the hot reactive syngas is utilized to produce super-heated high-pressure (HP) steam. Medium- to low-temperature syngas is further exploited to preheat the boiler feed water in several heat exchangers (economizers) by employing efficient heat integration. As the hot syngas gets cooled, water vapor present in the syngas is condensed and is separated in a vapor–liquid separator. H2 and CO are the useful reactants for Fischer–Tropsch synthesis using a cobalt catalyst, and all other components behave as inerts or contaminants. Contaminants are removed from the cooled syngas in order to avoid downstream Fischer–Tropsch catalyst contamination, and inert concentration needs to be reduced in order to have an effective design. The process block flow diagram for syngas production is shown in Figure 1.
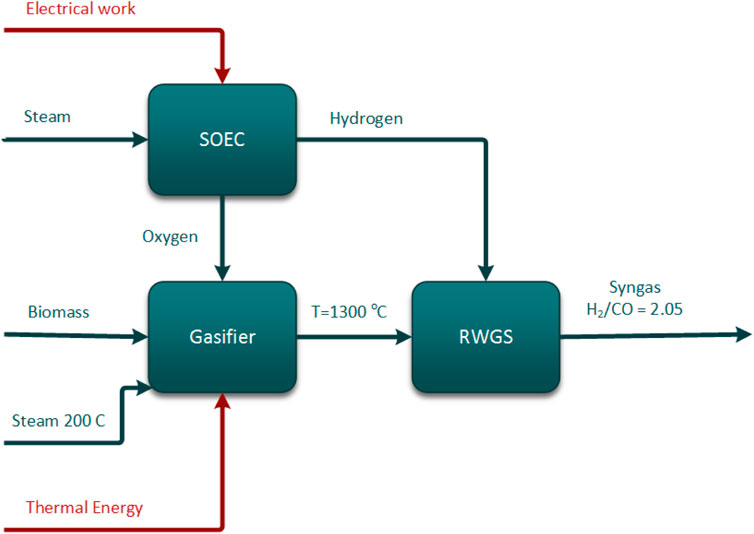
FIGURE 1. Process concept diagram for integration of renewable energy into syngas generation from biomass gasification.
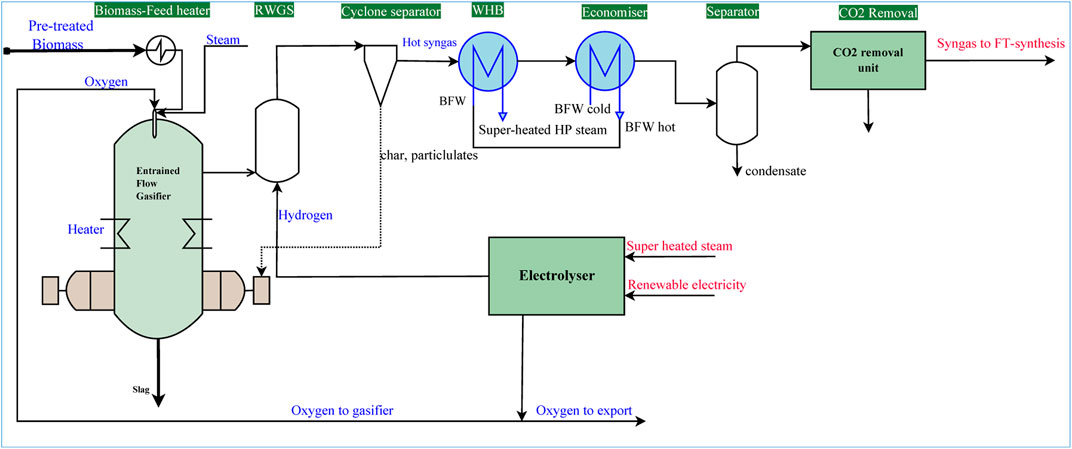
FIGURE 2. Process flow diagram for the investigated process.
A detailed flow diagram of the process is shown in Figure 2. Depending on the amount of energy added to the gasifier and the S/C carbon ratio, the CO2 content in syngas varies. In the downstream Fischer–Tropsch synthesis, with a cobalt catalyst, CO2 is inert and does not participate in the reactions. Hence, CO2 removal is essential to optimize the reactor size and thereby costs associated with the FT synthesis loop, and the CO2 removal unit is assumed to be able to remove 90% of CO2 present in the syngas stream after the process condensate separator.
Biomass, pretreated and size-milled to less than 1 mm particles, is the main feedstock used in the process. The composition is given in Table 3 below. In the present study, a biomass feed (LHV = 18.8 MJ/kg) flow rate of 25 tons/hr on a dry basis is used for all simulations. This corresponds to a total energy of 130.08 MW in the biomass feed.
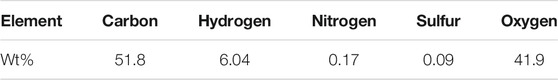
TABLE 3. Analysis of biomass on dry ash–free basis.
The process model, shown in Figure 3, has been developed using the chemical process simulation software Aspen Hysys V10. The model accounts for key physico-chemical processes occurring in the gasifier, that is, devolatilization, partial combustion of volatiles produced, and gasification of char. The Peng-Robinson equation of state has been used as a thermodynamic model for the physical and thermodynamic properties of the components (Kuo et al., 2014; Adnan et al., 2017a, 2017b; Gagliano et al., 2017; Adnan and Hossain, 2018; Mutlu and Zeng, 2020; Okolie et al., 2020).
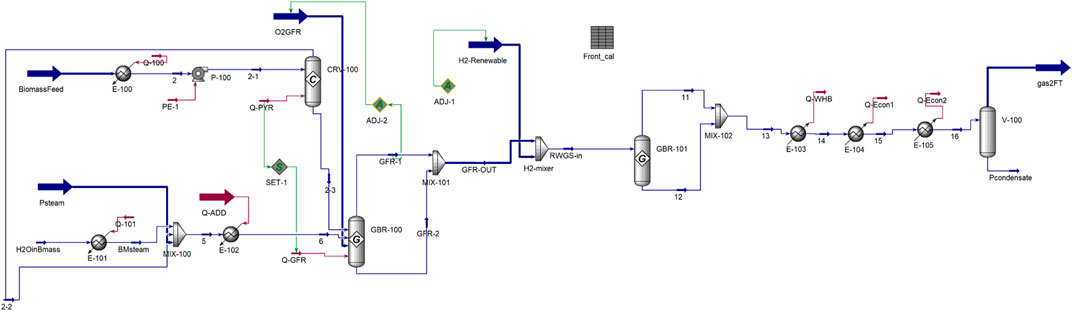
FIGURE 3. Aspen Hysys implementation of the process.
As Aspen Hysys V10 does not contain biomass in its database, biomass is added as a hypothetical component in the hydrocarbon class of compounds with the chemical formula C4.31H6.0O2.62N0.012S0.003 (dry ash–free basis), that is, the biomass consists of carbon, hydrogen, oxygen, nitrogen, and sulfur atoms. The Burnham method (Burnham, 2010) based on the elemental composition of biomass, given in Table 3, is used for the estimation of the heat of formation. The molar heat of formation of biomass is calculated to be −518.4 MJ/kmol, and the molar mass is taken as 100.11 kg/kmol, which is the same as the values mentioned in the study by Hillestad et al. (2018). The moisture content of the biomass feed after pretreatment and size reduction is assumed to be 4.77 wt% (wet basis).
Biomass entrained flow gasification is simulated as two reactors: the first reactor considered is a conversion reactor (CRV-100), where biomass is decomposed into smaller molecules; that is, biomass is decomposed into elements using the elemental composition from Table 3.
Biomass devolatilization reaction:
The stoichiometric coefficients for all components in reaction (2) are calculated using the elemental weight percent composition given in Table 3:
The gaseous products from the devolatilization reactor (CRV-100) along with process steam and moisture in the biomass are mixed in a mixer (MIX-100) and heated in a heat-exchanger (E-102) using external heat (Q-ADD). This heated stream is sent to the gasification reactor along with solids from the devolatilization reactor and oxygen. The Gibbs reactor block in Aspen Hysys is used for simulating gasification (GBR-100). As the entrained flow gasification occurs at high temperatures, the assumption of equilibrium for all reactions is reasonable, and the same Gibbs reactor was used in several studies in the literature to simulate the gasifier (Weiland, 2015; Jafri, 2016; Yakaboylu, 2016; Pala et al., 2017; Brachi et al., 2018; Furusjö and Jafri, 2018; Gambarotta et al., 2018; Hillestad et al., 2018; Naidoo, 2018; Ferreira et al., 2019; Khonde et al., 2019; Ostadi et al., 2019; Safarian et al., 2019; Tauqir et al., 2019). Devolatilization is endothermic, and the heat duty required will be supplied from the gasifier. This is done by using the SET-Duty function available in Aspen Hysys. The oxygen flow rate is varied using the adjust function to maintain the required gasifier outlet temperature of 1,300°C. The Gibbs reactor unit operation calculates the exiting compositions such that the phase and chemical equilibria of the outlet streams are attained by minimizing the Gibbs free energy of the reacting system, that is, the equilibrium condition. The gasifier outlet hot gas is mixed with hydrogen in a mixer (H2-mixer) and sent to the reverse water–gas shift reactor (GBR-101). As the hydrogen-mixed syngas temperature is high (above 1,000°C), equilibrium is assumed, and a Gibbs reactor is used to simulate the reverse water–gas shift reactor. Hydrogen from electrolysis is added to get the syngas composition suitable for Fischer–Tropsch (FT) synthesis and convert CO2 formed in the gasifier to CO. The hydrogen flow rate is adjusted using the adjust function so that the syngas to FT synthesis has a composition with H2/CO = 2.05. The outlet syngas is cooled with boiler feed water (BFW) to generate super-heated steam by using a series of heat-exchangers, economizers, and waste heat boilers (E103, E104, and E105). The cooled gas is then sent to a process condensate separator to separate water from the syngas stream.
Case studies are performed by varying the heat added to the gasifier in heat exchanger E-102 (Q-ADD) and the flow rate of process steam added to the gasifier. In all cases, the flow rate of oxygen is adjusted to maintain a gasifier outlet temperature of 1,300°C, and the hydrogen flow rate is tuned to get an H2/CO ratio of 2.05 in syngas at the outlet of the reverse water–gas shift (rWGS) reactor. Results from this work are compared with the base case presented by Hillestad et al. (2018), where all the energy is added to the SOEC. The base case is described below.
In the Hillestad et al. (2018) study, biomass to liquid fuels using FT synthesis was studied by integrating the BtL process with a solid oxide electrolysis cell to produce hydrogen required to improve the overall carbon efficiency. Biomass was converted to syngas using an entrained gasifier, and hydrogen from SOEC was used to obtain the correct H2/CO ratio. Syngas was converted to liquid fuels via Fischer–Tropsch synthesis using three reactors in series, with overall CO conversion of about 90%. They showed that adding extra energy (for hydrogen production) to the conventional BtL process improves the carbon efficiency significantly. Thus, all the energy was added to SOEC in their study. As SOEC CAPEX is very high, alternative ways of energy addition with lower CAPEX are explored here.
The following scenarios were studied:
(a) Energy addition to the gasifier using electric heaters
(b) Alternative less-expensive electrolysis units for hydrogen production (alkaline electrolysis (AEL) or polymer electrolyte membrane electrolysis (PEM))
(c) Cheaper renewable hydrogen imports
Some of the terminology that is used in the results and discussion is described in the following.
Total moles of carbon from biomass feed are defined as total moles of carbon in the feed, which is used in the steam to carbon ratio calculation. The S/C ratio is the molar ratio of steam to total carbon. OG is the gasifier outlet hot stream, and SG is the syngas stream at the outlet of the process-condensate separator.
Preliminary economic analysis of the cases is performed by using the relevant costs that vary with the amount of energy added to the gasifier. The effect of changing the amount of energy added to the gasifier and steam to carbon ratio (S/C) on the criterion (in million US dollars) is used as metric to evaluate the optimal design.
The economic criterion J is calculated using the following function:
where
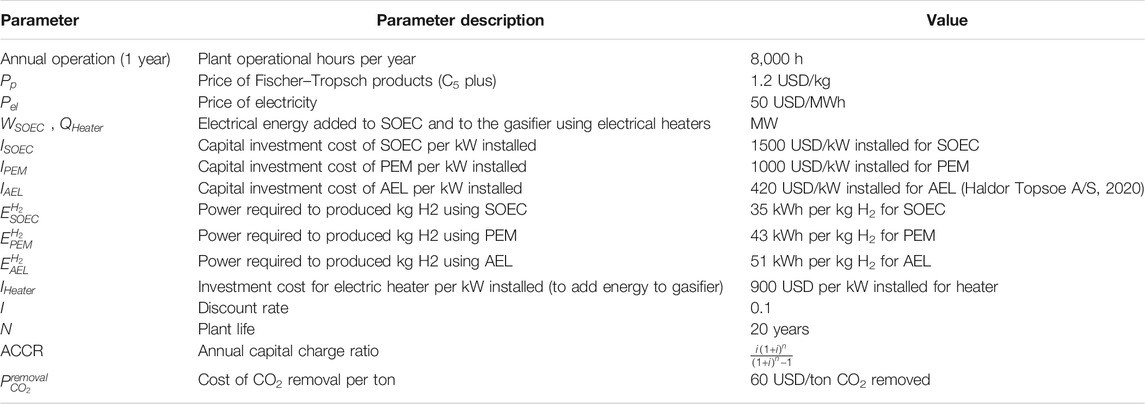
TABLE 4. Parameter values used in calculation of criterion.
The Results section is divided into different sub-categories to understand the effect of various combinations of process operating variables on multiple performance metrics.
First, to establish the base case similar to the Hillestad et al. (2018) study, the case with all the energy added to the solid oxide electrolysis cell (i.e., no extra energy addition to the gasifier) is performed. The effect of changing the steam to carbon (S/C) ratio on the amount of methane, the CO and CO2 component flow rates at the gasifier and syngas outlets, and the criterion (J) are studied and shown in Figure 4. It is clear that with an increase in the S/C ratio, the total energy added (i.e., to the SOEC) decreases from 100 to 45 MW as shown in Figure 4A, and the criterion (J) decreases from 40 to 26.9 MUSD as shown in Figure 4D. There is no methane in the gasifier outlet gas, but a small amount of methane forms in the reverse water gas shift reactor, as seen in Figure 4B. As the steam to carbon ratio increases, the methane content in syngas decreases exponentially. From Figure 4C, it is evident that as the S/C ratio increases, the amount of oxygen required increases, as does the amount of CO2 formed due to the combustion of biomass in order to maintain the gasifier temperature at 1,300°C. In addition to the combustion, CO2 is formed due to the water gas shift reaction, and this results in a decrease in the flow rate of CO in the gasifier outlet gas with an increase in the S/C ratio. The hydrogen from the SOEC using renewable power is added to the rWGS reactor to secure syngas with the required H2/CO ratio of 2.05. It can be seen from Figure 4C that the amount of CO increases and CO2 decreases in the syngas stream (SG) compared to the gasifier outlet gas stream (OG). The water gas shift (WGS) reaction also produces part of the required H2, which results in a decrease in the amount of renewable hydrogen needed. The energy added to SOEC, as shown in Figure 4A, decreases with S/C due to reduction in the overall syngas production. As the progressive amount of carbon in the biomass feed is converted by steam to CO2, the amount of syngas (CO + H2) for the FT synthesis decreases, thereby reducing the amount of FT products produced. Less products and higher CO2 removal cost with the S/C ratio lead to decrease in criterion (J), as shown in Figure 4D. It is concluded that a very low S/C ratio is favorable for the BtL process when all the renewable energy is added to the SOEC.

FIGURE 4. The effect of the steam to carbon ratio without any extra energy added to gasifer on (A) the energy added to the SOEC, (B) the amount of methane present in gasifier outlet (OG) and in the syngas (SG), (C) the amount of CO and CO2 present in OG and SG and the amount of oxygen required to maintain the gasifier temperature of 1300 degC, and (D) the criterion defined in Eq. 5.
In order to find the optimal energy added to the gasifier and SOEC, the amount of energy added to the gasifier using electric heaters is varied from 0 to 60 MW for the steam to carbon ratio between 0 and 2.1. From Figures 5A,B, it can be seen that at a fixed S/C ratio, as the amount of energy added to the gasifier increases, the total amount of energy added to the process (to SOEC and gasifier) increases and the energy added to SOEC decreases, respectively. In other words, as energy to the gasifier increases, more syngas is produced (Figure 5C), but simultaneously, less added hydrogen is needed. It is important to note that the minimum steam to carbon ratio increases slightly as the amount of energy added to the gasifier (EADD-G) increases to have a feasible process. At a constant amount of energy added to the gasifier, the total energy added to the process decreases with an increase in the S/C ratio. As the S/C ratio increases due to the WGS reaction, the hydrogen produced also increases, which results in a less amount of renewable hydrogen required (i.e., energy added to SOEC) to achieve syngas with an H2/CO ratio of 2.05. This is, however, not advantageous as reduced SOEC investment is counteracted by a strong reduction in syngas production (see Figure 5C and the overall economic criterion in Figure 5D).
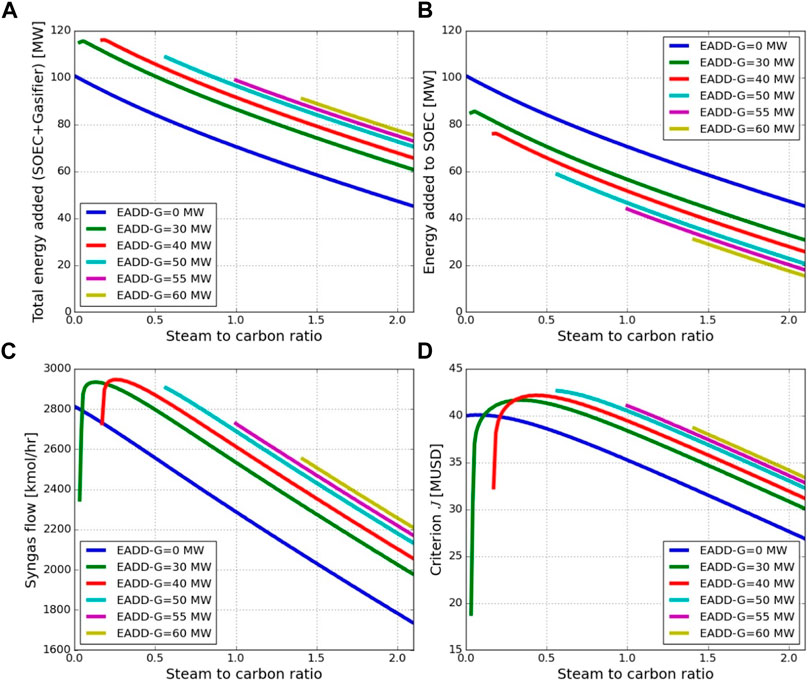
FIGURE 5. Effect of the steam to carbon ratio and energy added to gasifier on (A) the total energy added to the process (SOEC + gasifier), (B) energy added to SOEC, (C) amount of syngas (CO + H2) generated, and (D) the criterion defined in Eq. 5.
Figure 6 shows the maximum of criterion J vs the amount of energy added to the gasifier. It can be seen that for the case of hydrogen produced using SOEC with renewable power, the maximum value of criterion (J) is 50 MW of energy added to the gasifier using electrical heaters for the given amount of feedstock (more information is given in Supplementary Table S1 in the appendix). This corresponds to around 38.4% of the energy in the feed.
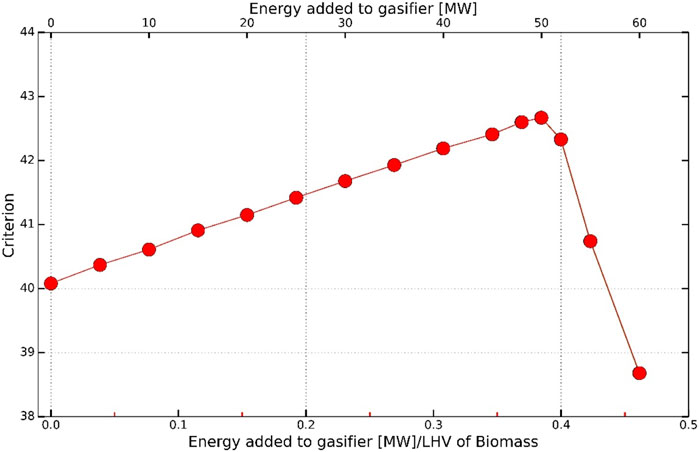
FIGURE 6. Effect of energy added to the gasifier on the criterion defined in Eq. 5 with SOEC as electrolysis unit.
There are different types of electrolysis units that produce hydrogen. Alkaline electrolyzers (AEL) and proton exchange membrane electrolyzers (PEM) are used commercially for hydrogen production. As mentioned, SOEC is still under development, and the CAPEX of SOEC is higher than that of AEL and PEM, and the characteristics are different, that is, SOEC has higher efficiency and operates at much higher temperatures. In order to evaluate the impacts of alternative electrolysis techniques with different CAPEX and efficiencies, the following scenarios are used.
(a) AEL with CAPEX of 420 USD/kW and 51 kWh/kg H2 energy requirement
(b) PEM with CAPEX of 1,000 USD/kW and 43 kWh/kg H2 energy requirement.
The CAPEX of AEL has been taken from the Ammonfuel whitepaper by Haldor Topsoe (Haldor Topsoe A/S, 2020), and the CAPEX for PEM is approximated from the Schmidt et al. (2017) study. The results for AEL and PEM are compared with the SOEC energy requirement of 35 kWh/kg H2 and CAPEX of 1500 USD/kW. Figure 7 shows the plots for energy added vs the criterion J calculated using Eq. 4 for different electrolyzer technologies. It is clear that in the case of AEL-based hydrogen production, the maximum for the criterion J is still found at around 51 MW added to the gasifier using electrical heaters, which is about 39.2% of the energy in the biomass feed. However, even though the CAPEX of AEL is only about 30% of the SOEC CAPEX, due to the lower energy efficiency of AEL (45% more power required per kg of H2 than SOEC), the selection of SOEC to produce hydrogen is more beneficial than alkaline electrolysis. The maximum value of the criterion for the AEL scenario is 10% lower than for the SOEC scenario. All the conditions at the optimum are given in Supplementary Table S2 in the appendix for the AEL scenario as well as for the PEM scenario described below. In order to have the same economic impact as SOEC, AEL needs to have an energy efficiency of 45 kWh/kg H2 with a capital investment cost of 420 USD/kW installed. From this, we can confidently say that the energy efficiency of the electrolyzer is more crucial than CAPEX under the conditions used in this study. On the other hand, SOEC is a more immature technology. In particular, more information is needed on the lifetime of the SOEC solid oxide elements.
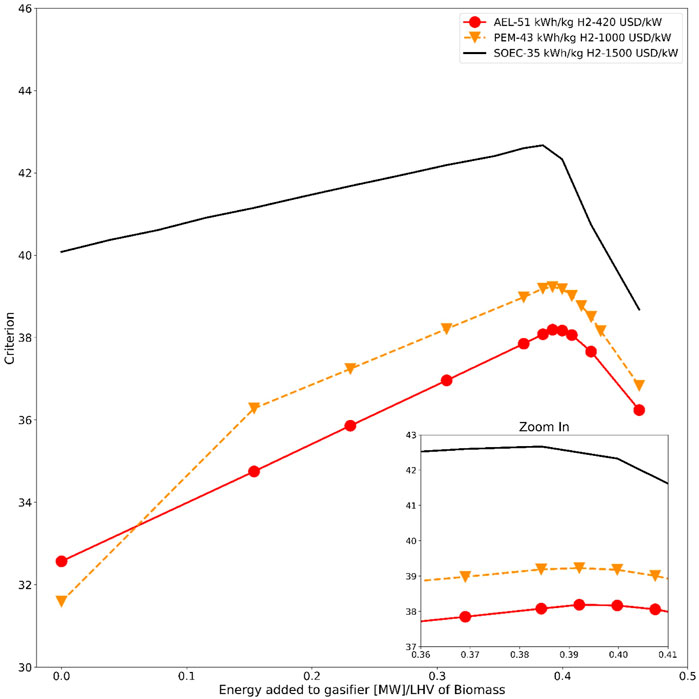
FIGURE 7. Amount of energy added to gasifier vs economic criterion J for different electrolyzer technologies.
Similarly, for PEM-based hydrogen production with a 43 kWh/kg H2 power requirement and a capital cost of 1,000 USD/kW installed, the optimum of criterion J also is at ca. 51 MW added to the gasifier (i.e., ∼39.2% of biomass feed energy) (see Supplementary Table S3 in Appendix). Although PEM is apparently slightly better than alkaline electrolysis, it is still significantly worse than SOEC. It should be noted that the use of pressurized electrolysis might alter the shown economic trends to some extent.
(c) Cheaper renewable hydrogen imports
As electrolysis units have high CAPEX and OPEX, an alternative future scenario where cheap renewable hydrogen is available and can be imported instead of producing on site is investigated. The same analysis has been performed as above, but with a renewable hydrogen import price of 2.5 USD/kg H2 (International Renewable Energy Agency, 2020). Figure 8 shows the maximum of economic criterion J at about the same maximum energy to the gasifier as in Figures 6, 7. The scenario of cheap renewable hydrogen import at 2.5 USD/kg is marginally better than that of SOEC, that is, J = 43.0 compared to J = 42.6.
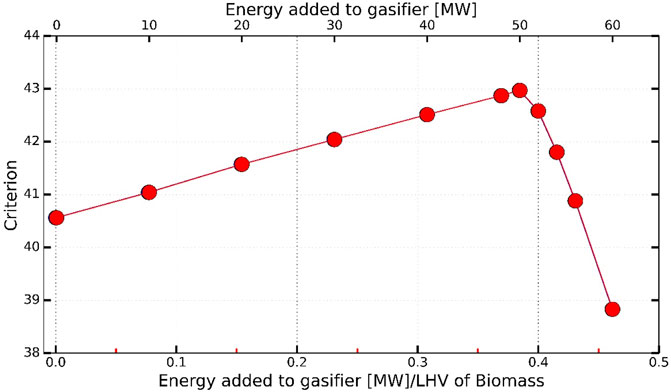
FIGURE 8. Cheap renewable hydrogen import scenario.
To analyze the effects of adding energy to the gasifier using electric heaters, thereby reducing the size of the electrolyzer, all the costs used in the estimation of economic criterion J are studied more thoroughly. The case of hydrogen production using SOEC with an electricity price of 50 USD per MWh is shown in Figure 9. The plot shows the costs at the maximum value of J for different levels of energy added to the gasifier. The reduction in both CAPEX and OPEX of SOEC is reduced by 39% for optimal conditions compared to no energy addition to the gasifier. It was found that the OPEX cost of SOEC is 2.27 times the CAPEX, and for electric heater, the OPEX is 3.78 times the CAPEX. At the overall optimal value of criterion J for 50 MW added to the gasifier, OPEX of SOEC and electric heaters account for about 72% of the total costs considered in this study, and CAPEX of SOEC and electric heater account for 26% of the total costs, whereas the cost for 90% CO2 removal is only 1.6% (see Figure 10).
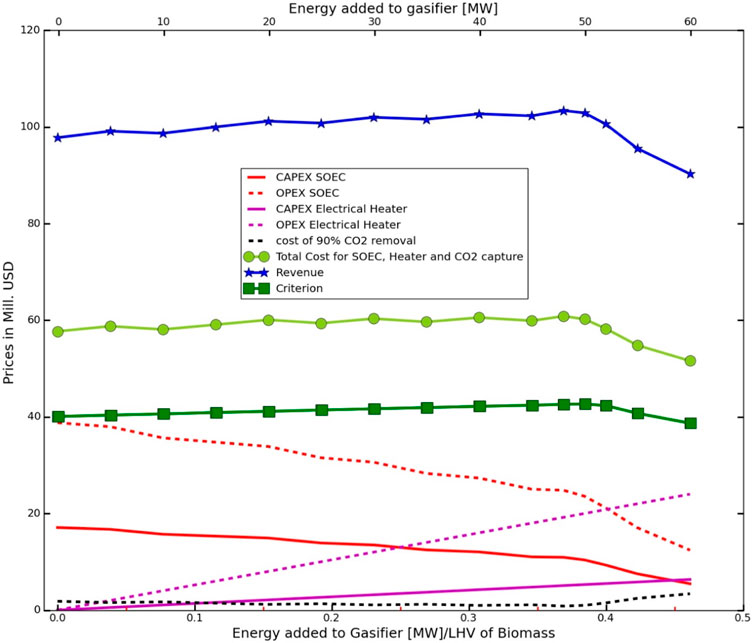
FIGURE 9. Analysis of cost breakdown for the SOEC scenario.
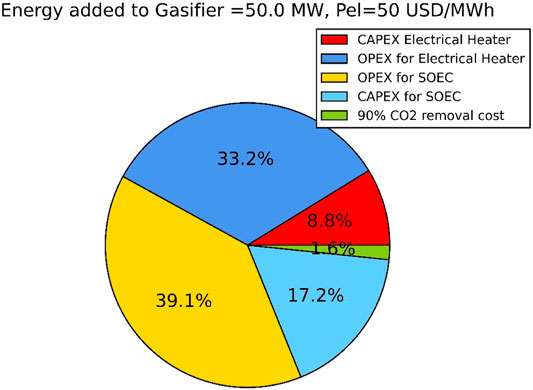
FIGURE 10. Distribution of costs for the SOEC scenario with Pel = 50 USD/MWh.
Reducing OPEX costs significantly improves criterion J and, according to the Haldor Topsoe Ammonfuel white paper (Haldor Topsoe A/S, 2020), the cost of renewable power can decrease significantly in coming years. A cheaper renewable electricity price of 30 USD/MWh was considered for projects in the 2025–2030 timeframe, and a price of 20 USD/MWh was predicted for projects in 2040–2050. For renewable hydrogen production using SOEC as an electrolysis unit scenario, the effects of these cheaper electricity prices were used, while the capital costs of SOEC and the electric heater were unchanged. Figures 11, 12 show the impact of cheaper electricity prices on the economy and the distribution of costs at optimal conditions. The optimal energy addition to the gasifier decreases from 50 to 48 MW when the electricity price is changed from 50 USD to 30 USD/MWh, but there is no further change upon reducing the price even more to 20 USD per MWh. The optimal value of criterion J increases by 41% and by 62%, respectively, for electricity price reduction from to 30 USD and 20 USD per MWh.
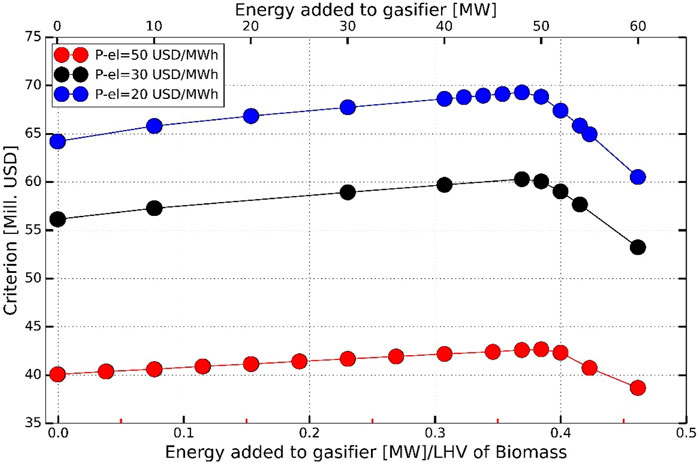
FIGURE 11. Effect of cheaper electricity prices on criterion and optimal energy addition to gasifier.
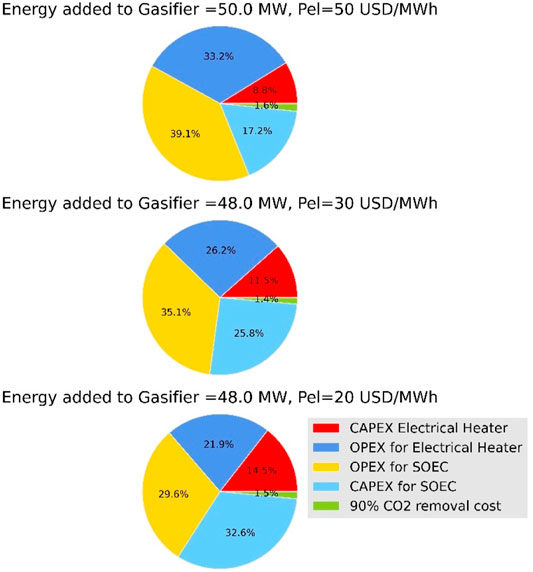
FIGURE 12. Distribution of costs for the SOEC scenario with cheaper electricity prices.
The total investment and operating costs were reduced by 27 and 41.7%, respectively, for the reduction in electricity prices. This is essentially due to the significant reduction in OPEX of the electric heater and SOEC.
The present study has demonstrated the advantages of distributing the energy added to the BtL process by partly adding energy to the gasifier using an electric heater instead of adding all energy to the electrolyzer. The important conclusions and trends found from the current study include the following:
➢ It is always beneficial to add part of the total energy added to the process to the gasifier, and, for the plant size considered in this study, the optimal energy added to the gasifier is around 50 MW, which is 38.4% of the energy in the biomass feed (i.e., ∼50 MW).
➢ With all the energy being added to the solid oxide electrolyzer (SOEC), operating the gasification with a low steam to carbon ratio is beneficial.
➢ The economic viability of the process (criterion J) increases up to about 50 MW of energy addition to the gasifier and then decreases (i.e., 0.384 times the biomass feed energy content).
➢ For the SOEC scenario, the operating costs of the electric heater and the SOEC account for 70% of the considered costs, with 50 USD/MWh of renewable electricity.
➢ Energy efficiency of the electrolyzer (OPEX) plays a major role compared to CAPEX.
➢ Cheaper renewable electricity improves the economic viability of the BtL process significantly.
➢ Changing the electrolyzer to AEL or PEM instead of SOEC indicates that the energy efficiency of the electrolyzer (OPEX) is more important than that of the CAPEX.
➢ Cheap renewable hydrogen import at 2.5 USD/kg H2 is the best option among all the scenarios studied in the present work when the renewable electricity price is 50 USD/MWh.
Overall, there is a clear benefit of adding energy to the gasifier, and cheaper renewable electricity prices and the energy efficiency of electrolyzers are crucial for improving the economic viability of the BtL process.
The original contributions presented in the study are included in the article/Supplementary Material; further inquiries can be directed to the corresponding author.
MH conceived the presented idea. KP did most of the simulations and calculations with assistance from UP and MH. EB, KR, ER, and MH supervised the work and gave important input with respect to the process concept. KP was responsible for writing the manuscript with major contributions from UP, LG, EB, KR, ER, and MH.
Financial support from the Research Council of Norway under Contracts no. 228741 and 280846 is gratefully acknowledged.
The authors declare that the research was conducted in the absence of any commercial or financial relationships that could be construed as a potential conflict of interest.
All claims expressed in this article are solely those of the authors and do not necessarily represent those of their affiliated organizations, or those of the publisher, the editors, and the reviewers. Any product that may be evaluated in this article, or claim that may be made by its manufacturer, is not guaranteed or endorsed by the publisher.
The Supplementary Material for this article can be found online at: https://www.frontiersin.org/articles/10.3389/fenrg.2021.758149/full#supplementary-material
Adnan, M. A., and Hossain, M. M. (2018). Gasification Performance of Various Microalgae Biomass - A Thermodynamic Study by Considering Tar Formation Using Aspen Plus. Energ. Convers. Management 165, 783–793. doi:10.1016/j.enconman.2018.03.078
Adnan, M. A., Susanto, H., Binous, H., Muraza, O., and Hossain, M. M. (2017a). Enhancement of Hydrogen Production in a Modified Moving Bed Downdraft Gasifier - A Thermodynamic Study by Including Tar. Int. J. Hydrogen Energ. 42, 10971–10985. doi:10.1016/j.ijhydene.2017.01.156
Adnan, M. A., Susanto, H., Binous, H., Muraza, O., and Hossain, M. M. (2017b). Feed Compositions and Gasification Potential of Several Biomasses Including a Microalgae: A Thermodynamic Modeling Approach. Int. J. Hydrogen Energ. 42, 17009–17019. doi:10.1016/j.ijhydene.2017.05.187
Agrawal, R., and Singh, N. R. (2010). Solar Energy to Biofuels. Annu. Rev. Chem. Biomol. Eng. 1, 343–364. doi:10.1146/annurev-chembioeng-073009-100955
Agrawal, R., and Singh, N. R. (2009). Synergistic Routes to Liquid Fuel for a Petroleum-Deprived Future. Aiche J. 55, 1898–1905. doi:10.1002/aic.11785
Bernical, Q., Joulia, X., Noirot-Le Borgne, I., Floquet, P., Baurens, P., and Boissonnet, G. (2012). “Integrated Design of High Temperature Steam Electrolysis and Biomass to Liquid Fuel Process,” in Computer Aided Chemical Engineering 11 International Symposium on Process Systems Engineering. Editors I. A. Karimi, and R. Srinivasan (Elsevier), 865–869. doi:10.1016/B978-0-444-59506-5.50004-3
Brachi, P., Chirone, R., Miccio, F., Miccio, M., and Ruoppolo, G. (2018). Entrained-flow Gasification of Torrefied Tomato Peels: Combining Torrefaction Experiments with Chemical Equilibrium Modeling for Gasification. Fuel 220, 744–753. doi:10.1016/j.fuel.2018.02.027
Burnham, A. (2010). Estimating the Heat of Formation of Foodstuffs and Biomass. Livermore, CA, United States: Lawrence Livermore National Lab. LLNL. doi:10.2172/1124948
Dietrich, R.-U., Albrecht, F. G., Maier, S., König, D. H., Estelmann, S., Adelung, S., et al. (2018). Cost Calculations for Three Different Approaches of Biofuel Production Using Biomass, Electricity and CO 2. Biomass and Bioenergy 111, 165–173. doi:10.1016/j.biombioe.2017.07.006
Ferreira, S., Monteiro, E., Brito, P., and Vilarinho, C. (2019). A Holistic Review on Biomass Gasification Modified Equilibrium Models. Energies 12, 160. doi:10.3390/en12010160
Floudas, C. A., Elia, J. A., and Baliban, R. C. (2012). Hybrid and Single Feedstock Energy Processes for Liquid Transportation Fuels: A Critical Review. Comput. Chem. Eng. 41, 24–51. doi:10.1016/j.compchemeng.2012.02.008
Fujimoto, S., Yanagida, T., Ogata, M., and Minowa, T. (2008). Evaluation of CO2 Mitigation by BTL Biofuels from Woody Biomass through Simulated Case Studies. Int. Energ. J. 9. Available at: http://rericjournal.ait.ac.th/index.php/reric/article/view/432 (Accessed October 5, 2021).
Furusjö, E., and Jafri, Y. (2018). Thermodynamic Equilibrium Analysis of Entrained Flow Gasification of Spent Pulping Liquors. Biomass Conv. Bioref. 8, 19–31. doi:10.1007/s13399-016-0225-7
Gagliano, A., Nocera, F., Bruno, M., and Cardillo, G. (2017). Development of an Equilibrium-Based Model of Gasification of Biomass by Aspen Plus. Energ. Proced. 111, 1010–1019. doi:10.1016/j.egypro.2017.03.264
Gambarotta, A., Morini, M., and Zubani, A. (2018). A Non-stoichiometric Equilibrium Model for the Simulation of the Biomass Gasification Process. Appl. Energ. 227, 119–127. doi:10.1016/j.apenergy.2017.07.135
Graver, B., Zhang, K., and Rutherford, D. (2019). CO2 Emissions from Commercial Aviation, 2018. International Council on Clean Transportation Working Paper, 13.
Hannula, I. (2016). Hydrogen Enhancement Potential of Synthetic Biofuels Manufacture in the European Context: A Techno-Economic Assessment. Energy 104, 199–212. doi:10.1016/j.energy.2016.03.119
Hillestad, M., Ostadi, M., Alamo Serrano, G. d., Rytter, E., Austbø, B., Pharoah, J. G., et al. (2018). Improving Carbon Efficiency and Profitability of the Biomass to Liquid Process with Hydrogen from Renewable Power. Fuel 234, 1431–1451. doi:10.1016/j.fuel.2018.08.004
Iglesias Gonzalez, M., Kraushaar-Czarnetzki, B., and Schaub, G. (2011). Process Comparison of Biomass-To-Liquid (BtL) Routes Fischer-Tropsch Synthesis and Methanol to Gasoline. Biomass Conv. Bioref. 1, 229–243. doi:10.1007/s13399-011-0022-2
International Renewable Energy Agency (2020). Green Hydrogen Cost Reduction: Scaling up Electrolysers to Meet the 1.5C Climate Goal. Abu Dhabi: International Renewable Energy Agency.
IPCC (2018). Global Warming of 1.5°C. IPCC. Available at: https://www.ipcc.ch/sr15/chapter/chapter-1/(Accessed February 3, 2020).
Jafri, Y. (2016). Gasification of Black Liquor and Pyrolysis Oil : Experimental and Equilibrium Modelling Studies of Catalytic Co-gasification. (PhD Licentiate thesis). Luleå, Sweden: Luleå University of Technology. Available at: http://urn.kb.se/resolve?urn=urn:nbn:se:ltu:diva-60342 (Accessed October 29, 2018).Entrained-Flow
Karl, J., and Pröll, T. (2018). Steam Gasification of Biomass in Dual Fluidized Bed Gasifiers: A Review. Renew. Sustainable Energ. Rev. 98, 64–78. doi:10.1016/j.rser.2018.09.010
Khonde, R., Hedaoo, S., and Deshmukh, S. (2019). Prediction of Product Gas Composition from Biomass Gasification by the Method of Gibbs Free Energy Minimization. Energy Sourc. A: Recovery, Utilization, Environ. Effects 43, 371–380. doi:10.1080/15567036.2019.1624890
Kuo, P.-C., Wu, W., and Chen, W.-H. (2014). Gasification Performances of Raw and Torrefied Biomass in a Downdraft Fixed Bed Gasifier Using Thermodynamic Analysis. Fuel 117, 1231–1241. doi:10.1016/j.fuel.2013.07.125
Lysenko, S., Sadaka, S., and Brown, R. C. (2012). Comparison of Mass and Energy Balances for Air Blown and Thermally Ballasted Fluidized Bed Gasifiers. Biomass and Bioenergy 45, 95–108. doi:10.1016/j.biombioe.2012.05.018
Marchese, M., Chesta, S., Santarelli, M., and Lanzini, A. (2021). Techno-economic Feasibility of a Biomass-To-X Plant: Fischer-Tropsch Wax Synthesis from Digestate Gasification. Energy 228, 120581. doi:10.1016/j.energy.2021.120581
Ministry of Climate and Environment (2019). More Advanced Biofuel in Aviation. Available at: https://www.regjeringen.no/en/aktuelt/mer-avansert-biodrivstoff-i-luftfarten/id2643700/(Accessed January 30, 2020).
Mutlu, Ö. Ç., and Zeng, T. (2020). Challenges and Opportunities of Modeling Biomass Gasification in Aspen Plus: A Review. Chem. Eng. Technol. 43, 1674–1689. doi:10.1002/ceat.202000068
Naidoo, S. (2018). Feasibility Study for maize as a Feedstock for Liquid Fuels Production Based on a Simulation Developed in Aspen Plus®. (Masters Thesis). Johannesburg, South Africa: University of the Witwatersrand. Available at: http://wiredspace.wits.ac.za/handle/10539/25034 (Accessed October 30, 2019).
Neves, D., Thunman, H., Matos, A., Tarelho, L., and Gómez-Barea, A. (2011). Characterization and Prediction of Biomass Pyrolysis Products. Prog. Energ. Combustion Sci. 37, 611–630. doi:10.1016/j.pecs.2011.01.001
Newport, D., Chandran, R., Arcuri, K., Whitney, S., Leo, D., and Freitas, S. (2012). ICE-thermochemical Conversion of Biomass to Biofuels-Process Demonstration Unit Test Results. Environ. Prog. Sustainable Energ. 31, 55–58. doi:10.1002/ep.10635
Okolie, J. A., Nanda, S., Dalai, A. K., and Kozinski, J. A. (2020). Hydrothermal Gasification of Soybean Straw and Flax Straw for Hydrogen-Rich Syngas Production: Experimental and Thermodynamic Modeling. Energ. Convers. Management 208, 112545. doi:10.1016/j.enconman.2020.112545
Ostadi, M., Rytter, E., and Hillestad, M. (2019). Boosting Carbon Efficiency of the Biomass to Liquid Process with Hydrogen from Power: The Effect of H2/CO Ratio to the Fischer-Tropsch Reactors on the Production and Power Consumption. Biomass and Bioenergy 127, 105282. doi:10.1016/j.biombioe.2019.105282
Pala, L. P. R., Wang, Q., Kolb, G., and Hessel, V. (2017). Steam Gasification of Biomass with Subsequent Syngas Adjustment Using Shift Reaction for Syngas Production: An Aspen Plus Model. Renew. Energ. 101, 484–492. doi:10.1016/j.renene.2016.08.069
Poluzzi, A., Guandalini, G., d’Amore, F., and Romano, M. C. (2021). The Potential of Power and Biomass-To-X Systems in the Decarbonization Challenge: a Critical Review. Curr. Sustainable Renew. Energ. Rep 8, 242–252. doi:10.1007/s40518-021-00191-7
Quaak, P., Knoef, H., and Stassen, H. (1999). “Energy from Biomass,” in A Review of Combustion and Gasification Technologies (Washington, DC: The World Bank). doi:10.1596/0-8213-4335-1
Rytter, E., Ochoa-Fernández, E., and Fahmi, A. (2013). “Biomass-to-Liquids by the Fischer-Tropsch Process,”in Catalytic Process Development for Renewable Materials. John Wiley & Sons, 265–308. doi:10.1002/9783527656639.ch10
Safarian, S., Unnþórsson, R., and Richter, C. (2019). A Review of Biomass Gasification Modelling. Renew. Sustainable Energ. Rev. 110, 378–391. doi:10.1016/j.rser.2019.05.003
Schaub, G., Eilers, H., and González, M. I. (2013). “Chemical Storage of Renewable Electricity via Hydrogen - Principles and Hydrocarbon Fuels as an Example,” in Transition to Renewable Energy Systems. John Wiley & Sons, 619–628. doi:10.1002/9783527673872.ch30
Schmidt, O., Gambhir, A., Staffell, I., Hawkes, A., Nelson, J., and Few, S. (2017). Future Cost and Performance of Water Electrolysis: An Expert Elicitation Study. Int. J. Hydrogen Energ. 42, 30470–30492. doi:10.1016/j.ijhydene.2017.10.045
Srinivasakannan, C., and Balasubramanian, N. (2010). The Significance of Indirectly Heated Gasifiers for the Generation of Medium Calorific Value Syngas through Biomass Gasification. Energ. Sourc. Part A: Recovery, Utilization, Environ. Effects 32, 1579–1586. doi:10.1080/15567030903076768
Swanson, R. M., Platon, A., Satrio, J. A., Brown, R. C., and Hsu, D. D. (2010b). Techno-Economic Analysis of Biofuels Production Based on Gasification. Colorado: Golden. doi:10.2172/994017
Swanson, R. M., Platon, A., Satrio, J. A., and Brown, R. C. (2010a). Techno-economic Analysis of Biomass-To-Liquids Production Based on Gasification. Fuel 89, S11–S19. doi:10.1016/j.fuel.2010.07.027
Tauqir, W., Zubair, M., and Nazir, H. (2019). Parametric Analysis of a Steady State Equilibrium-Based Biomass Gasification Model for Syngas and Biochar Production and Heat Generation. Energ. Convers. Management 199, 111954. doi:10.1016/j.enconman.2019.111954
United Nations (2015). Transforming Our World: the 2030 Agenda for Sustainable Development. Available at: https://sustainabledevelopment.un.org/post2015/transformingourworld/publication.
Weiland, F., Hedman, H., Marklund, M., Wiinikka, H., Öhrman, O., and Gebart, R. (2013). Pressurized Oxygen Blown Entrained-Flow Gasification of Wood Powder. Energy Fuels 27, 932–941. doi:10.1021/ef301803s
Weiland, F. (2015). Pressurized Entrained Flow Gasification of Pulverized Biomass Experimental Characterization of Process Performance.. Luleå, Sweden: Luleå University of Technology. (Doctoral thesis).
Yakaboylu, O. (2016). Supercritical Water Gasification of Wet Biomass: Modeling and Experiments. Available at: https://repository.tudelft.nl/islandora/object/uuid%3A99a7d296-3e4e-4c9c-a01b-41d2ba2863a9 (Accessed November 14, 2019).
Keywords: biomass to liquid process, renewable energy integration, solid oxide electrolysis cell, optimal energy distribution, fischer-tropsch
Citation: Putta KR, Pandey U, Gavrilovic L, Rout KR, Rytter E, Blekkan EA and Hillestad M (2022) Optimal Renewable Energy Distribution Between Gasifier and Electrolyzer for Syngas Generation in a Power and Biomass-to-Liquid Fuel Process. Front. Energy Res. 9:758149. doi: 10.3389/fenrg.2021.758149
Received: 13 August 2021; Accepted: 20 December 2021;
Published: 14 January 2022.
Edited by:
John Bøgild Hansen, Haldor Topsoe, DenmarkReviewed by:
Denny K. S. NG, Heriot-Watt University Malaysia, MalaysiaCopyright © 2022 Putta, Pandey, Gavrilovic, Rout, Rytter, Blekkan and Hillestad. This is an open-access article distributed under the terms of the Creative Commons Attribution License (CC BY). The use, distribution or reproduction in other forums is permitted, provided the original author(s) and the copyright owner(s) are credited and that the original publication in this journal is cited, in accordance with accepted academic practice. No use, distribution or reproduction is permitted which does not comply with these terms.
*Correspondence: Magne Hillestad, bWFnbmUuaGlsbGVzdGFkQG50bnUubm8=
†Present address: Ljubisa Gavrilovic, Institute for Energy Technology, Kjeller, Norway
Disclaimer: All claims expressed in this article are solely those of the authors and do not necessarily represent those of their affiliated organizations, or those of the publisher, the editors and the reviewers. Any product that may be evaluated in this article or claim that may be made by its manufacturer is not guaranteed or endorsed by the publisher.
Research integrity at Frontiers
Learn more about the work of our research integrity team to safeguard the quality of each article we publish.