- State Key Laboratory of Clean Energy Utilization, Zhejiang University, Hangzhou, China
In this study, the co-combustion characteristics of coal and biomass blends (20, 40, 60, 80, and 100 wt%) were investigated by thermogravimetric analysis. All the samples were operated under an oxidative atmosphere, with a heating rate of 20 C/min. The reaction stages, ignition and burnout temperature, maximum weight loss rate, and different combustion indices were determined. When the percentage of biomass in the blends was increased, the maximum mass loss rate was enhanced in the second region, and the ignition and burnout temperature was lowered, indicating the higher reactivity and better combustion performance of the samples. The comprehensive performance index presented an N shape with the increasing biomass blending ratio. Based on various combustion indices, 20% was an optimum percentage for the co-utilization of coal-biomass blends. A significant promoting interaction was observed between corn straw and rice straw blends, while inhibiting effects occurred between rice husk and coal. The kinetic parameters of the blends were evaluated by the Coats and Redfern method using the nth-order reaction model. The value of activation energy and the pre-exponential factor increased with the decreasing biomass percentage in the blends.
Introduction
In recent years, the rapid economic development has caused increasing energy consumption, but the limited amount of nonrenewable energy resources and the depletion in the future pose a profound challenge to energy demand. In addition, the combustion of fossil fuels aggravates environmental pollution because of the emissions of nitrogen and sulfur pollutants as well as CO2. Thus, the utilization of renewable energy has attracted considerable critical attention. Among these renewable energies, biomass may play an essential role due to its advantages of fuel flexibility, high combustion efficiency, low pollutant emission, and carbon neutrality (Jayaraman et al., 2017).
Numerous technologies have been extensively investigated for potential utilization of biomass, including combustion, pyrolysis, gasification, and liquefaction (Gil et al., 2010). Co-combustion is considered the state-of-the-art technology to utilize biomass for replacing fossil fuels, such as coal, to meet the stationary energy demand. Several reasons account for mixing biomass with coal before burning. The co-combustion of coal and biomass blends would directly help to cut down the consumption of fossil fuels. At the same time, a biofuel product is added to coal to obtain better burning performance during the combustion reaction (Wang et al., 2009). During the co-combustion process, a higher volatile matter content (normally more than 35%) is considered to provide a stable flame (Sahu et al., 2014), attained by the addition of biomass. The slagging and fouling problems of heating surfaces commonly faced in biomass combustion could be mitigated or eliminated through co-combusting of coal and biomass (Haykiri-Acma and Yaman, 2008). Additionally, there is no need for existing power plants to undergo many modifications for continuous use. In conclusion, the co-utilization of biomass and coal blends in present coal-fired power plants possibly leads to a mass of benefits in the environment, technology, and economy (Kastanaki and Vamvuka, 2006).
Knowledge of combustion characteristics and kinetic mechanisms is crucial for comprehension and modeling in industrial-scale furnaces, co-firing of biomass and coal, and burning of coal alone (Hu et al., 2019). Thermogravimetric (TG) analysis is commonly used to obtain a rapid investigation and comparison in thermal characteristics and kinetic parameters during the combustion of various fuels, including coal and biomass. Many researchers (Gil et al., 2010; Yanfen and Xiaoqian, 2010; Su et al., 2013; Lin et al., 2015; Lu and Chen, 2015; Jayaraman et al., 2017; Chen et al., 2018; Hu et al., 2019; Wang et al., 2019; Wang et al., 2020) have studied the co-combustion behaviors of different biomass and coal/biomass blends. A significant decrease in ignition and burnout temperature was observed by Wang et al. (2019) and Konwar et al. (2019). According to Chen et al. (2018) and Liu et al. (2015), the combustion indices, such as maximum mass loss, ignition performance, and the comprehensive combustion index, were evaluated. Guo et al. (2020) and Shi et al. (2019) found the interaction between coal and biomass, including promoting synergy and inhibiting effects. The combustion kinetic parameters, including activation energy and the pre-exponential factor, using the Coats and Redfern method (Gil et al., 2010; Wang et al., 2012; Lin et al., 2015; Jayaraman et al., 2017; Chen et al., 2018) and the Flynn–Wall–Ozawa method (Xie and Ma, 2013; Liu et al., 2015; Konwar et al., 2019; Wang et al., 2019; Guo et al., 2020) were determined.
Crop straws and rice husk are the most fundamental agricultural residues in quantitative terms (Sathitruangsak and Madhiyanon, 2017). As the world’s largest grain manufacturer, China owns plentiful biomass resources, and the amount of collectable straw was approximately 674 million tons in 2017 (Huo et al., 2020). Also, China is the leading country to cultivate rice, producing the most rice paddy (Hossain et al., 2018). Compared with other biomass, straw and rice husk char contain more high alkali and alkaline earth metals, which could catalyze the co-combustion process with coal and enhance combustion performance. Therefore, it was necessary to study the combustion and co-combustion characteristics and kinetic mechanisms to provide a theoretical basis and an optimal blending ratio of coal and biomass fuel.
In this research, co-combustion characteristics and kinetic parameters of mixed coal and three biomass samples (corn straw, rice straw, and rice husk) and their blends are examined under an oxidative atmosphere with TG equipment. The main objective of this study is to analyze the thermal behaviors and kinetic mechanisms of coal and biomass blends. This study also provides data on blending fuels in their combustion applicability. Finally, these results can thoroughly control the coal/biomass characteristics according to the demand.
Materials and Methods
Materials
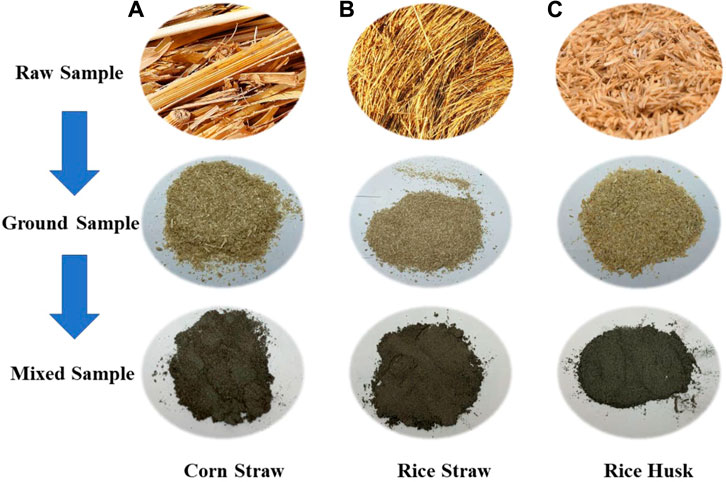
The corn straw (CS), rice straw (RS), and rice husk (RH) used in this study were collected from Jilin Province, China. Coal was obtained from Inner Mongolia, which is a mixture of brown and bituminous coal. The samples were milled into powder with a particle size of 75–150 μm. Then, different blend ratios were prepared with biomass of 20, 40, 60, and 80 wt% and named, for example, 20% CS, 40% RS, and 60% RH, depending on the proportion of the biomass in the blends. The prepared mixtures of coal and biomass were mixed manually into a homogeneous distribution. The photographs of raw, ground, and mixed samples are shown in Figure 1, and the ultimate and proximate analyses of biomass and coal samples are presented in Table 1.
Experimental Setup and Methods
Non-isothermal experiments were carried out employing a NETZSCH analyzer (model STA 449 F3) to investigate co-combustion behaviors and kinetic parameters of the samples. The sample mass for each test was approximately 5 mg. The experiment temperature was set from ambient temperature (20 C) to 1,000 C with a 20 C/min heating rate and a flow rate of 60 ml/min under air conditions. All experiments were reduplicated to ensure the reproducibility and consistency of the results. The weight loss and derivative thermogravimetry (DTG) of the samples were analyzed as a function of the temperature.
Combustion Parameters
The characteristic parameters of the combustion process were obtained from TG and DTG profiles. The ignition temperature (
where
Kinetic Analysis
The reaction of coal, biomass, and their blends is generally considered as a heterogeneous solid-phase reaction (Gil et al., 2010; Sahu et al., 2014), which follows the Arrhenius law, and can be described as
where
From the Arrhenius equation, the reaction rate constant can be expressed as
where A, R, and E are the pre-exponential factor, universal gas constant, and activation energy, respectively.
For nonisothermal reactions, the heating rate remains constant (
In this study, the Coats and Redfern (CR) method (Coats and Redfern, 1964) is used to determine the activation energy and reaction mechanism, which is widely used to estimate kinetic parameters for biomass combustion. The hypothetical model of the reaction is based on the nth reaction model (Wang et al., 2016; Chen et al., 2018); therefore,
For the basis of
By plotting
Results and Discussion
Fuel Properties of a Single Sample
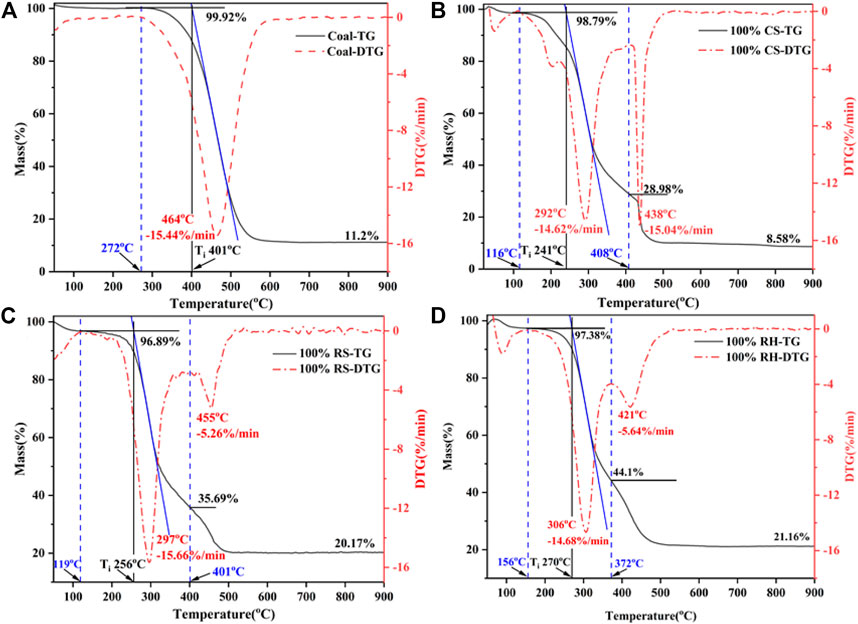
The thermochemical behaviors demonstrated by TG analysis could offer vital insights into the combustibility and transforming patterns of fuels (Luo et al., 2014). As shown in Figure 2, the ignition temperature for coal, CS, RS, and RH was 401°C, 241°C, 256°C, and 270°C, respectively, and the burnout temperature for the four samples was 557°C, 486°C, 481°C, and 479°C, respectively. These results indicated that the biomass fuels had a much lower ignition temperature and were easier to achieve burnout due to the higher volatile content in biomass, resulting in better thermal reactivity. Besides, the higher carbon content and the lower oxygen content in coal also contributed to the higher decomposition temperature as the chemical bond energy for breaking the C–C bond was higher than that for the C–O and C–H bonds (Konwar et al., 2019). Therefore, the destruction of the macromolecular structure and chemical bonds delayed the burnout of coal, and the reaction occurred at a higher temperature. The proximate analysis of coal and biomass in Table 1 also confirmed all these results shown above.
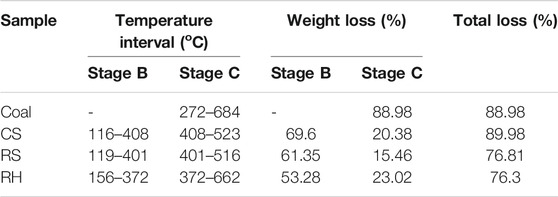
The temperature ranges of the main stages, together with the weight loss, are shown in Table 2. It could be inferred that the combustion process of three biomass samples was partitioned into three stages (Jayaraman et al., 2017; Wang et al., 2019): the dehydration process (stage A), the release and combustion of the volatiles (stage B), and the burning and burnout of residues and fixed carbon (stage C). The demarcation of each stage was clarified by the inflection point in the DTG curves (Lin et al., 2015). In the case of the coal sample, there was only one stage during its combustion process after the moisture evaporation, which was the primary carbonizing stage accompanying the released carbon dioxide and hydrogen (Jayaraman et al., 2017). A single weight-loss peak with a wider temperature range was observed, corresponding to a longer overlapping reaction process with the combustion of the volatiles and char oxidation (Vamvuka and Sfakiotakis, 2011).
In all samples, the initial stage was observed from indoor temperature to 120°C. In this stage, the mass loss depended on the moisture content of the fuel properties, and a small DTG peak occurred in the DTG curve. The second stage for CS, RS, and RH was extended from 116 to 408°C, from 119 to 401°C, and from 156 to 372°C, and the mass loss was 69.6, 61.35, and 53.28%, respectively. It was seen that the weight loss during this stage was almost close to the volatile content in Table 1, accounting for the majority of the total weight mass loss. This result confirmed that the predominant form of combustion in the second stage is via volatile releasing and burning, and a higher DTG peak was observed at around 300 C for three samples. It was attributed to the decomposition and combustion of celluloses (hemicellulose and cellulose), and a small account of lignin also combusted in this stage. The hemicellulose consists of a low degree of the amorphous structure, resulting in bad thermal stability, and the decomposition temperature extended from 220 to 315°C. However, the macromolecular structure of the cellulose is composed of glucose without branching, leading to a higher decomposition temperature (315–390 C). However, the thermal behavior of lignin occupied the whole decomposition process with a wider temperature range. This highly cross-linked polymer contained various chemical bonds, such as C–C bonds and ether bonds, causing a wide decomposition temperature (160–627 C). The third stage occupied the remaining small part of the total loss with a higher temperature range, as shown in Table 2. During this stage, the DTG peak for three biomass samples appeared at around 420 °C, and CS showed a sharp and narrow peak, while RH and RS presented a smaller and smoother peak. A deduction was that the decomposition process changed the physicochemical properties of the char produced after the burnout of volatiles, and the combustion performance in the char combustion process significantly varied. Liu et al. (2015) pointed out that the formation or the structure of char differed greatly during the carbonization process, directly affecting the DTG peaks.
Co-Combustion Properties of the Biomass and Coal Blends
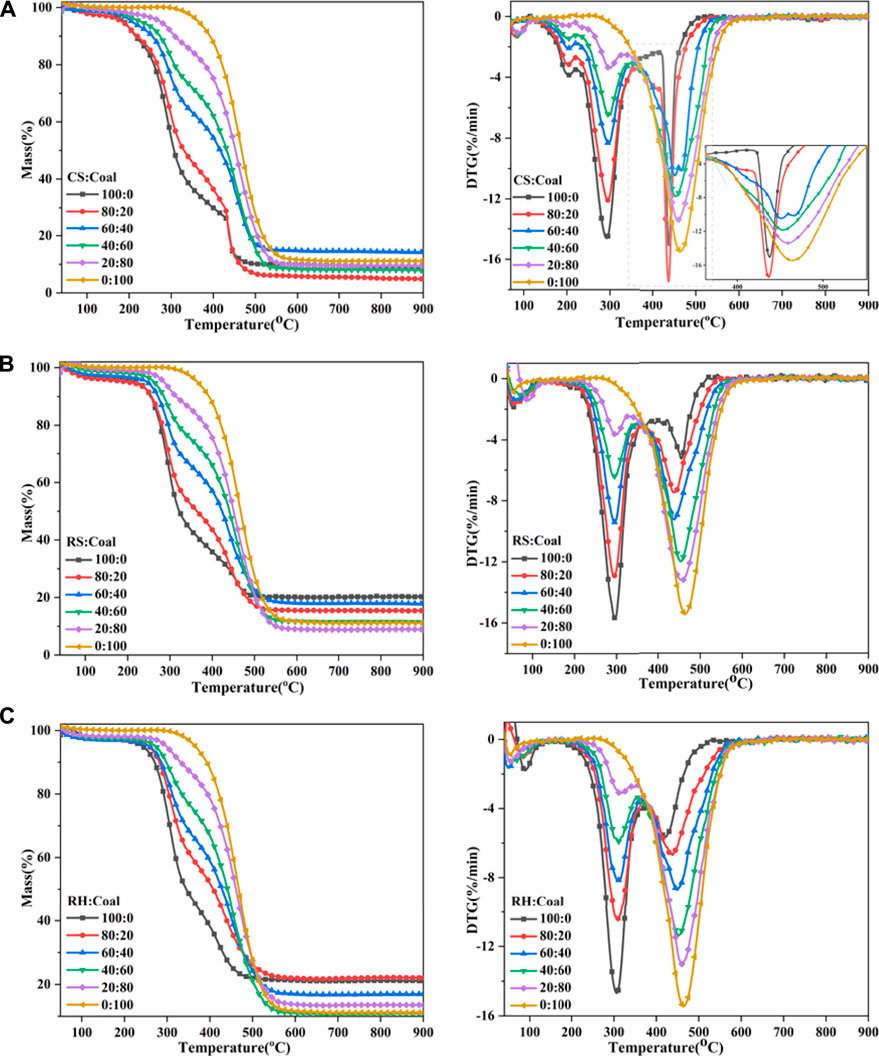
The mass loss and DTG profiles of coal and biomass blends are presented in Figure 3. The combustion process of the blends also contained three stages: moisture evaporation, the decomposition and combustion of volatile matters, and the oxidation of char. It can be seen that for RS and RH, the DTG curves of their blends were located between individual fuels, but for CS, there existed obvious overlapping in its DTG curve, corresponding to the evident decline in the TG curve at approximately 430 °C for CS and 80% CS samples. It was easy to interpret that the intensity of the third DTG peak for CS varied distinctly with RS and RH owing to the higher fixed carbon content and the significantly lower ash content within CS in Table 1, generating a higher amount of combustible char, that is, more flammable substances would be produced and combusted in Stage C. Besides, the higher carbon and lower oxygen content required more oxygen during combustion, so the combustion of certain matters in Stage B was delayed, contributing to a higher DTG value in Stage C. When 20% of coal was added to the biomass sample, the combustion performance of the mixed sample improved. This was owing to the fact that the large amount of heat generated during the combustion of biomass volatiles would facilitate the combustion of coal and biomass char. While more coal was mixed with CS, the combustion of char needed more heat, but the combustion of biomass char could not provide sufficient heat; thus, the third DTG peak moved forward to a higher-temperature range. In a similar case in corn and wheat straw, Li et al. (2014) and Wang et al. (2019) identified the same phenomenon.
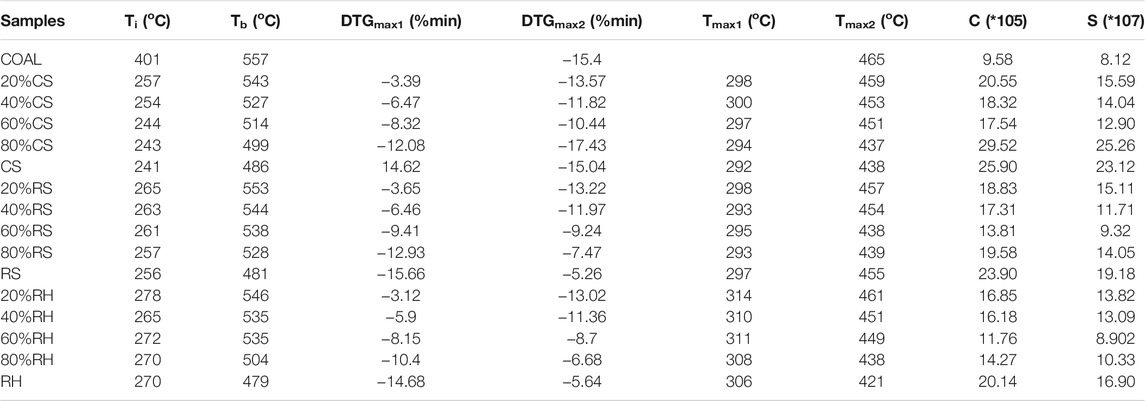
To compare combustion characteristics and quantitatively analyze, various combustion parameters are shown in Table 3. The main observation was that when the percentage of biomass in the blends increased, the ignition temperature immediately decreased, but a relatively slow reduction in the burnout temperature was found. It was noteworthy that the ignition temperature of the blends was extremely close to that of individual biomass samples, revealing that the ignition of two fuels occurred independently, and biomass played a predominant role at low temperatures. A possible explanation for this might be that many volatile matters were obtained and rapidly ignited. The combustion of the volatiles was an exothermic reaction, giving off a large amount of heat and increasing the surface temperature (Liu et al., 2015) and thereby the reaction rate of blends. In contrast, when the percentage of biomass was within 60%, the burnout temperature for blends was closer to that of the coal sample. This result suggested that the coal dominated the burnout process for the blends, which was probably related to the higher carbon content in coal, requiring a high temperature to burn out.
Another important index obtained for the curves was the maximum DTG value; DTGmax was deemed to be proportionate to sample reactivity. DTGmax1 and DTGmax2 represented the maximum loss rates for Stages B and C, respectively. In the blends, DTGmax1 increased with the percentage of biomass contained in the blends, which suggested that the higher the amount of biomass in the mixtures, the faster the rate of mass loss for the second stage or in other words, the higher the reactivity of the sample in this stage. This result may be explained by the fact that the biomass had a lower ignition temperature and almost all volatiles generated in Stage B would be combusted, contributing to the higher DTG value for the first mass loss peak. In stage C, this was not the case due to the addition of coal, and DTGmax2 increased with the rising percentage of coal in the blends, suggesting that coal could improve the reactivity of the samples in the later stage of combustion. It was easy to understand that the higher the ratio of coal, the higher the fixed carbon in the blends, and the combustion of flammable substances including char enhanced the sample’s reactivity. Interestingly, there was a turning point for blends where DTGmax2 was bigger than DTGmax1 when 40% of coal was mixed with biomass. This observation may support the hypothesis that biomass controlled the second combustion stage (Stage B), while coal dominated the third stage (Stage C).
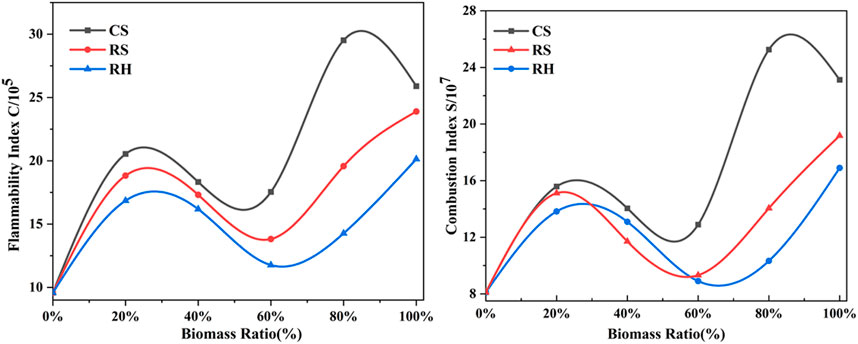
Finally, to achieve a comprehensive evaluation of ignition and combustion performance of coal and biomass blends, two combustion indices as a function of biomass blending ratio are shown in Figure 4. The trend of S and C increased first, then declined, and rose again when the percentage of biomass exceeded 80%, overall exhibiting an “N” curve shape. What stands out in the figure is the marked value of C and S for 20% biomass mixed in blends, implying the improvement of combustion performance by the addition of biomass. Considering the stability of boiler operation and the limitation of the feeding system, the amount of biomass in the blends is suggested to be kept at around 20%, according to the results in this study. Previous research (Zhou et al., 2016) had confirmed that the blending proportion of 20% was regarded as the optimum blend for the co-combustion of corn stalk and bituminous coal. This conclusion was consistent with the review by Sahu et al. (2014), which reported that a biomass content of 20% favored the best additive effects.
Synergistic Effect Analysis
To identify whether interactions between coal and biomass happened during the co-combustion process, the calculated TG curves of the blends based on the experimental curves of individual fuels were compared with experimental curves. Assuming that there were no interactions between the two components, the calculated TG curves could be expressed as follows (Wang et al., 2019; Guo et al., 2020):
where
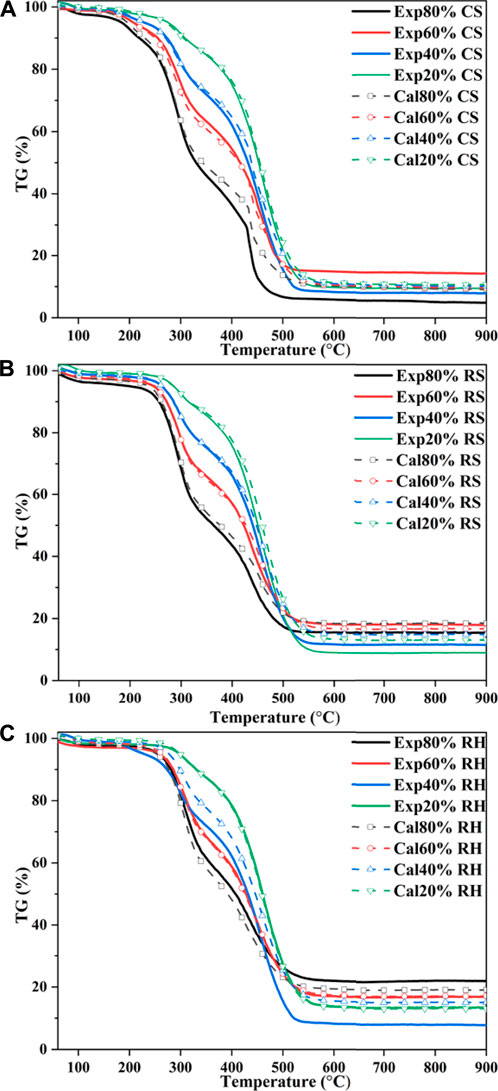
The calculated TG curves of three blends are shown in Figure 5. To further elucidate the differences between the two curves of the mixed samples, the deviation was introduced as follows (Wang et al., 2019):
where
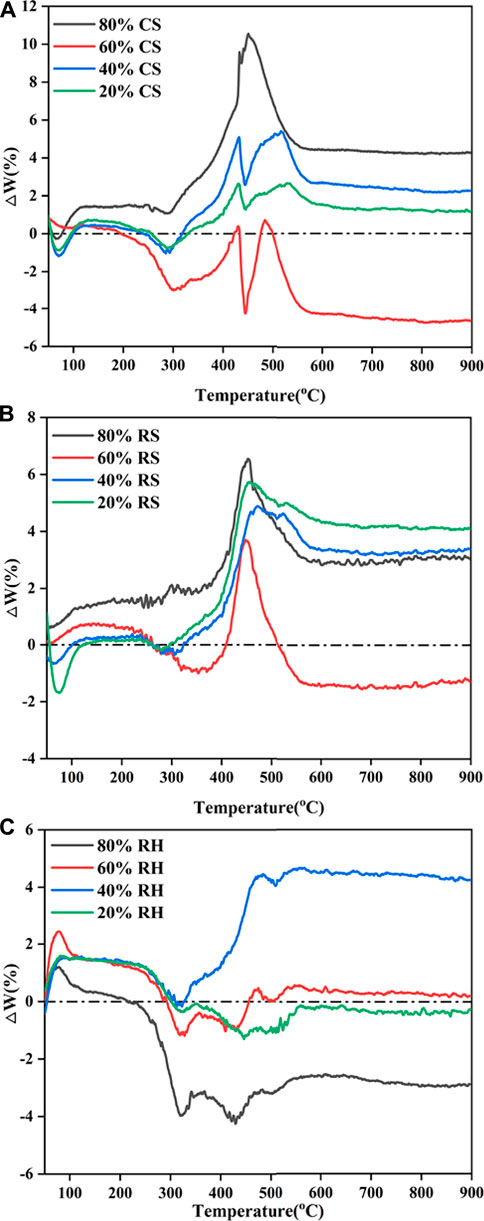
FIGURE 6. Comparison of deviation between calculated and experimental TG values: (A) CS, (B) RS, and (C) RH.
As shown in Figure 5 and Figure 6, CS and RS exhibited similar patterns for calculated and experimental curves. From the initial stage to around 250 °C (the ignition temperature of biomass), good agreement was observed between TGcal and TGexp for the biomass ratios of 20, 40, and 60% in the blends, which suggested that no interactions happened. With the increase of conversion, when the temperature rose to 300 °C, the
This may be attributed to the thermal resistance effect, in which the biomass component of the blends softened, flowed, and then adhered to the burning surface. Besides, a higher temperature was needed for the devolatilization of the high coalification degree of coal, and the heat released by biomass combustion after ignition was used for the endothermic reaction of the coal’s ignition process. However, when the temperature was over 350 °C, it can be seen from Figure 6 that TGexp markedly excessed TGcal, which indicated that the inhibition turned into a promoting effect. The
It was noteworthy that the interaction between 60% biomass and 40% coal lagged behind other group blends; for CS, the interaction functioned as inhibition. This phenomenon may be driven by the fact that the devolatilization of chemical constituents from biomass blocked the pores of coal (Konwar et al., 2019), which could weaken heat-transfer efficiency and oxygen diffusion, therefore hindering the combustion of fixed carbon, inhibiting the devolatilization process and exerting resistance on gas diffusion (Chen et al., 2015). Besides, the generated fly ash would hinder the diffusion of the flame during 40% coal char combustion, thereby exhibiting a distinct flame retardant effect. Under such a blending ratio, the catalytic effects of biomass char were dramatically restricted by the blocking pores, while for 80% biomass samples, the reaction of biomass in different stages dominated the whole process due to the higher biomass blending ratio. Cong et al. (2020) confirmed this result in evaluating the performance of semi-coke and corn stover, and such a trend was also observed.
As for RH, which is shown in Figure 6C, the calculated and experimental TG profiles almost coincided for 20 and 60% RH blends. It was noted that for 40% RH, the calculated values were higher than experimental values and
Kinetic Analysis
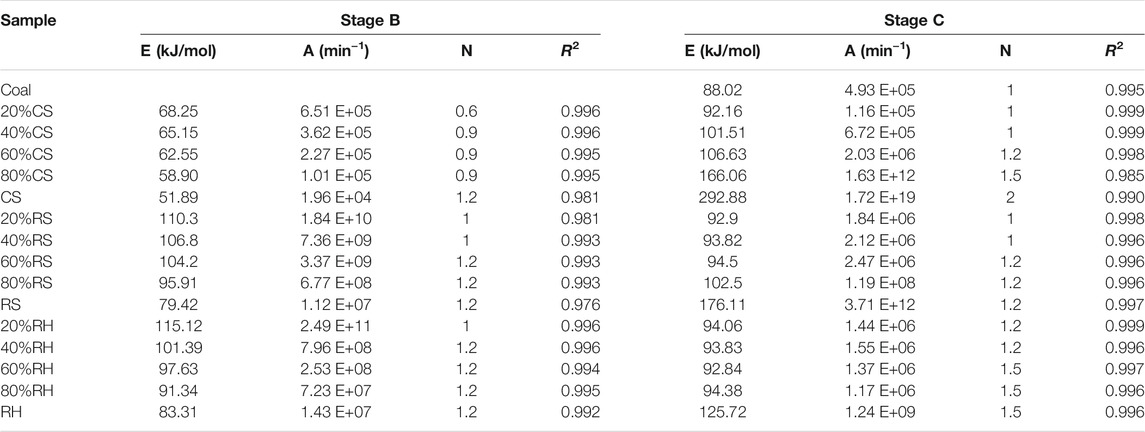
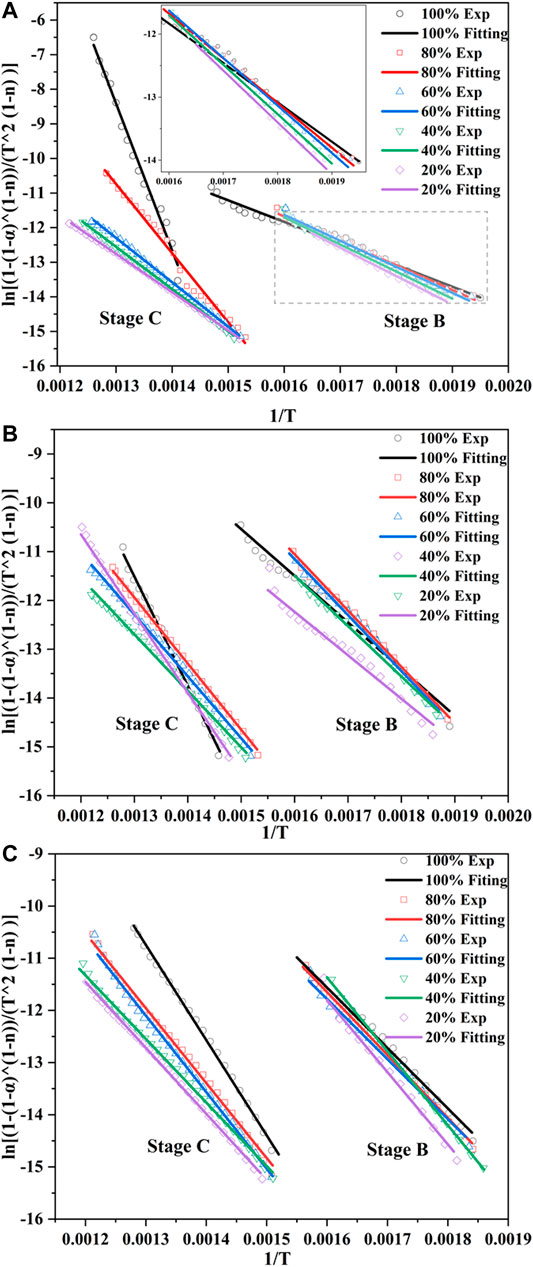
The kinetic parameters were calculated on the assumption that the reaction was separated into a single stage during the thermal conversion (Gil et al., 2010). Thus, two independent reactions were necessary for coal/biomass blends to describe the co-combustion process, and the conversion in each stage was recalculated for each reaction. In this study, several reaction order values (n = 0.3, 0.6, 0.9, 1, 1.2, 1.5, 2, and 3) were applied to the TG data; the n value that gave the highest correlation coefficient represents the kinetic mechanisms for each reaction. Table 4 shows that in this research, reaction orders of 0.9–1.2 and 1–1.5 were the best fitting models for Stage B and Stage C, respectively. Similarly, Chen et al. (2018) also reported that 1.2 and 1.5 were the most suitable model functions for the two stages during the co-combustion of coal/biomass blends.
Figure 7 shows the curve fitting of CR plots for all samples, which had the best linear results. Most of the resulting correlation coefficients (R2) were higher than 0.99 (Table 4), indicating that the calculation profiles were reliable. A decreasing order of activation energy was found in Stage B, followed by RH > RS > CS, and the E values for the three biomasses were 83.31 kJ/mol, 79.42 kJ/mol, and 51.89 kJ/mol, respectively. As the reaction progressed, what stood out in Stage C was the sharp increase for the E values, which were 292.88 kJ/mol, 176.11 kJ/mol, and 125.72 kJ/mol, with the opposite order as RH < RS < CS. The E values were considered to be the minimum energies required for the combustion reactions, with the high value representing that the reaction started slowly. These results meant that CS was easier to ignite in the early stage, but more energy was needed to break down the barriers in the later combustion process. This was due to the difference in the constitution of the three biomasses; the decomposition and burning of volatile matter and fixed carbon greatly influenced the combustion process. A single or overlapping process of manifold reaction mechanisms, including diffusion and interface, also accounted for the different values (Huang et al., 2018). The difference in the E values between the two stages implied that a higher temperature was required for the char-burning stage, revealing that this reaction with higher activation energies was more temperature-dependent (Masnadi et al., 2014; Liu et al., 2015).
It was noted that in Stage B for all blends, the activation energy and pre-exponential factor values increased with increasing biomass ratio in the blends, while a significant opposite trend was observed in Stage C. Besides, when the biomass ratio was under 60%, there was no striking difference in E values between the coal sample and the blends in Stage C; for RH, the blending ratio even reached 80%. This finding also accorded with our earlier observations, which showed that coal dominated the oxidation of char in the later stage. The activation energy value of coal and biomass blends acquired in this study was comparable to those of previous studies. Zhou et al. (2016) reported that the activation energy of corn stalk/bituminous coal blends was in the range of 64.5–94.8 kJ/mol. Xie and Ma (2013) demonstrated 97 kJ/mol of E value for rice straw using the Friedman method. Wang et al. (2020) specified an activation energy of 83.35 kJ/mol for rice husk with a second-order reaction mechanism.
Conclusions
In the air atmosphere, the combustion process of biomass and the blends could be portioned into two stages after the initial moisture evaporation compared to a single stage for the coal sample. Considering the pattern of characteristic combustion parameters (Ti, Tb, DTGmax1, DTGmax2, Tmax1, Tmax2, C, and S), as the biomass ratio increased, the combustion performance of the blends was enhanced. Based on the combustion characteristics, 20% biomass was the optimum percentage for the co-combustion process. The synergetic interaction of the co-combustion process for CS and RS blends was observed due to the catalytic effect of the biomass ash. However, an inhibiting effect for RH and coal in a higher biomass ratio was found, attained by a large amount of SiO2 content in ash, hindering the combustion of fixed carbon. The reaction orders of 1.2 and 1.5 were the best fitting results for Stages B and C and sought to be the reaction mechanisms for biomass and the blends. In Stage B, the activation energy values for three biomasses showed a decreasing order as RH > RS > CS, and the E values were 83.31 kJ/mol, 79.42 kJ/mol, and 51.89 kJ/mol, respectively. However, as the reaction was processed, an opposite trend was reported. Also, the E and A values increased with the increasing biomass percentage in Stage B, while the oxidation of char dominated Stage C and presented a decreasing pattern.
Data Availability Statement
The original contributions presented in the study are included in the article/Supplementary material; further inquiries can be directed to the corresponding author.
Author Contributions
YY drafted the work and agreed to be accountable for all aspects of the work in ensuring that questions related to the accuracy or integrity of any part of the work are appropriately investigated and resolved. YH revised it critically for important intellectual content. JT and YW helped the acquisition, analysis, or interpretation of data for the work. ZW and SK provided approval for publication of the content.
Funding
This work was supported by the National Natural Science Foundation of China (51776185), the Zhejiang Provincial Natural Science Foundation (LGC19E060001, LY20E060005), and the Fundamental Research Funds for the Central Universities (2021FZZX001-11).
Conflict of Interest
The authors declare that the research was conducted in the absence of any commercial or financial relationships that could be construed as a potential conflict of interest.
Publisher’s Note
All claims expressed in this article are solely those of the authors and do not necessarily represent those of their affiliated organizations, or those of the publisher, the editors and the reviewers. Any product that may be evaluated in this article, or claim that may be made by its manufacturer, is not guaranteed or endorsed by the publisher.
References
Chen, J., Mu, L., Cai, J., Yin, H., Song, X., and Li, A. (2015). Thermal Characteristics and Kinetics of Refining and Chemicals Wastewater, lignite and Their Blends during Combustion. Energ. Convers. Manage. 100, 201–211. doi:10.1016/j.enconman.2015.05.016
Chen, G.-B., Chatelier, S., Lin, H.-T., Wu, F.-H., and Lin, T.-H. (2018). A Study of Sewage Sludge Co-Combustion with Australian Black Coal and Shiitake Substrate. Energies 11 (12), 3436. doi:10.3390/en11123436
Coats, A. W., and Redfern, J. P. (1964). Kinetic Parameters from Thermogravimetric Data. Nature 201 (491), 68–69. doi:10.1038/201068a0
Cong, H., Zhao, L., Mašek, O., Yao, Z., Meng, H., Huo, L., et al. (2020). Evaluating the Performance of Honeycomb Briquettes Produced from Semi-Coke and Corn stover Char: Co-Combustion, Emission Characteristics, and a Value-Chain Model for Rural China. J. Clean. Prod. 244, 118770. doi:10.1016/j.jclepro.2019.118770
Gil, M. V., Casal, D., Pevida, C., Pis, J. J., and Rubiera, F. (2010). Thermal Behaviour and Kinetics of Coal/Biomass Blends During Co-Combustion. Bioresour. Technol. 101 (14), 5601–5608. doi:10.1016/j.biortech.2010.02.008
Guo, S., Han, Y., Wang, L., Che, D., Liu, H., and Sun, B. (2020). Synergistic Effects of Co‐Combustion of Sewage Sludge and Corn Stalk and the Resulting Gas Emission Characteristics. IET Renew. Power Generation 14 (9), 1596–1605. doi:10.1049/iet-rpg.2020.0104
Haykiri-Acma, H., and Yaman, S. (2008). Effect of Co-Combustion on the Burnout of Lignite/Biomass Blends: A Turkish Case Study. Waste Manage. 28 (11), 2077–2084. doi:10.1016/j.wasman.2007.08.028
Hossain, S. S., Mathur, L., and Roy, P. K. (2018). Rice Husk/Rice Husk Ash as an Alternative Source of Silica in Ceramics: A Review. J. Asian Ceram. Societies 6 (4), 299–313. doi:10.1080/21870764.2018.1539210
Hu, J., Yan, Y., Evrendilek, F., Buyukada, M., and Liu, J. (2019). Combustion Behaviors of Three Bamboo Residues: Gas Emission, Kinetic, Reaction Mechanism and Optimization Patterns. J. Clean. Prod. 235, 549–561. doi:10.1016/j.jclepro.2019.06.324
Huang, L., Xie, C., Liu, J., Zhang, X., Chang, K., Kuo, J., et al. (2018). Influence of Catalysts on Co-Combustion of Sewage Sludge and Water Hyacinth Blends as Determined by TG-MS Analysis. Bioresour. Technol. 247, 217–225. doi:10.1016/j.biortech.2017.09.039
Huo, L., Yao, Z., Yao, Z., Jia, J., Zhao, L., Cong, H., et al. (2020). Evaluation of Different Clean Heat Supply Modes Based on Crop Straws in the Rural Area of Northern China. Int. J. Agric. Biol. Eng. 13 (5), 209–217. doi:10.25165/j.ijabe.20201305.5600
Jayaraman, K., Kok, M. V., and Gokalp, I. (2017). Thermogravimetric and Mass Spectrometric (TG-MS) Analysis and Kinetics of Coal-Biomass Blends. Renew. Energ. 101, 293–300. doi:10.1016/j.renene.2016.08.072
Kastanaki, E., and Vamvuka, D. (2006). A Comparative Reactivity and Kinetic Study on the Combustion of Coal-Biomass Char Blends. Fuel 85 (9), 1186–1193. doi:10.1016/j.fuel.2005.11.004
Konwar, K., Nath, H. P., Bhuyan, N., Saikia, B. K., Borah, R. C., Kalita, A. C., et al. (2019). Effect of Biomass Addition on the Devolatilization Kinetics, Mechanisms and Thermodynamics of a Northeast Indian Low Rank Sub-bituminous Coal. Fuel 256, 115926. doi:10.1016/j.fuel.2019.115926
Li, L., Ren, Q., Wang, X., Li, S., and Lu, Q. (2014). TG-MS Analysis of thermal Behavior and Gaseous Emissions during Co-Combustion of Straw with Municipal Sewage Sludge. J. Therm. Anal. Calorim. 118 (1), 449–460. doi:10.1007/s10973-014-3952-7
Lin, Y., Ma, X., Ning, X., and Yu, Z. (2015). TGA-FTIR Analysis of Co-Combustion Characteristics of Paper Sludge and Oil-Palm Solid Wastes. Energ. Convers. Manage. 89, 727–734. doi:10.1016/j.enconman.2014.10.042
Liu, X., Chen, M., and Wei, Y. (2015a). Kinetics Based on Two-Stage Scheme for Co-Combustion of Herbaceous Biomass and Bituminous Coal. Fuel 143, 577–585. doi:10.1016/j.fuel.2014.11.085
Liu, Z., Li, W., Zhang, Y., Wang, J., Orndorff, W., and Pan, W.-P. (2015b). Influence of Biomass on Coal Combustion Based on Thermogravimetry and Fourier Transform Infrared Spectroscopy. J. Therm. Anal. Calorim. 122 (3), 1289–1298. doi:10.1007/s10973-015-4841-4
Lu, J.-J., and Chen, W.-H. (2015). Investigation on the Ignition and Burnout Temperatures of Bamboo and Sugarcane Bagasse by Thermogravimetric Analysis. Appl. Energ. 160, 49–57. doi:10.1016/j.apenergy.2015.09.026
Luo, J., Fang, Z., and Smith, R. L. (2014). Ultrasound-Enhanced Conversion of Biomass to Biofuels. Prog. Energ. Combustion Sci. 41, 56–93. doi:10.1016/j.pecs.2013.11.001
Masnadi, M. S., Habibi, R., Kopyscinski, J., Hill, J. M., Bi, X., Lim, C. J., et al. (2014). Fuel Characterization and Co-Pyrolysis Kinetics of Biomass and Fossil Fuels. Fuel 117, 1204–1214. doi:10.1016/j.fuel.2013.02.006
Sahu, S. G., Chakraborty, N., and Sarkar, P. (2014). Coal-Biomass Co-Combustion: An Overview. Renew. Sustain. Energ. Rev. 39, 575–586. doi:10.1016/j.rser.2014.07.106
Sathitruangsak, P., and Madhiyanon, T. (2017). Effect of Operating Conditions on the Combustion Characteristics of Coal, Rice Husk, and Co-Firing of Coal and Rice Husk in a Circulating Fluidized Bed Combustor. Energy Fuels 31 (11), 12741–12755. doi:10.1021/acs.energyfuels.7b01513
Shi, K., Oladejo, J. M., Yan, J., and Wu, T. (2019). Investigation on the Interactions Among Lignocellulosic Constituents and Minerals of Biomass and Their Influences on Co-Firing. Energy 179, 129–137. doi:10.1016/j.energy.2019.05.008
Su, W., Ma, H., Wang, Q., Li, J., and Ma, J. (2013). Thermal Behavior and Gaseous Emission Analysis During Co-Combustion of Ethanol Fermentation Residue from Food Waste and Coal Using TG-FTIR. J. Anal. Appl. Pyrolysis 99, 79–84. doi:10.1016/j.jaap.2012.10.023
Vamvuka, D., and Sfakiotakis, S. (2011). Combustion Behaviour of Biomass Fuels and Their Blends with lignite. Thermochim. Acta 526 (1-2), 192–199. doi:10.1016/j.tca.2011.09.021
Wang, C., Wang, F., Yang, Q., and Liang, R. (2009). Thermogravimetric Studies of the Behavior of Wheat Straw with Added Coal during Combustion. Biomass and Bioenergy 33 (1), 50–56. doi:10.1016/j.biombioe.2008.04.013
Wang, J., Zhang, S.-Y., Guo, X., Dong, A.-X., Chen, C., Xiong, S.-W., et al. (2012). Thermal Behaviors and Kinetics of Pingshuo Coal/Biomass Blends During Copyrolysis and Cocombustion. Energy Fuels 26 (12), 7120–7126. doi:10.1021/ef301473k
Wang, G., Zhang, J., Shao, J., Liu, Z., Zhang, G., Xu, T., et al. (2016). Thermal Behavior and Kinetic Analysis of Co-Combustion of Waste Biomass/low Rank Coal Blends. Energ. Convers. Manage. 124, 414–426. doi:10.1016/j.enconman.2016.07.045
Wang, C., Wang, X., Jiang, X., Li, F., Lei, Y., and Lin, Q. (2019). The thermal Behavior and Kinetics of Co-Combustion between Sewage Sludge and Wheat Straw. Fuel Process. Technol. 189, 1–14. doi:10.1016/j.fuproc.2019.02.024
Wang, T., Fu, T., Chen, K., Cheng, R., Chen, S., Liu, J., et al. (2020). Co-combustion Behavior of Dyeing Sludge and rice Husk by Using TG-MS: Thermal Conversion, Gas Evolution, and Kinetic Analyses. Bioresour. Technol. 311, 123527. doi:10.1016/j.biortech.2020.123527
Xie, Z., and Ma, X. (2013). The thermal Behaviour of the Co-Combustion between Paper Sludge and Rice Straw. Bioresour. Technol. 146, 611–618. doi:10.1016/j.biortech.2013.07.127
Yanfen, L., and Xiaoqian, M. (2010). Thermogravimetric Analysis of the Co-Combustion of Coal and Paper Mill Sludge. Appl. Energ. 87 (11), 3526–3532. doi:10.1016/j.apenergy.2010.05.008
Zhou, C., Liu, G., Cheng, S., Fang, T., and Lam, P. K. S. (2014). Thermochemical and Trace Element Behavior of Coal Gangue, Agricultural Biomass and Their Blends during Co-combustion. Bioresour. Technol. 166, 243–251. doi:10.1016/j.biortech.2014.05.076
Keywords: co-combustion, characteristics, kinetics, coal, biomass
Citation: Yuan Y, He Y, Tan J, Wang Y, Kumar S and Wang Z (2021) Co-Combustion Characteristics of Typical Biomass and Coal Blends by Thermogravimetric Analysis. Front. Energy Res. 9:753622. doi: 10.3389/fenrg.2021.753622
Received: 05 August 2021; Accepted: 03 September 2021;
Published: 13 October 2021.
Edited by:
Xuezhong He, Guangdong Technion-Israel Institute of Technology, ChinaReviewed by:
Linfeng Lei, East China University of Science and Technology, ChinaYang Xiao, Xi’an University of Science and Technology, China
Copyright © 2021 Yuan, He, Tan, Wang, Kumar and Wang. This is an open-access article distributed under the terms of the Creative Commons Attribution License (CC BY). The use, distribution or reproduction in other forums is permitted, provided the original author(s) and the copyright owner(s) are credited and that the original publication in this journal is cited, in accordance with accepted academic practice. No use, distribution or reproduction is permitted which does not comply with these terms.
*Correspondence: Yong He, aGV5b25nQHpqdS5lZHUuY24=
 Ye Yuan
 Yong He*
 Zhihua Wang