 Mingzhu Tang
 Jiahao Hu
 Huawei Wu2*
- 1School of Energy and Power Engineering, Changsha University of Science and Technology, Changsha, China
- 2Hubei Key Laboratory of Power System Design and Test for Electrical Vehicle, Hubei University of Arts and Science, Xiangyang, China
- 3School of Computer Science and Information Security, Guilin University of Electronic Technology, Guilin, China
A fault detection method of wind turbine pitch system using semi-supervised optimal margin distribution machine (ssODM) optimized by dynamic state transition algorithm (DSTA) [ssODM-DSTA] was proposed to solve the problem of obtaining the optimal hyperparameters of the fault detection model for the pitch system. This method was adopted to input the three hyperparameters of the ssODM into the dynamic state transition algorithm in the form of a three-dimensional vector to obtain the global optimal hyperparameters of the model, thus improving the performance of the fault detection model. Using a random forest to rank the priority of features of the pitch system fault data, the features with large weight proportions were retained. Then, the Pearson correlation method is used to analyze the degree of correlation among features, filter redundant features, and reduce the scale of features. The dataset was divided into a training dataset and a test dataset to train and test the proposed fault detection model, respectively. The real-time wind turbine pitch system fault data were collected from domestic wind farms to carry out fault detection experiments. The results have shown that the proposed method had a positive fault rate (FPR) and fault negative rate (FNR), compared with other optimization algorithms.
Introduction
China’s energy structure is unceasingly transforming towards low carbon and environmental protection by striving to build a new energy system and vigorously advocating the development of renewable energy industry to achieve the overall objective of carbon emission peak by 2030 and carbon neutrality by 2060 (Li and Bo, 2020; Qian and Wang, 2020; Sun et al., 2015). Renewable energy is a kind of clean and green energy that can replace traditional energy. The emergence of this energy has made a great contribution to reducing pollution and emission in the world. Renewable energy power systems (Zhang et al., 2021; Zhang and Ruan, 2019) mainly include wind power generation, solar power generation, and hydropower generation. Wind power, as an indispensable part of renewable energy, continues to expand in scale. By the end of 2020, China’s installed capacity of grid-connected wind power has reached 281.53 million kW, increasing by 34.6% year over year, accounting for 12.79% of the total installed capacity (Blaabjerg et al., 2012; Blaabjerg and Ke Ma, 2013). However, as the wind power industry is rapidly developing, the maintenance and repair pressure of wind turbines is also increasing. The operating environment of wind turbines is relatively bad. Abnormal climate, unstable wind speed, and other factors often lead to the faults of wind turbines and the shutdown (Song et al., 2021; Yang et al., 2021). The fault rate and complexity of the pitch system, an important part of the wind turbine, are higher than those of the main shaft, gearbox, and generator (Wang et al., 2021). In case of any fault, the power generation rate of the wind turbine will be directly affected, leading to damage to the wind turbine and huge economic losses. For this reason, effective fault detection is of great significance for wind turbine pitch systems.
In the wake of the era of big data and emerging machine learning, fault detection and fault diagnosis methods for wind turbines based on machine learning algorithms have gradually matured in recent years (Hu et al., 2021; Tang et al., 2021; Long et al., 2020). With the wind turbine fault data in the SCADA system, which can collect, monitor, and control the operation data of wind turbines in real-time, it is a common and reliable method to choose an appropriate machine learning algorithm for the fault detection of wind turbines. Machine learning algorithms mainly include supervised learning, unsupervised learning, semi-supervised learning, and reinforcement learning. Generally, classification methods for wind turbine fault detection include support vector machine (SVM), artificial neural networks (ANNs) (Xi et al., 2021), and Large margin distribution machine (LDM) (Zhang and Zhou, 2014). In the literature (Tuerxun et al., 2021), a SVM based on a sparrow search algorithm (SSA) was used for wind turbine fault diagnosis and had achieved excellent results. Moreover, a fault diagnosis method based on stochastic subspace identification and multinuclear SVM was proposed to identify bearing faults of wind turbines (Zhao et al., 2019). The ANNs and empirical mode decomposition (EMD) were used to effectively identify different turbine imbalance faults in (Malik and Mishra, 2017). In (Zhang and Wang, 2014), the artificial neural networks had a great diagnosis effect on the main bearing of the wind turbine during early fault prediction. The cost-sensitive large margin distribution machine (CLDM) proposed in (Tang et al., 2019) can better deal with the classification imbalance data and misclassification cost inequality of wind turbine datasets.
The above methods are only applicable to the input data with characteristic values and tags. However, tags are usually scarce and expensive in the actual wind turbine data, which can be effectively dealt with using the semi-supervised learning method. Commonly used semi-supervised learning methods include transductive support vector machine (TSVM), safe semi-supervised support vector machine (S4VM), and Laplacian support vector machine (LaSVM) (Chong et al., 2020). In (Shen et al., 2012), a gear reducer fault diagnosis model based on EMD and TSVM was proposed to solve the problem of insufficient tags of gear reducer data samples, and results have shown a high fault diagnosis accuracy. In (Li, 2010), graph theory and transductive support vector machine (GTSVM) was used to solve the problem of insufficient fault samples for training in mechanical fault diagnosis, and results have shown that this method improved the accuracy of fault diagnosis. A new fault alarm rule based on the upper bound of S4VM generalized error proposed in (Mao et al., 2020) can self-adaptively identify the occurrence of early bearing faults. In (Dai et al., 2017), a rolling bearing fault diagnosis method based on composite multi-scale entropy (CMSE), sequential forward modeling selection, and LaSVM was proposed to solve the problem of the large sample size of and tagging difficulty in rolling bearing fault diagnosis, and results have shown that the effect of fault diagnosis was improved.
The semi-supervised optimal margin distribution machine (Zhang and Zhou, 2018) was a classification algorithm with high generalization ability, proposed for generalization ability based on optimal margin distribution machine (ODM) (Tan et al., 2020). “Lables” were given to the samples without lables and the semi-supervised learning was transformed into “supervised learning” via this algorithm. On this basis, on the premise of optimizing the minimum margin and maximizing the hyperplane, the distribution of sample margin was fully considered and the mean value and variance between samples were introduced to improve the classification ability of the algorithm.
The reasonable selection of hyperparameters can significantly affect the fault detection performance during fault detection for wind turbine pitch systems based on a machine learning algorithm. For this reason, the optimal hyperparameters of the fault detection model should be obtained by optimizing the parameter optimization algorithm (Long et al., 2021a; 2021b). In (Zhang et al., 2020), a particle swarm optimization algorithm (PSO) was used to optimize SVM for fault diagnosis of wind turbine gearbox bearings, and results have shown that the precision and accuracy of diagnosis were improved. In (Chen, 2020), backpropagation neural network (BPNN) and long short-term memory network (LSTMN) were combined with PSO and great fault diagnosis results were obtained in wind turbine rolling bearing fault diagnosis. In (Odofin et al., 2018), a genetic algorithm (GA) was adopted to optimize the machine learning algorithm to improve the reliability of the wind turbine energy system. In (Zhang et al., 2018), GA was introduced into anomaly identification of wind turbine state parameters to successfully optimize the anomaly identification results. In (Yao et al., 2021), grid search (GS) was used to optimize the fault classification algorithm during battery fault diagnosis and the fault diagnosis accuracy was improved. In (Zhang and Sheng, 2021), GS was used to optimize the hyperparameters and kernel functions of support vector machines to improve the accuracy of the motor fault diagnosis.
With a design based on a state transition algorithm (STA) (Zhou et al., 2012), the DSTA (Zhou et al., 2018) is a dynamic stochastic intelligent global optimization method with its own risk
For complex and variable pitch system faults, it is often difficult to select the optimal parameters for the fault detection model of the wind turbine pitch system. Meanwhile, variable pitch fault data without tags will lead to unsatisfactory fault detection results. For this problem, a method of optimizing a ssODM based on a DSTA was proposed.
Semi-Supervised Optimal Margin Distribution Machine
Suppose the mean margin value of training dataset samples after normalization is
where the parameter
where
As the maximum objective function was equal to the minimum
A parameter
where
The final dual form of ssODM is as follows:
When a dataset containing a large number of unlabeled samples is input into ssODM, the saddle point
Dynamic State Transition Algorithm
The expression framework of the dynamic state transition algorithm is as follows:
where
The four transformation operators of the dynamic state transition algorithm covered the fast rotation transformation operator, translation transformation operator, expansion transformation operator, and axesion transformation operator.
Fast Rotation Transformation Operator
where
Translation Transformation Operator
where
Expansion Transformation Operator
where
Axesion Transformation Operator
`where
The flowchart of the DSTA is shown in Figure 1.
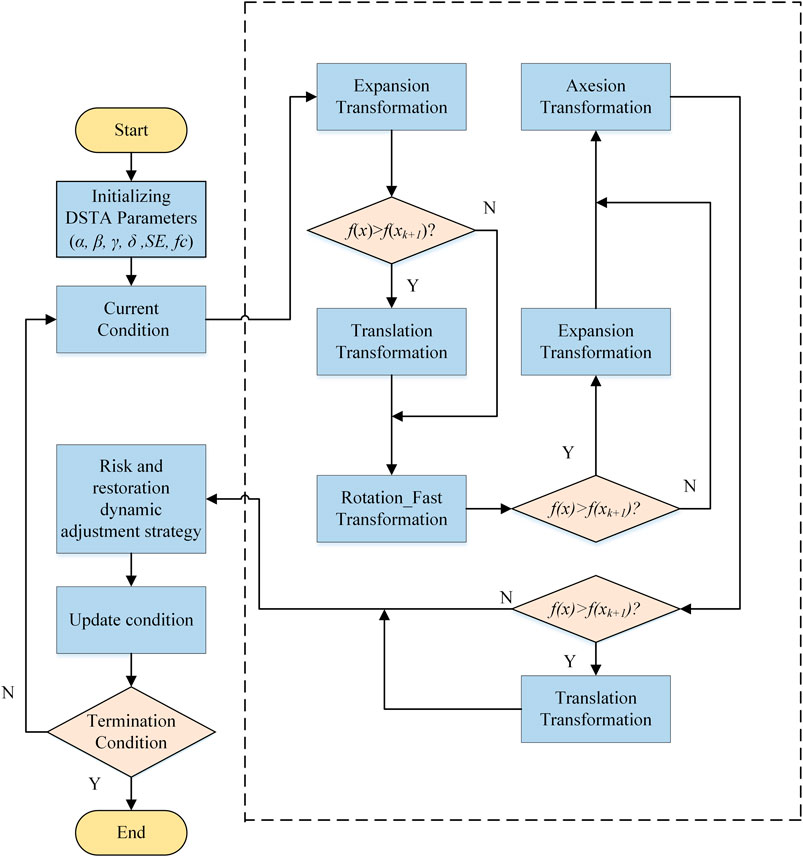
FIGURE 1. Flowchart of dynamic state transition algorithm.
Fault Detection for Wind Turbine Pitch System
Concerning the fault detection process of the wind turbine pitch system, it was roughly made of data screening, data preprocessing, feature selection, data segmentation, training fault detection model and hyperparameter optimization, fault detection model testing, and detection result evaluation. The fault detection flowchart of the ssODM-DSTA wind turbine pitch system is shown Figure 2.
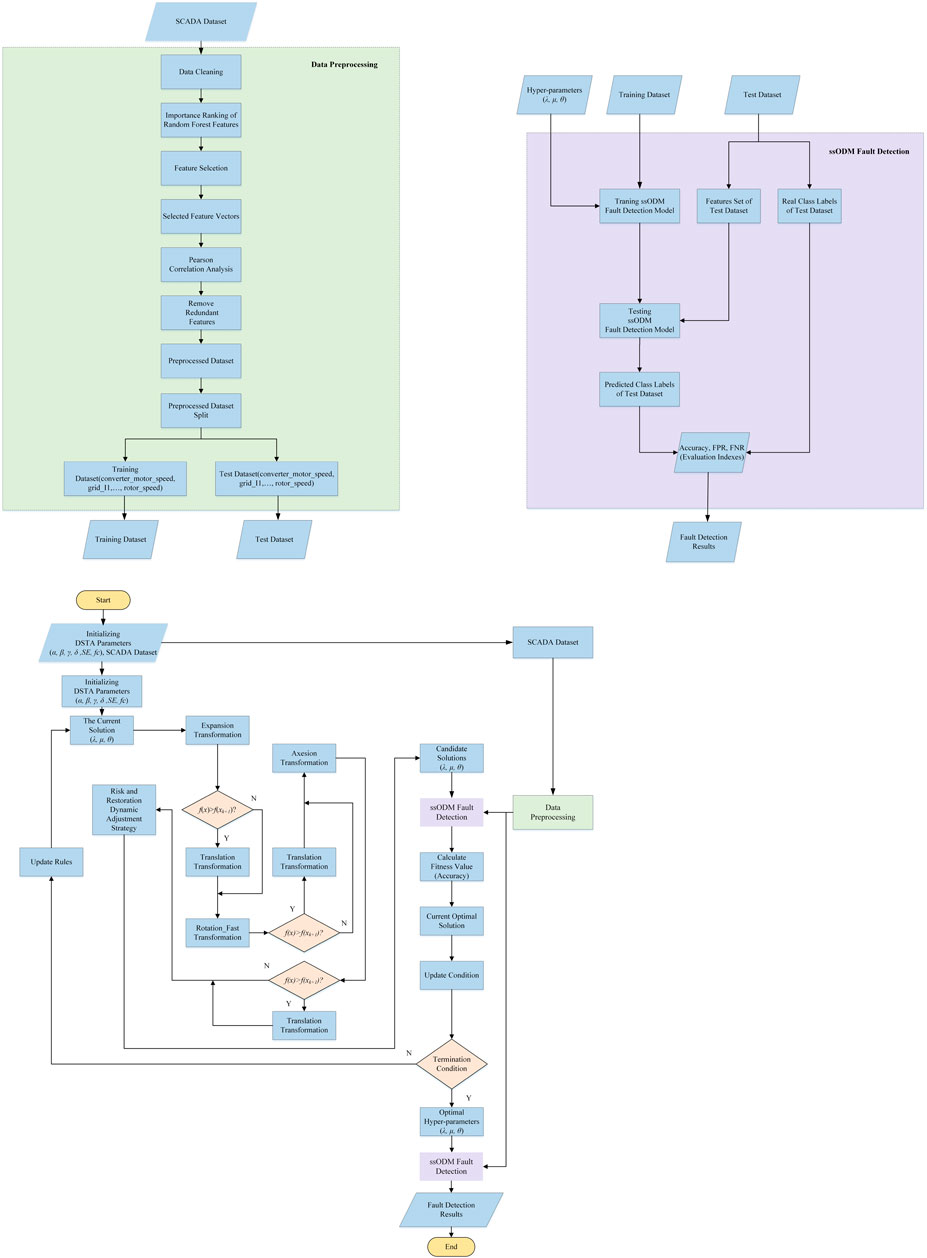
FIGURE 2. Fault detection flowchart of wind turbine pitch system based on ssODM-DSTA.
Dataset Description
The experimental data originated from the real-time operation data of the SCADA system of 1.5 MW double-fed wind turbines in the domestic wind farm for one year. The data sampling interval was 1 s. The data of the wind turbines in the wind farm in the 12th month were selected and the data of three kinds of wind turbines’ pitch faults from half an hour before the start of the faults to half an hour after the end of the faults were intercepted according to the fault codes. Three kinds of pitch system faults are used as fault detection targets: emergency stop fault of the pitch system, CAN communication fault of the blade 1 servo driver, and low-temperature fault of the blade 2 axle box of the pitch, respectively.
A pitch emergency stop fault is a fault triggered when the pitch safety chain acts. The treatment method of this fault is to check whether the pitch safety chain is closed and check the pitch fault specifically.
CAN communication fault of the blade 1 servo driver is the CANBUS communication fault between pitch PLC and pitchmaster of blade 1. The troubleshooting method is to check the wiring between the main control cabinet EL6751 and the X5 terminal on the pitchmaster in the shaft cabinet 2; check whether there is 24V DC voltage between x5-6 and x5-9; check the resistance between x5-2 and x5-7 (60 Ω); check whether the axis 2 servo driver is normal.
The low-temperature fault of the blade 2 axle box of the pitch is a temperature fault of the pitch system. The starting reason is generally the sensor fault. The fault can be eliminated and handled by checking various indicators of the sensor. The three fault data structures are shown in Table 1.
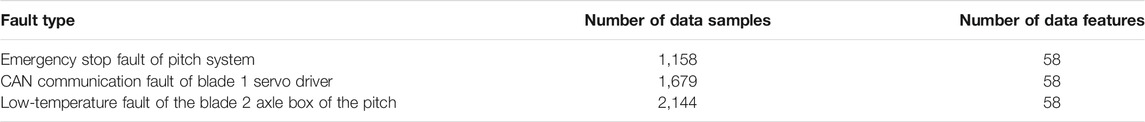
TABLE 1. Data structures of three faults of pitch system.
Data Cleaning and Preprocessing
The data of the wind turbine pitch system was fed back to the SCADA system in the form of a signal after the information was collected through various sensors such as current, voltage, and speed. The sensors were precision components. They were easily disturbed by the environment and their abnormalities in the monitoring process, which often led to abnormalities and vacancies in the data output of SCADA. The fault detection model had high requirements for the quality of data, so it was necessary to preprocess the data such as standardization, normalization, elimination of outliers, vacancy values, and all “0” eigenvectors (Tang M et al., 2020; Tang S et al., 2020).
Feature selection belongs to a data dimensionality reduction process. The commonly used feature selection methods cover the random forest method (Charvent et al., 2021), extreme gradient boosting (XGBoost)method (Chen et al., 2020), Pearson’s correlation analysis method (Jebli et al., 2021), and categorical boosting (CatBoost) method (Yuan et al., 2021). The random forest algorithm was used for ranking the importance of all sub-features of the preprocessed fault data of the pitch system with the wind speed as the target feature. Then, the threshold (mean value of all feature importance scores) was set to screen the features that were highly related to the target variable. On the premise of ensuring no loss of data information content, the number of features of the original data was reduced from 58 to 30, which effectively reduced the difficulty of learning the fault detection model of the wind turbine pitch system. The feature importance ranking of the fault data of the pitch system based on the random forest is shown in Table 2 (the bold part of No. 1–No. 30 was the 30 features that were saved after screening).
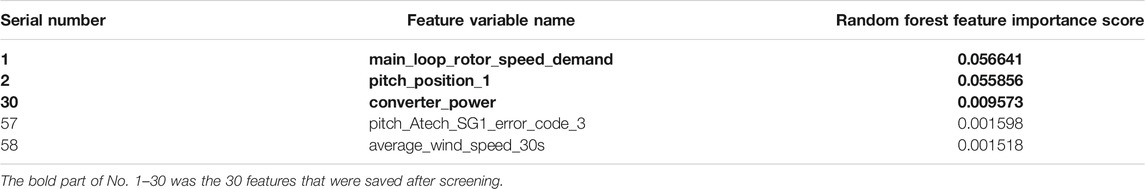
TABLE 2. Feature importance ranking of the fault data of the pitch system based on the random forest.
As redundant features with a high correlation may exist between features and the Pearson-related analysis method could be used for ensuring the equal relationship between features and analyzing the correlation degree between features, the Pearson-related analysis method was adopted to analyze the feature correlation of 30 pieces of screened fault data of the pitch system and remove the redundant features with a high correlation for further reducing the data capacity. The correlation results between the features are shown in Table 3.
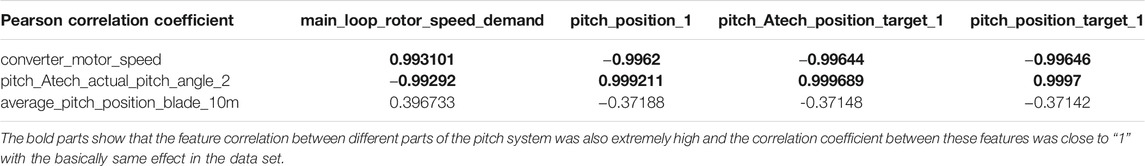
TABLE 3. Correlation results between the features.
Pearson correlation coefficient was an index describing the intensity of feature correlation with a value range of [-1, 1]. The closer the absolute value of the coefficient was to “1”, the stronger the correlation was. The bold parts of Table 3 show that the feature correlation between different parts of the pitch system was also extremely high and the correlation coefficient between these features was close to “1” with basically the same effect in the dataset. These features that belonged to redundant features were eliminated in the fault dataset of the pitch system and the remaining features were constructed into a new sample dataset. The final data structure is shown in Table 4.
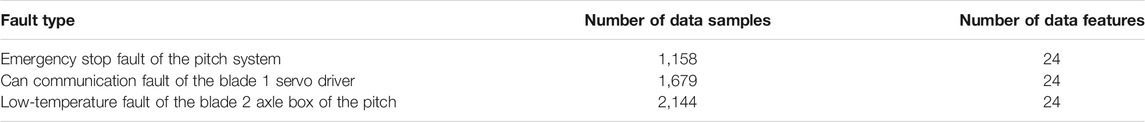
TABLE 4. Final data structures of 3 faults of pitch system after feature selection.
Improved Semi-supervised Optimal Margin Distribution Machine
The ssODM was equipped with three hyperparameters

TABLE 5. Meaning and value range of ssODM Hyperparameters.
The dynamic state transition algorithm was adopted to optimize the three hyperparameters of ssODM. The classification accuracy of ssODM was taken as the fitness function to determine the update and selection of hyperparameters by the dynamic state transition algorithm. The pseudo-code of the improved ssODM is shown in Algorithm 1.
Algorithm 1 Improved semi-supervised optimal margin distribution machine.
1:
2: repeat
3: if
4:
5: end if
6:
7:
8:
9:
10:
11:
12:
13:
14:
15: if
16:
17:
18: end if
19: if
20:
21:
22: end if
23:
24: Until the specified termination criterion is met
25: Output
Performance Evaluation Index of Fault Detection Model
The correct prediction of the purity of normal samples and fault samples was deemed to be an index to evaluate the quality of a model. To verify the effectiveness of fault detection of ssODM-DSTA, the FPR and the FNR proposed based on the confusion matrix were taken as the evaluation indexes of the model:
where the specific meanings of TP, FP, TN, and FN are shown in Table 6.
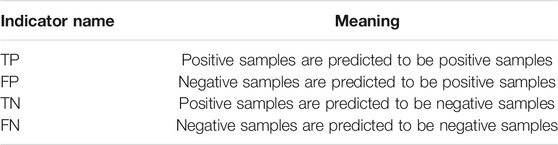
TABLE 6. Names and meanings of evaluation indexes of the model.
Experimental Results
For verifying the effectiveness of using DSTA to optimize the hyperparameters of ssODM, the PSO, GA, and GS were introduced to carry out the optimization comparison for the ssODM, respectively. The experimental data were from wind turbine pitch system fault data (the fault data of pitch system are set as 5% labeled data and 10% labeled data for experiments, respectively; the normal sample label is 1 and the fault sample label is—1), as shown in Table 4.
When the experimental sample was the emergency stop fault of the pitch, Figures 3, 4 represent the FPR of fault detection and the FNR of fault detection, respectively (5% labeled samples). Figures 5, 6 represented the FPR of fault detection and the FNR of fault detection (10% labeled samples).
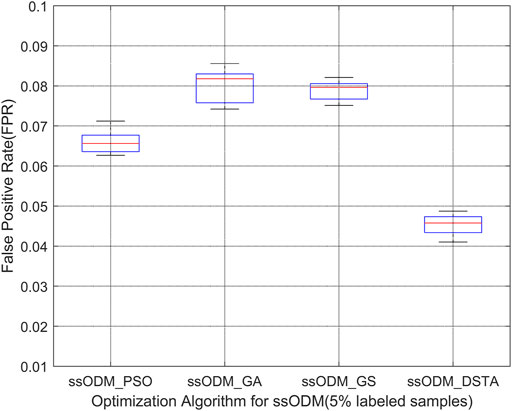
FIGURE 3. Boxplot of FPR of fault detection regarding the pitch emergency stop (5% labeled samples).
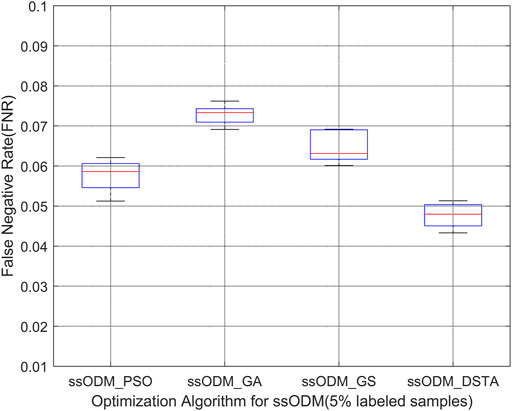
FIGURE 4. Boxplot of FNR of fault detection regarding the pitch emergency stop (5% labeled samples).
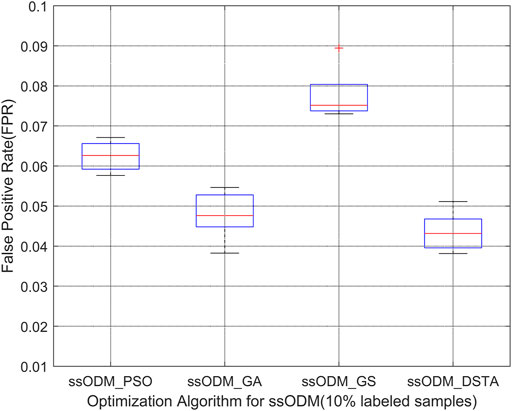
FIGURE 5. Boxplot of FPR of fault detection regarding the pitch emergency stop (10% labeled samples).
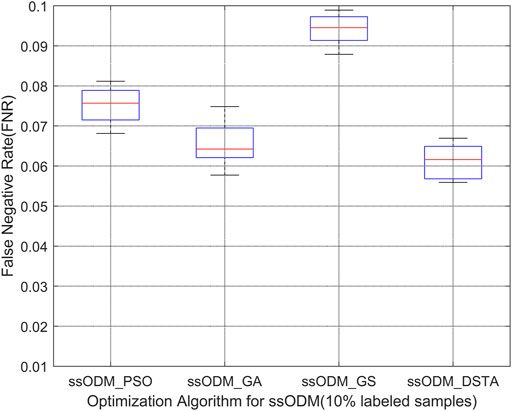
FIGURE 6. Boxplot of FNR of fault detection regarding the pitch emergency stop (10% labeled samples).
When the experimental sample was the CAN communication fault of blade 1 servo driver, Figures 7, 8 represent the FPR of fault detection and the FNR of fault detection, respectively (5% labeled samples). Figures 9, 10 represent the FPR of fault detection and the FNR of fault detection (10% labeled samples).
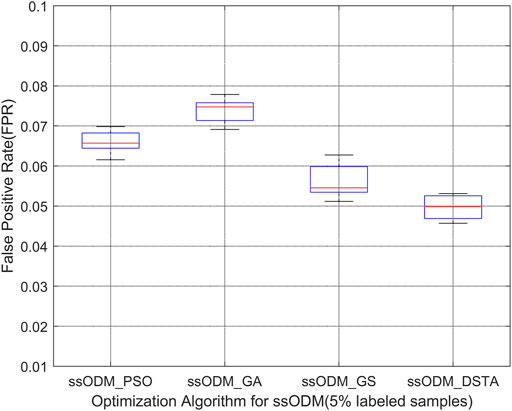
FIGURE 7. Boxplot of FPR of CAN communication fault detection regarding blade 1 servo driver (5% labeled samples).
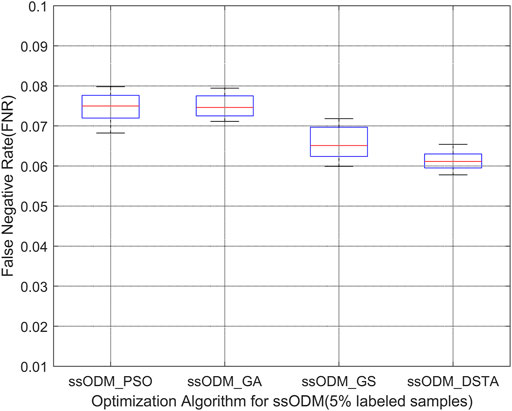
FIGURE 8. Boxplot of FNR of CAN communication fault detection regarding blade 1 servo driver (5% labeled samples).
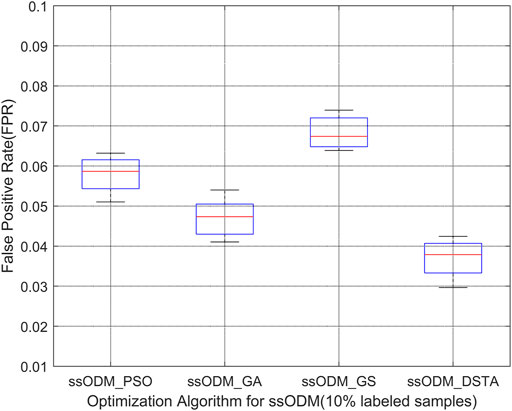
FIGURE 9. Boxplot of FPR of CAN communication fault detection regarding blade 1 servo driver (10% labeled samples).
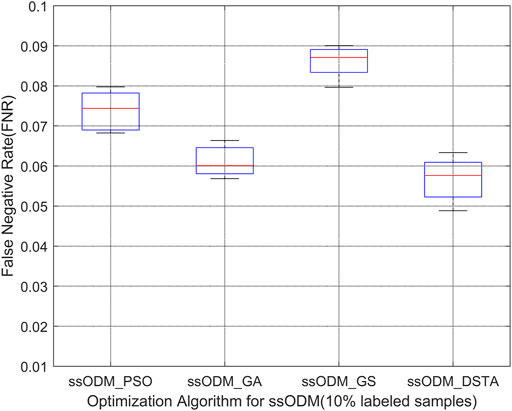
FIGURE 10. Boxplot of FNR of CAN communication fault detection regarding blade 1 servo driver (10% labeled samples).
When the experimental sample was the low-temperature fault of the blade 2 axle box of the pitch, Figures 11, 12 represent the FPR of fault detection and the FNR of fault detection, respectively (5% labeled samples). Figures 13, 14 represent the FPR of fault detection and the FNR of fault detection (10% labeled samples).
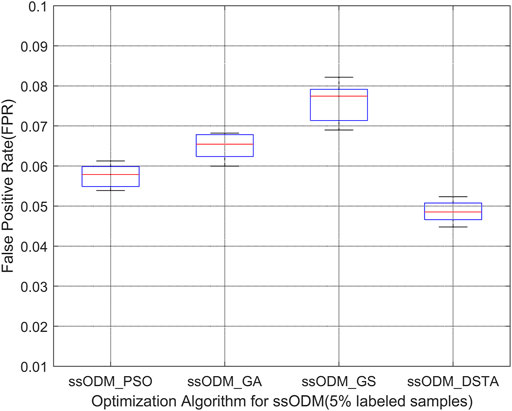
FIGURE 11. Boxplot of FPR of low-temperature fault detection regarding the blade 2 axle box of the pitch (5% labeled samples).
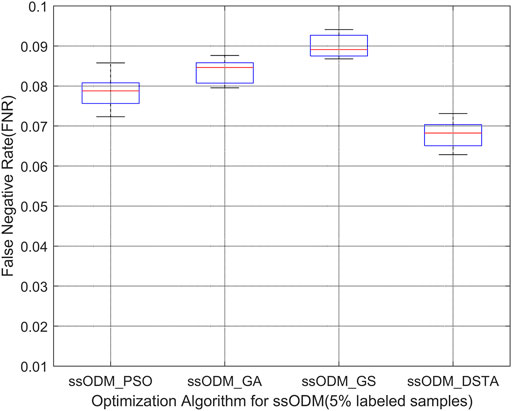
FIGURE 12. Boxplot of FNR of low-temperature fault detection regarding the blade 2 axle box of the pitch (5% labeled samples).
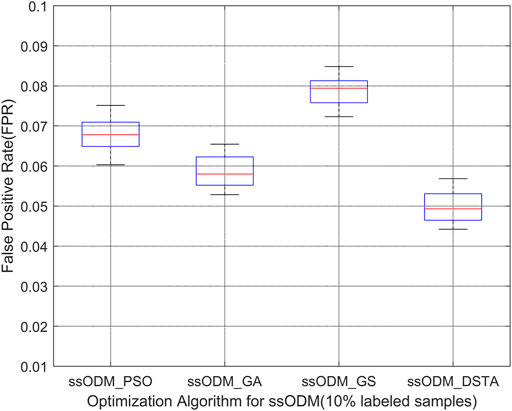
FIGURE 13. Boxplot of FPR of low-temperature fault detection regarding the blade 2 axle box of the pitch h (10% labeled samples).
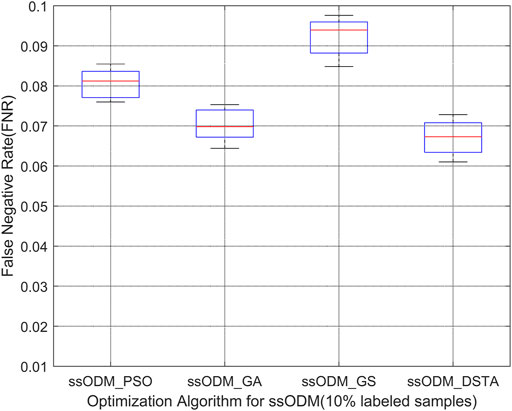
FIGURE 14. Boxplot of FNR of low-temperature fault detection regarding the blade 2 axle box of the pitch h (10% labeled samples).
The above results have demonstrated that the FPR and the FNR of fault detection regarding the faults for the wind turbine pitch system by ssODM-DSTA were the lowest among the four comparison algorithms. It can be concluded that using DSTA to optimize ssODM can obtain super parameters that more meet the performance requirements of the pitch system fault detection model, effectively improve the classification performance of ssODM, and reduce the error of wind turbine pitch system fault detection.
Conclusion
In terms of the problem of obtaining the optimal hyperparameters in the fault detection model of the wind turbine pitch system, the DSTA was used for optimizing the three hyperparameters of ssODM. To verify the effectiveness of this method, ssODM-DSTA was compared with ssODM-PSO, ssODM-GA, and ssODM-GS. The experimental data originated from the three kinds of pitch system fault data preprocessed by the random forest method and Pearson correlation analysis method, including the emergency stop fault data of the pitch system, CAN communication fault data of the blade 1 servo driver, and the low-temperature fault data of the blade 2 axle box of the pitch. The experimental results showed that the ssODM-DSTA had a strong fault detection ability for the fault of the wind turbine pitch system. It was provided with a lower FPR and FNR than those of the model using the other three kinds of parameter optimization algorithms. It was proved that the fault detection method of the wind turbine pitch system based on the ssODM-DSTA had an outstanding performance.
Concerning the wind turbine fault detection based on machine learning, the fault detection model could not be fully learned due to a shortage of labels, seriously affecting the accuracy of fault detection. Consequently, the application of unsupervised learning to wind turbine fault detection could further weaken the weight of labels and reduce the cost of fault detection when compared with supervised learning and semi-supervised learning.
Data Availability Statement
The data analyzed in this study are subject to the following licenses/restrictions: data used to support the findings of this study are currently under embargo while the research findings are commercialized. Requests to access these datasets should be directed to d2h3X3h5QGhidWFzLmVkdS5jbg==.
Author Contributions
All authors listed have made a substantial, direct, and intellectual contribution to the work and approved it for publication.
Funding
This work was supported in part by the National Natural Science Foundation of China (Grant Nos. 62173050 and 61403046), the Natural Science Foundation of Hunan Province, China (Grant No. 2019JJ40304), Changsha University of Science and Technology “The Double First Class University Plan” International Cooperation and Development Project in Scientific Research in 2018 (Grant No. 2018IC14), the Research Foundation of the Education Bureau of Hunan Province (Grant No.19K007), Hunan Provincial Department of Transportation 2018 Science and Technology Progress and Innovation Plan Project (Grant No. 201843), Energy Conservation and Emission Reduction Hunan University Student Innovation and Entrepreneurship Education Center, Innovative Team of Key Technologies of Energy Conservation, Emission Reduction and Intelligent Control for Power-Generating Equipment and System, CSUST, Hubei Superior and Distinctive Discipline Group of Mechatronics and Automobiles (XKQ2021003 and XKQ2021010), Major Fund Project of Technical Innovation in Hubei (Grant No. 2017AAA133), and Guangxi Key Laboratory of Trusted Software (No.201728), Graduate Scientific Research Innovation Project of Changsha University of Science & Technology (No. 2021-89).
Conflict of Interest
The authors declare that the research was conducted in the absence of any commercial or financial relationships that could be construed as a potential conflict of interest.
Publisher’s Note
All claims expressed in this article are solely those of the authors and do not necessarily represent those of their affiliated organizations, or those of the publisher, the editors and the reviewers. Any product that may be evaluated in this article, or claim that may be made by its manufacturer, is not guaranteed or endorsed by the publisher.
References
Blaabjerg, F., and Ke Ma, K. (2013). Future on Power Electronics for Wind Turbine Systems. IEEE J. Emerg. Sel. Top. Power Electron. 1 (3), 139–152. doi:10.1109/JESTPE.2013.2275978
Blaabjerg, F., Liserre, M., and Ma, K. (2012). Power Electronics Converters for Wind Turbine Systems. IEEE Trans. Ind. Applicat. 48 (2), 708–719. doi:10.1109/TIA.2011.2181290
Chavent, M., Genuer, R., and Saracco, J. (2021). Combining Clustering of Variables and Feature Selection Using Random Forests. Commun. Stat. - Simulation Comput. 50 (2), 426–445. doi:10.1080/03610918.2018.1563145
Chen, C., Zhang, Q., Yu, B., Yu, Z., Lawrence, P. J., Ma, Q., et al. (2020). Improving Protein-Protein Interactions Prediction Accuracy Using XGBoost Feature Selection and Stacked Ensemble Classifier. Comput. Biol. Med. 123, 103899. doi:10.1016/j.compbiomed.2020.103899
Chen, X. (2020). Fault Diagnosis of High Power Grid Wind Turbine Based on Particle Swarm Optimization BP Neural Network during COVID-19 Epidemic Period. Ifs 39, 9027–9035. doi:10.3233/JIFS-189301
Chong, Y., Ding, Y., Yan, Q., and Pan, S. (2020). Graph-based Semi-supervised Learning: A Review. Neurocomputing 408, 216–230. doi:10.1016/j.neucom.2019.12.130
Dai, J., Zheng, J., Pan, H., and Pan, Z. (2017). Rolling Bearing Fault Diagnosis Method Based on Composite Multiscale Entropy and Laplacian SVM. Zhongguo Jixie Gongcheng/China Mech. Eng. 28 (11), 1339–1346.
Hu, X., Zhang, H., Ma, D., and Wang, R. (2021). A tnGAN-Based Leak Detection Method for Pipeline Network Considering Incomplete Sensor Data. IEEE Trans. Instrum. Meas. 70, 1–10. doi:10.1109/tim.2020.3045843
Jebli, I., Belouadha, F.-Z., Kabbaj, M. I., and Tilioua, A. (2021). Prediction of Solar Energy Guided by pearson Correlation Using Machine Learning. Energy 224, 120109. doi:10.1016/j.energy.2021.120109
Li, W. (2010). Gear Incipient Fault Diagnosis Using Graph Theory and Transductive Support Vector Machine. Jme 46, 82–88. doi:10.3901/JME.2010.23.082
Liming, S., and Bo, Y. (2020). Nonlinear Robust Fractional-Order Control of Battery/SMES Hybrid Energy Storage Systems. Power Syst. Prot. Control. 48 (22), 76–83.
Long, W., Jiao, J., Liang, X., Wu, T., Xu, M., and Cai, S. (2021a). Pinhole-Imaging-Based Learning Butterfly Optimization Algorithm for Global Optimization and Feature Selection. Appl. Soft Comput. 103, 107146.
Long, W., Wu, T., Xu, M., Tang, M., and Cai, S. (2021b). Parameters Identification of Photovoltaic Models by Using an Enhanced Adaptive Butterfly Optimization Algorithm. Energy 229, 120750.
Malik, H., and Mishra, S. (2017). Artificial Neural Network and Empirical Mode Decomposition Based Imbalance Fault Diagnosis of Wind Turbine Using TurbSim, FAST and Simulink. IET Renew. Power Generation, 11(6). Institution of Engineering and Technology, 889–902. doi:10.1049/iet-rpg.2015.0382
Mao, W., Tian, S., Fan, J., Liang, X., and Safian, A. (2020). Online Detection of Bearing Incipient Fault with Semi-supervised Architecture and Deep Feature Representation. J. Manufacturing Syst. 55, 179–198. doi:10.1016/j.jmsy.2020.03.005
Odofin, S., Bentley, E., and Aikhuele, D. (2018). Robust Fault Estimation for Wind Turbine Energy via Hybrid Systems. Renew. Energ. 120, 289–299. doi:10.1016/j.renene.2017.12.031
Qian, W., and Wang, J. (2020). An Improved Seasonal GM(1,1) Model Based on the HP Filter for Forecasting Wind Power Generation in China. Energy 209, 118499. doi:10.1016/j.energy.2020.118499
Shen, Z., Chen, X., Zhang, X., and He, Z. (2012). A Novel Intelligent Gear Fault Diagnosis Model Based on EMD and Multi-Class TSVM. Measurement 45, 30–40. doi:10.1016/j.measurement.2011.10.008
Song, D., Chang, Q., Zheng, S., Yang, S., Yang, J., and Hoon Joo, Y. (2021). Adaptive Model Predictive Control for Yaw System of Variable-Speed Wind Turbines. J. Mod. Power Syst. Clean Energ. 9 (1), 219–224. doi:10.35833/MPCE.2019.000467
Sun, Q., Han, R., Zhang, H., Zhou, J., and Guerrero, J. M. (2015). A Multiagent-Based Consensus Algorithm for Distributed Coordinated Control of Distributed Generators in the Energy Internet. IEEE Trans. Smart Grid 6 (6), 3006–3019. doi:10.1109/TSG.2015.2412779
Tan, Z. H., Tan, P., Jiang, Y., and Zhou, Z. H. (2020). Multi-label Optimal Margin Distribution Machine. Mach Learn. 109 (3), 623–642. doi:10.1007/s10994-019-05837-8
Tang, M., Chen, Y., Wu, H., Zhao, Q., Long, W., Sheng, V. S., et al. (2021). Cost-Sensitive Extremely Randomized Trees Algorithm for Online Fault Detection of Wind Turbine Generators. Front. Energ. Res. 9 (234). doi:10.3389/fenrg.2021.686616
Tang, M., Ding, S. X., Yang, C., Cheng, F., Shardt, Y. A. W., Long, W., et al. (2019). Cost-sensitive Large Margin Distribution Machine for Fault Detection of Wind Turbines. Cluster Comput. 22 (3), 7525–7537. doi:10.1007/s10586-018-1854-3
Tang, M., Zhao, Q., Ding, S. X., Wu, H., Li, L., Long, W., et al. (2020). An Improved LightGBM Algorithm for Online Fault Detection of Wind Turbine Gearboxes. Energies 13, 807. doi:10.3390/en13040807
Tang, S., Yuan, S., and Zhu, Y. (2020). Data Preprocessing Techniques in Convolutional Neural Network Based on Fault Diagnosis towards Rotating Machinery. IEEE Access 8, 149487–149496. doi:10.1109/ACCESS.2020.3012182
Tuerxun, W., Chang, X., Hongyu, G., Zhijie, J., and Huajian, Z. (2021). Fault Diagnosis of Wind Turbines Based on a Support Vector Machine Optimized by the Sparrow Search Algorithm. IEEE Access 9, 69307–69315. doi:10.1109/ACCESS.2021.3075547
Wang, R., Sun, Q., Hu, W., Li, Y., Ma, D., and Wang, P. (2021). SoC-Based Droop Coefficients Stability Region Analysis of the Battery for Stand-Alone Supply Systems with Constant Power Loads. IEEE Trans. Power Electron. 36 (7), 7866–7879. doi:10.1109/TPEL.2021.3049241
Xi, L., Wu, J., Xu, Y., and Sun, H. (2021). Automatic Generation Control Based on Multiple Neural Networks With Actor-Critic Strategy. IEEE Trans. Neural Netw. Learn. Syst. 32 (6), 2483–2493. doi:10.1109/TNNLS.2020.3006080
Yang, J., Fang, L., Song, D., Su, M., Yang, X., Huang, L., et al. (2021). Review of Control Strategy of Large Horizontal‐axis Wind Turbines Yaw System. Wind Energy 24 (2), 97–115. doi:10.1002/we.2564
Yao, L., Fang, Z., Xiao, Y., Hou, J., and Fu, Z. (2021). An Intelligent Fault Diagnosis Method for Lithium Battery Systems Based on Grid Search Support Vector Machine. Energy 214, 118866. doi:10.1016/j.energy.2020.118866
Yuan, Z., Zhou, T., Liu, J., Zhang, C., and Liu, Y. (2021). Fault Diagnosis Approach for Rotating Machinery Based on Feature Importance Ranking and Selection. Shock and Vibration 2021, 1–17. doi:10.1155/2021/8899188
Zhang, L., Ji, S., Gu, S., Huang, X., Palmer, J. E., Giewont, W., et al. (2021). Design Considerations for High-Voltage Insulated Gate Drive Power Supply for 10-kV SiC MOSFET Applied in Medium-Voltage Converter. IEEE Trans. Ind. Electron. 68 (7), 5712–5724. doi:10.1109/TIE.2020.3000131
Zhang, L., and Ruan, X. (2019). Control Schemes for Reducing Second Harmonic Current in Two-Stage Single-phase Converter: An Overview from DC-Bus Port-Impedance Characteristics. IEEE Trans. Power Electron. 34 (10), 10341–10358. doi:10.1109/TPEL.2019.2894647
Zhang, T., and Zhou, Z.. (2018). “Semi-Supervised Optimal Margin Distribution Machines,” in Proceedings of the Twenty-Seventh International Joint Conference on Artificial Intelligence; 2018; Stockholm, Sweden; 3104–3110. doi:10.24963/ijcai.2018/431
Zhang, T., and Zhou, Z.-H. (2014). “Large Margin Distribution Machine,” in Proceedings of the 20th ACM SIGKDD international conference on Knowledge discovery and data mining, New York, USA (New York, NY, United States: Association for Computing Machinery), 313–322. doi:10.1145/2623330.2623710
Zhang, X., Han, P., Xu, L., Zhang, F., Wang, Y., and Gao, L. (2020). Research on Bearing Fault Diagnosis of Wind Turbine Gearbox Based on 1DCNN-PSO-SVM. IEEE Access 8, 192248–192258. doi:10.1109/ACCESS.2020.3032719
Zhang, Y., and Sheng, R. (2021). Fault Diagnosis Method of Mine Motor Based on Support Vector Machine. Eng 14 (3), 508–514. doi:10.2174/1872212113666191121122720
Zhang, Y., Zheng, H., Liu, J., Zhao, J., and Sun, P. (2018). An Anomaly Identification Model for Wind Turbine State Parameters. J. Clean. Prod. 195, 1214–1227. doi:10.1016/j.jclepro.2018.05.126
Zhang, Z.-Y., and Wang, K.-S. (2014). Wind Turbine Fault Detection Based on SCADA Data Analysis Using ANN. Adv. Manuf. 2 (1), 70–78. doi:10.1007/s40436-014-0061-6
Zhao, H., Gao, Y., Liu, H., and Li, L. (2019). Fault Diagnosis of Wind Turbine Bearing Based on Stochastic Subspace Identification and Multi-Kernel Support Vector Machine. J. Mod. Power Syst. Clean. Energ. 7 (2), 350–356. doi:10.1007/s40565-018-0402-8
Zhou, X., Shi, P., Lim, C.-C., Yang, C., and Gui, W. (2018). A Dynamic State Transition Algorithm with Application to Sensor Network Localization. Neurocomputing 273 (17), 237–250. doi:10.1016/j.neucom.2017.08.010
Keywords: fault detection, wind turbine, pitch system, dynamic state transition algorithm, semi-supervised optimal margin distribution machine, random forest
Citation: Tang M, Hu J, Wu H and Wang Z (2021) Wind Turbine Pitch System Fault Detection Using ssODM-DSTA. Front. Energy Res. 9:750983. doi: 10.3389/fenrg.2021.750983
Received: 31 July 2021; Accepted: 17 August 2021;
Published: 20 October 2021.
Edited by:
Qiuye Sun, Northeastern University, ChinaReviewed by:
Xuguang Hu, Northeastern University, ChinaFranklin Chang, Nanyang Technological University, Singapore
Copyright © 2021 Tang, Hu, Wu and Wang. This is an open-access article distributed under the terms of the Creative Commons Attribution License (CC BY). The use, distribution or reproduction in other forums is permitted, provided the original author(s) and the copyright owner(s) are credited and that the original publication in this journal is cited, in accordance with accepted academic practice. No use, distribution or reproduction is permitted which does not comply with these terms.
*Correspondence: Huawei Wu, d2h3X3h5QGhidWFzLmVkdS5jbg==
†These authors have contributed equally to this work