 Jiashen Tian
 Ryan J. Milcarek
- School for Engineering of Matter, Transport and Energy, Arizona State University, Tempe, AZ, United States
The solid oxide fuel cell (SOFC) nickel-yttria stabilized zirconia (Ni-YSZ) anode degradation due to different types of siloxane contamination is investigated. A cyclic structure siloxane, octamethylcyclotetrasiloxane (D4), and a linear structure siloxane, decamethyltetrasiloxane (L4), are mixed with H2+N2 as the fuel for SOFCs at 750°C. The electrochemical characterization results after stability experiments suggest that the SOFC contaminated with cyclic siloxane, D4, had higher degradation. Pure YSZ pellets with different surface hydroxylation extents were also tested to investigate the D4/L4 adsorption and deposition process. Postmortem SEM/WDS, XRD and Raman analysis all indicate that cyclic siloxane has more deposition than linear siloxane on the anode. Further analysis demonstrates that high adsorption and low desorption rates of cyclic siloxane on YSZ are linked to the degradation. Besides the silicon deposition, SiC and amorphous carbon deposition were also observed from the XRD and Raman analysis.
Introduction
Biogas is generated during the natural degradation of organic material by microorganisms under anaerobic conditions. Wastewater treatment plants utilize the anaerobic digestion process converting organic material in wastewater to biogas. Similarly, the organic composition of the solid waste in landfills decomposes to produce biogas (Park and Shin, 2001). The biogas collected from wastewater treatment plants and landfills is considered a renewable fuel that could be used to produce electricity, heat or as vehicle fuel (Scarlat et al., 2018). Biogas from organic waste digesters usually contains from 60 to 70% methane, from 30 to 40% carbon dioxide and <1% nitrogen. In landfills, methane concentration is usually from 45 to 55%, carbon dioxide from 30 to 40% and nitrogen from 5 to 15% (Jonsson et al., 1997). Generally, biogas also contains impurities such as hydrogen sulfide, siloxanes, aromatics and halogenated compounds. The concentration of the main impurities’ are 0.005–2 vol% hydrogen sulfide, 0–0.02 vol% siloxanes, <1 vol% ammonia, and <0.6 vol% halogenated compounds (Ryckebosch et al., 2011).
Prime movers, as a source of motive power, can be used to convert biogas to useful work. Gas turbines, micro-turbines, reciprocating internal combustion engines and Stirling engines are common prime movers utilized extensively (Riley et al., 2020). Solid oxide fuel cells (SOFCs) are an alternative prime mover that can utilize biogas, the use of which results in higher electrical efficiency, reduced NOx and lower carbon emissions (Rillo et al., 2017; Gandiglio et al., 2020). Despite potential for direct use of biogas, challenges remain with impurities like hydrogen sulfide and siloxanes. These impurities, even at low concentrations, can potentially damage the prime movers which becomes the main barrier for biogas applications (Papurello et al., 2014; Papurello et al., 2016).
Utilizing biogas directly without purification causes serious damage to prime movers after long-term operation. Among the impurities, H2S contamination causes temporary and permanent performance degradation of SOFCs. SOFC degradation due to H2S contamination was studied extensively at different temperatures, operating current/voltage, operating time and H2S concentration (0.02–240 ppm) (Rasmussen and Hagen, 2009). In comparison, research on siloxane, which has been reported as the main impurity causing failure of common prime movers (Trendewicz and Braun, 2013), has not received as much attention. There are many different kinds of siloxane that exist in biogas and they can be sorted based on cyclic or linear structure. Cyclic siloxanes are designated by a “D” for cyclic structure and a number indicating how many silicon atoms per molecule. Hexamethylcyclotrisiloxane (D3), Octamethylcyclotetrasiloxane (D4) and Decamethylcyclopentasiloxane (D5) are the cyclic structure siloxanes typically found in biogas with the highest concentration. Linear siloxanes are designated by a “L” for linear structure and a number indicating how many silicon atoms per molecule. For linear siloxanes, trace levels of hexamethyldisiloxane (L2), octamethyltrisiloxane (L3) and decamethyltetrasiloxane (L4) can be detected in biogas (Rücker and Kümmerer, 2015).
The concentration of each type of siloxane in biogas from wastewater treatment plants differs significantly. For example, smaller molecule siloxane, like D3, L3, and L2, can only exist in a limited amount because of high volatility which leads to vaporization prior to the anaerobic digester. There are also only small amounts of larger siloxane, such as D6, in biogas due to low volatility and low partial pressure in the active sludge (Dewil et al., 2007). As a result, cyclic siloxanes D5 and D4, which have stable molecular structure, typically have higher concentration and thus are often selected to represent all siloxanes in biogas for SOFCs contamination studies. For example, Haga et al. (2008) reported fatal degradation of the Ni/ScSZ anode SOFC due to 10 ppm D5 contamination in 30–50 h. In that study, the authors also hypothesized a two-step siloxane deposition reaction shown in Eqs 1, 2 resulting in siloxane conversion to silicon dioxide (Haga et al., 2008).
Similar to the study by K. Haga et al., Kikuchi et al. (2017) also tested the Ni/ScSZ anode SOFC with the 60 ppm D5 as the impurity. After a 100 h experiment, significant SOFC degradation was observed. Madi et al. (2015b), Madi et al. (2015a) reported 50% degradation (voltage decrease at constant current density) per 1,000 h for a SOFC with Ni/YSZ anode utilizing simulated reformed biogas mixed with ppm level D4. Furthermore, Papurello and Lanzini (2018) reported that even ppb level D4 could cause obvious degradation of an SOFC with Ni/YSZ anode after 50 h operation. The author’s recent work (Tian and Milcarek, 2020; Tian and Milcarek, 2021) reported significant Ni/YSZ anode SOFC degradation with ppm level D4 contamination in different fuel compositions. Besides silicon deposition, carbon deposition was observed and hypothesized to be an essential factor causing SOFC performance degradation.
The previous studies only focus on SOFC degradation due to cyclic siloxanes instead of linear siloxanes. This is due to the higher concentration of cyclic siloxanes (D4 and D5) and the fact that linear siloxanes are considered to be decomposed easier than cyclic structure in the digester due to instability. However, the concentration of smaller linear siloxanes in landfill gas are comparable or can be higher than cyclic siloxanes such as D4 and D5 (Lu et al., 2011; Wang et al., 2020). For biogas from a wastewater treatment plant, siloxane concentration is also influenced by multiple factors such as digester type, location, and season. In some cases, high concentrations of linear structure siloxanes were also reported (Lanzini et al., 2017). To improve the utilization of biogas from landfill and wastewater treatment plants, investigation of SOFC degradation due to linear siloxane contamination is necessary.
In this study, linear structure siloxane, L4, was selected as the contamination source and is compared with a cyclic siloxane, D4. L4 and D4 were chosen as they have different structure, but the same number of silicon atoms per molecule of siloxane. Stability tests are conducted to compare SOFC degradation and contamination on YSZ pellets. The experimental results of D4/L4 were analyzed and compared to reveal the mechanism of the SOFC degradation due to different siloxane contamination.
Experimental Setup
Fuel Cell and Pellets Fabrication and Experimental Setup
The SOFCs were fabricated with LSCF [(La0.60Sr0.40)0.95Co0.20Fe0.80O3-x, Fuelcellmaterials] + SDC (Sm0.20Ce0.80O2-X, mid grade powder, Fuelcellmaterials) cathode (7:3 w/w), SDC buffer layer, YSZ [(Y2O3)0.08(ZrO2)0.92, spray dried grade powder, Fuelcellmaterials] electrolyte and NiO (standard grade powder, Fuelcellmaterials) + YSZ anode (60:40 w/w). NiO/YSZ was dry pressed and pre-fired (final thickness of 380 μm). The YSZ electrolyte and SDC buffer layers were sprayed on the surface of NiO/YSZ green body and sintered at 1,400°C with ∼10 and ∼3 μm thickness, respectively. LSCF + SDC cathode was hand sprayed on the SDC buffer layer and sintered at 1,100°C (final thickness ∼17 μm). More details about the fabrication method can be found in previous literature (Tian and Milcarek, 2020). YSZ pellets (380 μm thick) were also dry pressed and sintered to investigate the siloxane degradation mechanism.
Figure 1 shows the experimental setup which was built for investigating the influence of the type of siloxane (cyclic or linear) contamination on the Ni-YSZ SOFC anode. According to previous work (Tian and Milcarek, 2020), dry fuel mixed with siloxane can increase SOFC performance degradation compared to adding H2O. As a result, for the SOFC test, H2 (ultra high purity grade, Airgas) + N2 (ultra high purity grade, Airgas) +siloxane was selected as the fuel. To regulate the flow of H2, N2, L4 and D4, Brooks Delta II smart mass flow controllers (MFCs) with LabView interface were utilized. The H2 flow rate was fixed at 7 standard cubic centimeters per minute (sccm). The certified D4 (5.358 ppmv, Airgas) and L4 (5.034 ppmv, Airgas) cylinders balanced with N2 were mixed with research grade N2 to fix the concentration of D4 and L4 to 2.5 ppm. The total gas flow rate to the anode was 20 sccm for all experiments. For YSZ pellet experiments, which included tests with steam, water was delivered by a syringe pump (PumpSystems Inc.). Resistive heaters wrapped on the fuel delivery pipe were used to vaporize the deionized water and maintain vapor phase. To ensure the steam remained in vapor phase, T-type thermocouples (Omega) were mounted on the pipe to monitor the temperature. Air was delivered to the cathode through the vertical furnace by natural convection.
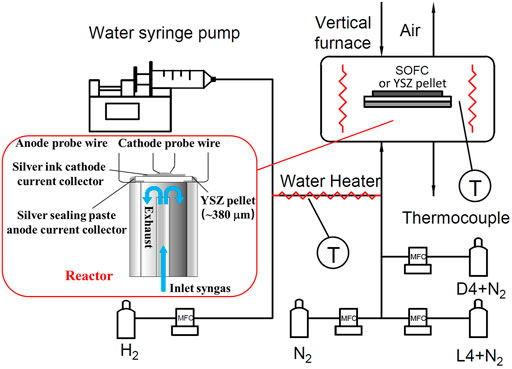
FIGURE 1. Schematic of experiment setup.
Based on previous siloxane deposition studies (Finocchio et al., 2008; Vaiss et al., 2020), siloxanes prefer to chemisorb on metal oxide surfaces, like γ-Al2O3, due to reactions with hydroxyl groups present. As a result, YSZ grains are hypothesized as one of the locations where siloxane deposits initially in the Ni-YSZ anode. To test this theory, siloxane (L4/D4) deposition on a YSZ pellet was conducted. To control the amount of hydroxyl groups on the YSZ pellet surface, different gas compositions were chosen for L4 and D4 contamination studies. The details of these experimental conditions are show in Table 1. In order to remove hydroxyl groups present on the surface of YSZ pellets before the experiment, the pellets were heated to 850°C and maintained at that temperature for 1 h with 20 sccm pure N2 on the bottom side.
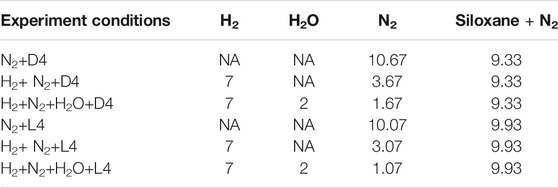
TABLE 1. Flow rate (sccm) of anode side gases supplied to YSZ pellet during different experiments.
For the SOFC and YSZ pellet experiments, the SOFCs (or pellets) were sealed on a quartz tube with silver paste. The cathode (or the cathode side of the pellet surface) was printed with silver ink as the current collector with an active area of 0.712 cm2. Silver wires connected with the anode and cathode were utilized for the electrochemical characterization. The operating temperature was fixed at 750°C with 5°C per minute heating rate for all experiments.
Characterization Methods
In order to evaluate the performance degradation of SOFCs under L4 and D4 contamination, the fuel cells’ polarization (I-V) curves were acquired by a digital SourceMeter (Keithley 2460) interfaced with LabView on the computer with four-probe technique. The electrochemical characterization of the entire SOFC and YSZ pellets were conducted by electrochemical impedance spectroscopy (EIS). The impedance spectra were obtained by an Electrochemical Impedance Analyzer (Solartron Analytical Energylab XM) with ac amplitude of 10 mV and a frequency range of 106 Hz–0.1 Hz. The distribution of relaxation time (DRT) method was utilized to analyze EIS data by a MATLAB GUI program (DRTtools) (Ciucci and Chen, 2015; Wan et al., 2015; Effat and Ciucci, 2017). The regularization parameter is selected as 10−3 for DRT calculation.
Several techniques were used to characterize the morphology and composition of the silicon containing deposits. The morphologies of L4 and D4 deposition under different experimental conditions on YSZ pellets were conducted by a field emission scanning electron microscope (FESEM, JEOL JXA-8530F electron microprobe) equipped with an energy-dispersive spectrometer (EDS) and wavelength-dispersive spectrometer (WDS). As the Y and Si signals are not well separated with EDS, WDS was utilized to obtain the elemental analysis of the sample. To determine the L4 and D4 deposition compositions on the YSZ pellets, X-ray diffractometer (XRD) system was utilized for the deposition crystalline structure characterization. The XRD patterns were obtained using the X-ray diffractometer (PANalytical X’ Pert Pro MRD) with a Cu Kα (K-Alpha2/K-Alpha2 = 0.5) radiation source. To obtain more composition information for the L4 and D4 deposition on the YSZ pellets, Raman test was conducted on an Acton 300i spectrograph and a back thinned Princeton Instruments liquid nitrogen cooled CCD detector with a 532 nm laser as excitation source. The power was kept at 6 mW.
Results
SOFC Degradation due to Siloxane Contamination
As shown in Figure 2A, the polarization curves of the SOFC after 20 and 40 h D4 contamination are compared with the initial fuel cell performance after intrinsic degradation. In order to eliminate the influence of SOFCs’ intrinsic degradation, the SOFCs have been operated with clean fuel for 48 h. This data provides a useful reference for the SOFC degradation without siloxane contamination, as shown in Table 2. After 20 h D4 contamination, the maximum power density of the fuel cell decreased from 211.5 to 205.1 mW cm2. In comparison, the maximum power density of the fuel cell during the next 20 h (40 h total contamination) decreased to 183.16 mW cm2 from 205.1 mW cm2. A similar trend of degradation was also observed in the EIS results. The obvious impedance increase after D4 contamination can be noticed from Figure 2C. DRT analysis was conducted to identify the characteristic distribution of the SOFC EIS results. Among the five main discrete peaks (P1∼P5) in Figure 2B, P1 and P2 (0.1–1 Hz) at low frequency are considered as the gas diffusion process for the cathode, based on previous DRT analysis (Tian and Milcarek, 2021). P3 and P4 at medium frequency (1 Hz–10 kHz) are related to the gas diffusion process for the anode. P5 (>10 kHz) at high frequency is attributed to charge transfer. With minor change of cathode and charge transfer process (P1, P2, P5), the main performance degradation of the SOFC results from anode processes (P3 and P4) (Caliandro et al., 2019; Hong et al., 2020; Sumi et al., 2020).
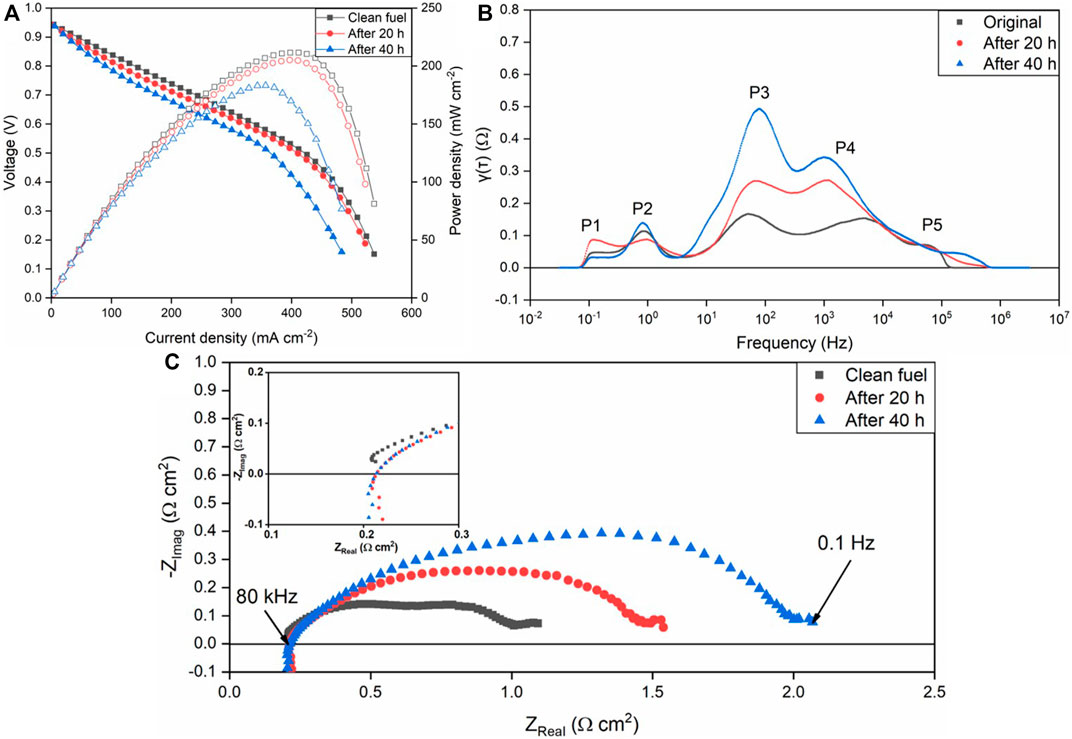
FIGURE 2. Performance degradation of the SOFC due to D4 contamination with H2+N2+D4 as the fuel at 750°C. (A) polarization curve; (B) EIS measurements; (C) DRT plot.
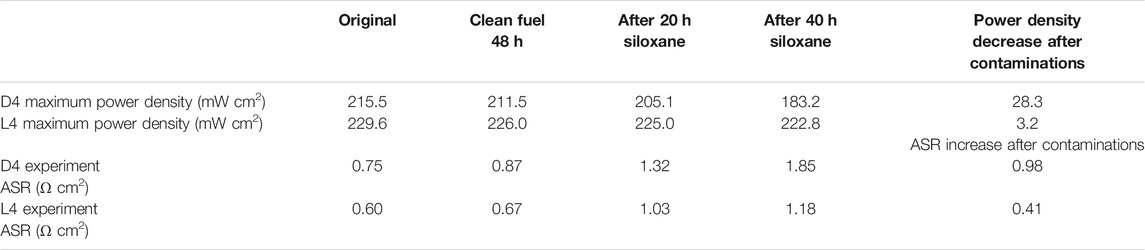
TABLE 2. Maximum power density decrease and increase in area specific resistance (ASR) calculated from characterization results.
The electrochemical characterization results for the L4 contamination experiment are shown in Figure 3. The obvious degradation rate difference from D4 and L4 can be observed from power density and EIS results after 40 h in Figure 3. From Figure 3A, no obvious degradation can be found in the polarization curve. From the EIS results in Figure 3C, a relatively small impedance increase is observed. Similar to the DRT results from D4 contamination, L4 contamination results also illustrate the main degradation occurred in anode process as shown by P3 and P4 increase. More details comparing L4 versus D4 results are shown in Table 2. From the results of Table 2, which show power density change and area specific resistance (ASR) increase, the SOFC under L4 contamination has noticeably less degradation than with D4 contamination. Although SOFCs with the same fabrication process and materials were utilized, the EIS and polarization results before D4/L4 contamination are also slightly different. In this situation, there are some experimental setup factors that may influence the results such as current collector coating, wires, sealing, etc. Considering the appearance of inductance in one data set one possibility is that the wires, which can introduce distortion by inductance, may play a part in this process, which has been reported before (Nielsen and Hjelm, 2014).
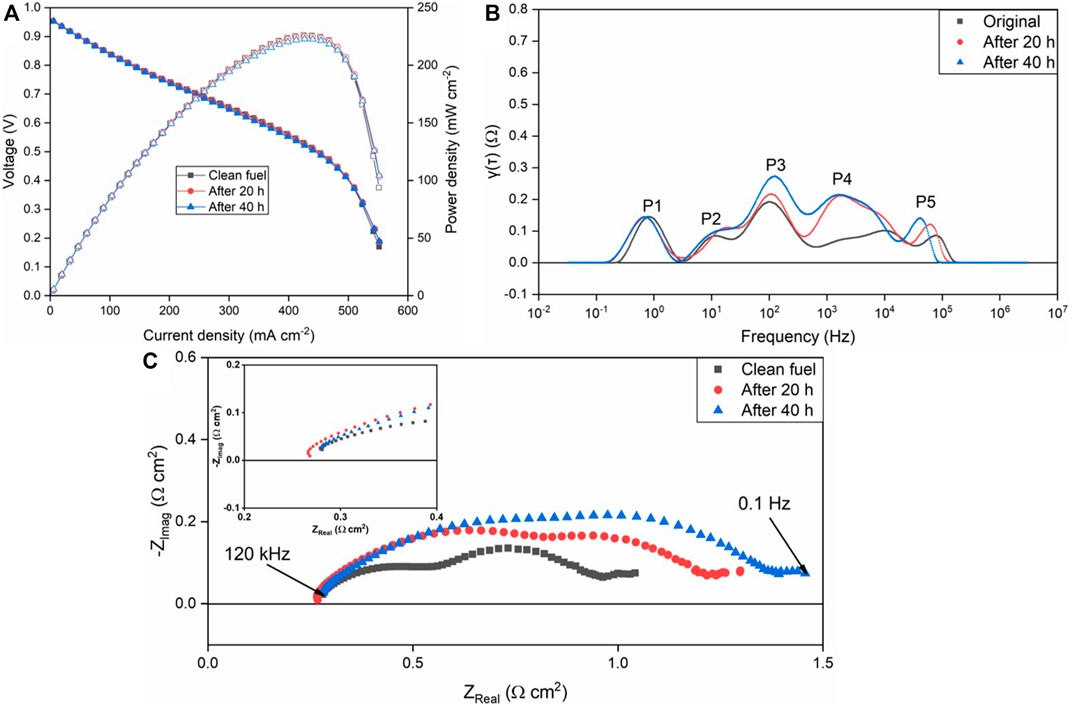
FIGURE 3. Performance degradation of the SOFC due to L4 contamination with H2+N2+L4 as the fuel at 750°C. (A) polarization curve; (B) EIS measurements; (C) DRT plot.
Pellet Degradation due to Siloxane Contamination
Figure 4 shows photos of the YSZ pellets after the D4/L4 exposure experiments. The mechanical damage of SOFCs occurred during the dismounting process from the silver sealing. As shown, the color of pellets, under certain conditions, has been converted from white (clean YSZ) to yellow/brown which indicates the deposition of siloxanes. Generally, the experiments with D4 as impurity had more deposition compared with L4. The siloxane deposition for the experiments with wet fuel (H2+H2O + siloxane) was larger than the experiments with dry fuel (H2+ siloxane, N2+ siloxane). Furthermore, some details shown in the photos should also be highlighted. For L4 contamination experiments, besides the test involving H2O mixed with the fuel, there is little siloxane deposition on the YSZ pellets’ surface. However, after adding H2O, significant deposition was observed. For N2+D4 experiment, there is no obvious deposition that can be noticed in the center of the pellet. However, siloxane was deposited on the edge of the pellet near the silver sealing/current collector.
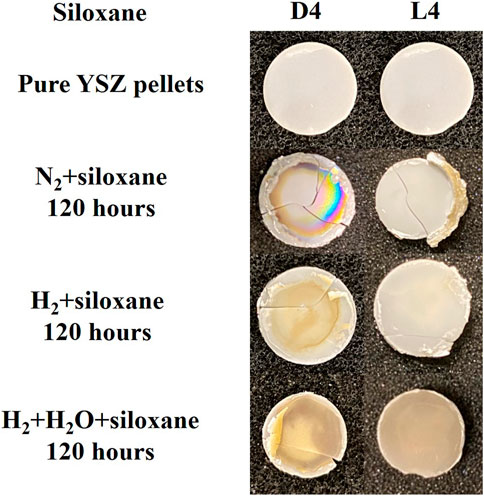
FIGURE 4. Figures of YSZ pellets after siloxane deposition experiments.
The morphology and elemental mapping of YSZ pellets were investigated after the contamination test utilizing SEM and WDS. Figure 5 shows the WDS map of the Zr, O and Si elements on the surface of the YSZ pellets under the H2+N2+D4/L4 conditions. As shown in Figure 5B, which shows the surface after L4 contamination, the fine YSZ grains and grain boundaries can be observed and there is no obvious silicon deposition. In comparison the sphere shape depositions (in Figure 5A) whose diameters are around 1 μm completely covered the surface of the YSZ pellet after D4 contamination experiment. Thus, the clear grains and grain boundaries shown in Figure 5B cannot be detected. The presence of strong overlapping signals of Si and O was observed with WDS elements mapping, indicating silicon dioxide formation in the H2+N2+D4 experiment.
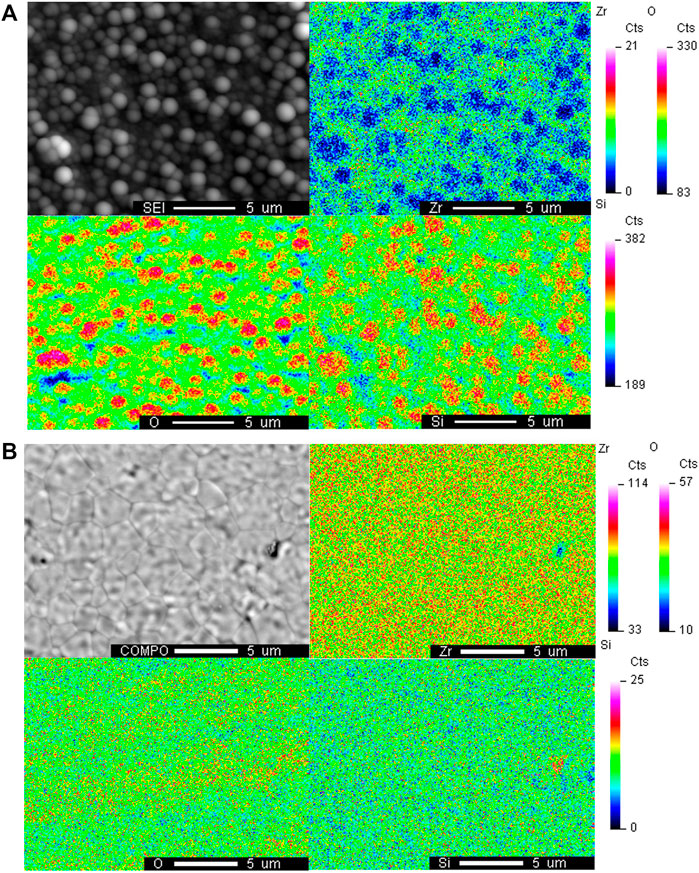
FIGURE 5. WDS elemental mapping of the surface of YSZ pellet with H2+N2+siloxane contamination after (A) D4 contamination and (B) L4 contamination at 750°C.
For the H2+N2+H2O+D4/L4 experiments, generally, heavier siloxane deposition can be noticed than the H2+N2+D4/L4 experiments. Similar to the H2+N2+D4 experiment, overlapping silicon and oxygen signals can also be found in element mapping for H2+N2+H2O+D4 experiment in Figure 6A which indicates the composition is silicon dioxide. Compared with the regular sphere deposition observed in Figure 5A, irregular or less structured deposition was formed with wet fuel likely due to more total deposition on the surface. For the H2+N2+H2O+L4 experiment, also like the dry fuel experiments, less total deposition was observed than the D4 experiment. In Figure 6B, the surface grain boundaries of YSZ can be detected. Silicon deposition was observed after the H2+N2+H2O+L4 experiment primarily at the grain boundaries where small Si/O deposits initiate.
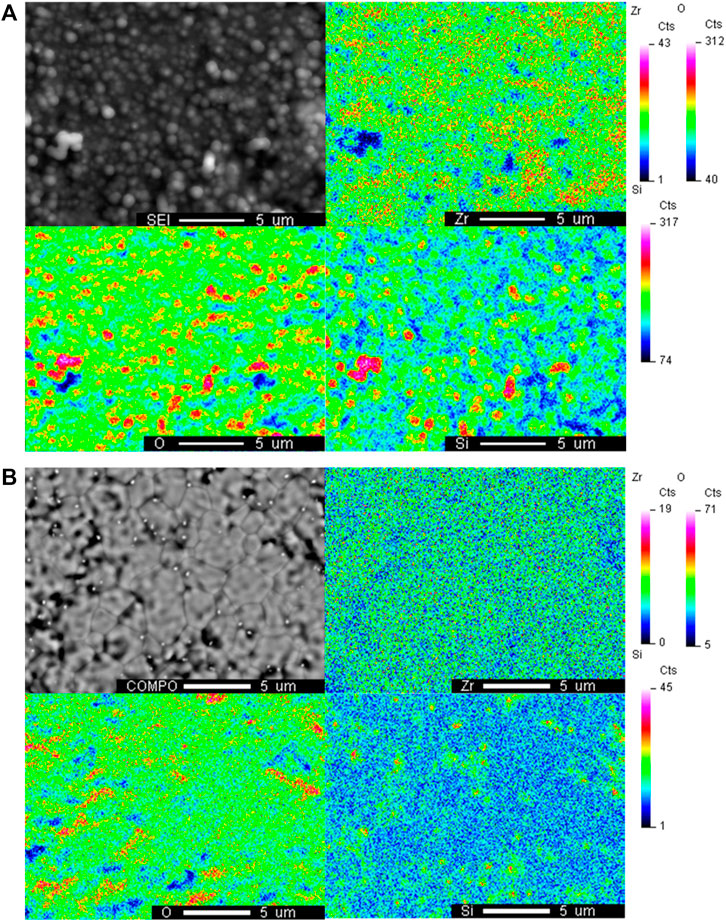
FIGURE 6. WDS elemental mapping of the surface of YSZ pellet with H2+ H2O+N2+siloxane comtamination after (A) D4 contamination and (B) L4 contamination at 750°C.
Figure 7 shows the XRD pattern of the YSZ pellet before and after exposure to the fuel which was composed of H2+N2+H2O+D4. New peaks appearing at 38.2°, 44.4°, 64.6°, and 77.5° (2θ) were found after contamination, which indicate siloxane deposition. Based on the Si, C and O present in siloxane, the deposition corresponding to the peaks can be attributed to both cubic crystal structure SiO2 (melanophlogite, PDF#01-080-4051) and silicon carbide SiC (3C-SiC, PDF#00-049-1623).
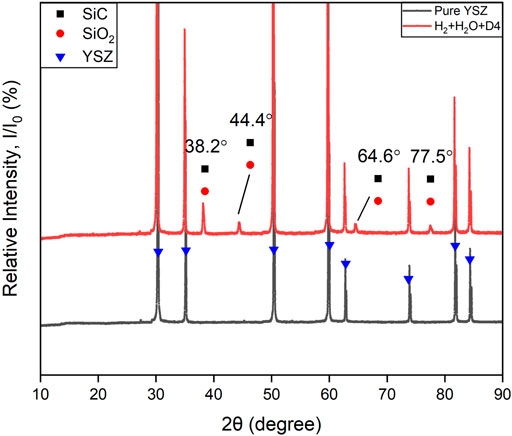
FIGURE 7. XRD patterns of the YSZ pellet bottom surface (fuel inlet side). Black color line: Pure YSZ sample. Red line: after 96 h H2+N2+H2O+D4 experiment at 750°C.
According to the observed extent of deposition on the YSZ pellets in Figure 4 and SEM/WDS analysis, the deposition from L4 was much less compared with D4. Similar trends can also be found in the XRD result for the H2+N2+H2O+L4 experiment. In Figure 8, much weaker deposition peaks are observed at 23.1°, 36°, 43.2°, 48.6° and 57.2° (2θ) in the pattern. They correspond to a hexagonal crystal structure SiC (moissanite-18H, PDF#01-089-2217), a tetragonal structure SiO2 (α-cristobalite, PDF#04-018-0233) and a cubic crystal structure SiO2 (melanophlogite, PDF#01-080-4051). For the two different polymorphs of SiO2, melanophlogite, which is always correlated to organic matter decomposition, can exist steadily under 800°C (Skinner and Appleman, 1963). The α-cristobalite may originate from β-cristobalite after cooling below 250°C from high temperature at ambient pressure (Downs and Palmer, 1994). These two kinds of polymorphs of SiO2 can exist together as a result of the siloxane deposition.
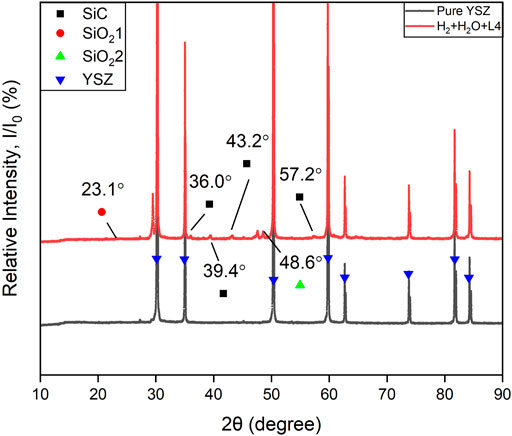
FIGURE 8. XRD patterns of the YSZ pellet bottom surface (fuel inlet side). Black color line: Pure YSZ sample. Red line: after 96 h H2+N2+H2O+L4 experiment at 750°C.
There is a comparatively strong peak at 2θ = 29.4° in Figure 8. Considering its relative signal strength and the position, which is very close to the main peak of YSZ, it may be a result of the Zr, Y, O ratio change in the surface of YSZ pellet. There is also an unlabelled weak peak around 27° in both Figure 7 and Figure 8. Considering the presence of this peak before and after siloxane contamination and without significant increase from the patterns, it should not be associated with the siloxane deposition process. It may originate from secondary peaks of main components or noise.
Figure 9A shows postmortem Raman spectra from the YSZ pellets after 120 h D4 contamination with H2+N2+H2O as fuel. For poly-aromatic hydrocarbons the appearance of D and G peaks in Raman spectroscopy are common. D peak originates from the breathing modes of sp2 atoms in rings. The G peak is generated by all pairs of sp2 atoms bond stretching in both rings and chains (Ferrari, 2007). Compared with the pure YSZ pellet without D4 contamination, emergence of G peak observed in all sp2 carbon systems near 1,600 cm−1 and D peak around 1,350 cm−1 both indicate the presence of amorphous carbon deposition after exposure to D4 contamination. Besides the strong amorphous carbon signal, some weaker peaks corresponding to different chemical groups were observed as shown in Figure 9B. Methyl/methylene (CHx) group vibrational bands can be noticed at 2,911 cm−1. SiHx, (-C=C-)n groups can be observed at 1948 and 2,306 cm−1. The secondary order D peak 2D can also be found at 2,673 cm−1 (Jerng et al., 2011; Yu et al., 2013; Bouhamed, 2017).
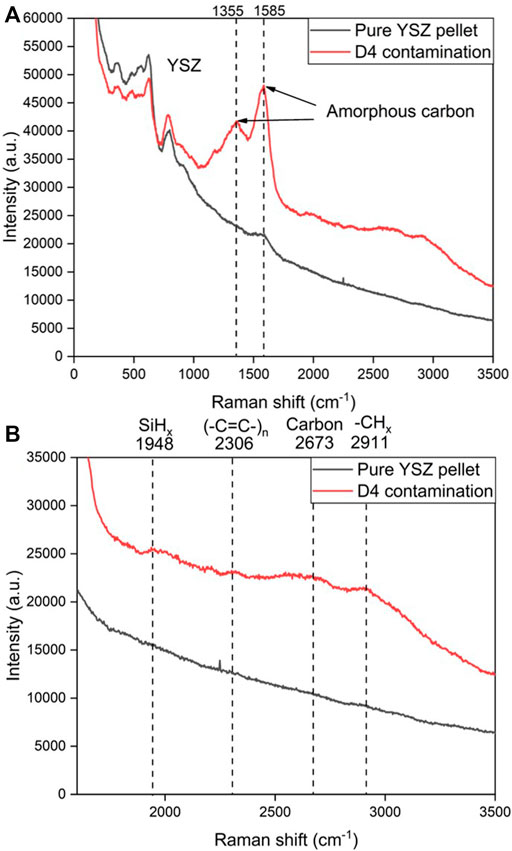
FIGURE 9. Postmortem Raman spectra acquired from the YSZ pellet after 120 h D4 contamination at 750°C vs. pure YSZ pellet spectra. (A) Entire Raman spectra; (B) Raman spectra ranges from 2000 to 3,500 cm−1.
In Figure 10, Raman spectra have been obtained from the YSZ pellet surface exposed to H2+N2+H2O+L4 fuel. Besides YSZ, no strong signals like observed in Figure 9A, were detected. This also confirms the trend that D4 contamination has more deposition than L4. The band at 1,604 and 2,774 cm−1 are attributed to carbon deposition. Similarly in Figure 9B, the (-C=C-)n groups can be also found at 2,231 cm−1. For the silicon deposition, Si-OH bond can be observed at 1,000 cm−1 (da Silva et al., 2006; Lanzini et al., 2017). These results are important because they emphasize the role of carbon deposition in the siloxane deposition process.
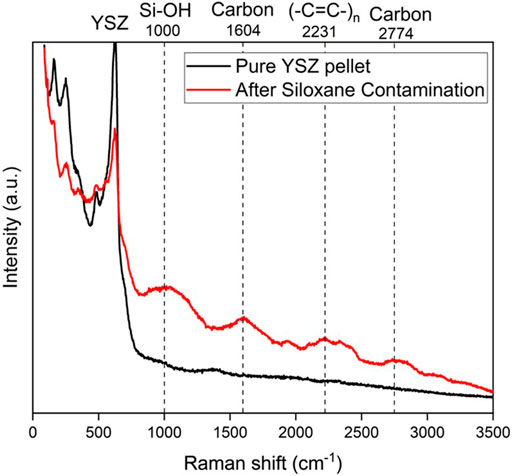
FIGURE 10. Postmortem Raman spectra acquired from the YSZ pellet after 120 h L4 contamination at 750°C versus pure YSZ pellet spectra.
Besides the deposition composition analysis, electrochemical analysis of the pellets experiment was also conducted to obtain more details about the degradation process. Figure 11 shows the Nyquist plots of the impedance of YSZ pellets under L4 contamination with H2+N2+H2O as fuel at 750°C. An obvious impedance increase can be observed after siloxane contamination. The EIS results were also fitted based on an equivalent circuit with the program LEVM embedded to Solartron Analytical Energylab XM software (Macdonald and Garber, 1977). The CPE is a constant phase element, whose characterization can be determined by two parameters, T and n. The effective capacitance, C, for the RQ circuit was calculated by Eq. 3 (Yan et al., 2013). T is the frequency-independent constant, and n represents the non-ideal factor. The electrochemical process for the YSZ pellet can be reflected in the magnitude of C (Yuan et al., 2020).
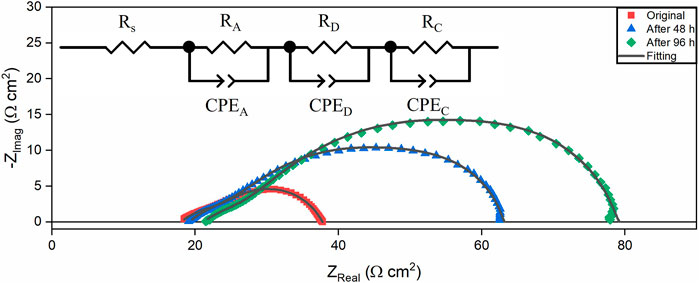
FIGURE 11. EIS and equivalent circuit fitting results of YSZ pellets with porous Ag electrodes under L4 contamination with H2+H2O+N2+L4 as the fuel at 750°C.
According to previous EIS studies of YSZ pellets (Van Herle and McEvoy, 1994; Mondal et al., 1999; Guo, 2001; Guo and Waser, 2006), there are two semicircles assigned to the impedance response of the gases chemisorption on the silver electrode, diffusion of gases through the silver electrode and gas conversion process in the silver electrode, respectively. The intercept Rs with the real axis at high frequency is related to the YSZ electrolyte resistance. Fitting the experimental impedance spectra with an equivalent circuit, the resistances and capacitances from diffusion (RD and CD), chemisorption (RA and CA) and conversion (RC and CC) are shown in Table 3 (Yan et al., 2013). Consistent with a previous study (Van Herle and McEvoy, 1994), the resistance corresponding to the gas diffusion through electrodes is much larger than chemisorption resistance and gas conversion resistance. Resistance increase is observed in all the elements in the equivalent circuit after L4 contamination. The diffusion resistance increase is more dominant than the other types. This illustrates that besides deposition on the pellets’ surface, the siloxane deposition also prefers to cover the silver current collector which is also the electrode in this setup. As a result, the diffusion process through the electrode is blocked due to siloxane deposition around silver, eventually causing a significant increase in the diffusion impedance. Besides the diffusion process, a slight ohmic resistance and gas conversion resistance increase can also be noticed from the change of Rs and RC. For ohmic resistance, it is likely due to the obstruction of the conductive network among the silver grains associated with the siloxane deposition process. When the gas concentration cannot be maintained in the electrodes, the gas conversion loss appears. The increase of the gas conversion resistance indicates the concentration change of gases supplied to the surface of the electrode. The siloxane deposition may prevent sufficient flow of gases through the electrodes. This is also in good agreement with the results found in Figure 4 that show siloxane deposition is more significant around the edge of the pellet covered by silver.
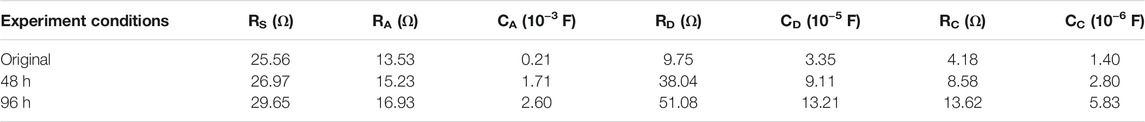
TABLE 3. Equivalent circuit fitting results from EIS results.
Discussion
Based on the SOFC siloxane contamination studies, the experiment with L4 as contamination source had less performance degradation compared with D4. To confirm this phenomenon and also investigate the mechanism causing cyclic and linear structure siloxane deposition, the YSZ pellet experiments were completed. From previous siloxane adsorption studies (Finocchio et al., 2008; Vaiss et al., 2020), hydroxyl groups play an important role in the siloxane chemical adsorption process. It has been established in previous research that YSZ has hydroxyl groups on its surface (Kogler et al., 2014). To assess the role of hydroxyl groups on the YSZ surface in the siloxane chemisorption process, different fuel mixtures were prepared. Based on the experimental conditions, the quantity of hydroxyl groups on the YSZ pellets’ surface should follow the sequence: H2+N2+H2O+siloxane > H2+N2+siloxane > N2+siloxane. Hydroxyl groups can be formed on YSZ, based on Eqs 4, 5, through reduction of YSZ by hydrogen, which only occurs near the surface, or through reaction with oxygen ions transported through the YSZ (Ong et al., 2016). Alternatively, H2O can form hydroxyl groups directly according to Eq. 6 at a faster rate compared to the previous mechanism.
Based on the photos of YSZ pellets after experiments (shown in Figure 4) and the SEM/WDS results (shown in Figures 5, 6), the extent of surface hydroxylation influences the siloxane deposition. The experiment with H2+N2+H2O+siloxane as the fuel, which is considered to have the maximum hydroxyl groups among all conditions, had the most serious siloxane deposition on the pellets’ surface. In comparison, with N2+siloxane as the fuel, which does not result in any surface hydroxyl groups, no significant siloxane deposition is observed in the middle of the YSZ pellet surface. This demonstrates that siloxane chemical adsorption is essential to the entire deposition process.
Following the same trend with the SOFC results, L4 contamination experiments also had less siloxane deposition on the YSZ pellet surface than D4. This phenomenon can also be verified by XRD and Raman results in Figures 5–10, in which the YSZ pellet with D4 deposition always resulted in stronger signal during characterization than the YSZ pellet with L4 deposition. From a chemical reaction perspective, L4 as a linear structure siloxane is less stable compared with D4, with its cyclic structure (Gun’ko et al., 2007). As a result, L4 as a linear structure siloxane can be dissociated more easily compared to the stable D4 structure (Gun’ko et al., 2007). However, the results are opposite of what might be expected. Considering the influence of hydroxyl groups on the siloxane deposition, the chemical adsorption process should be the rate determining step for the siloxane deposition reaction. This can also be proved by results in Figure 4.
The deposition in Figure 4 appears as a yellow/brown color. The visual inspection of the color change may only provide qualitative analysis. From XRD results in Figure 7 and Figure 8, SiC and SiO2 are deposited on the surface. Considering the interaction of atoms and their electrons with light waves, the band gap of a semi-conductor material can determine its color. For 3C-SiC, which correlates to 3.26 eV bandgap value, its color should be in the range of yellow to green (Zhao and Bagayoko, 2000). In this case, the color of deposition may determine the extent of SiC deposition. However, SiO2 is always reported as white or colorless crystalline. Different colors can also be observed because of light scattering from the small particles. In this case, further quantitative analysis of deposition extent can be conducted in future work.
For the experiment with H2+N2+siloxane and N2+siloxane as the fuel, which had lower hydroxylation of the surface, deposition resulting from L4 is much less than from D4. After introducing H2O in the fuel, which results in more hydroxyl groups, the chemical adsorption process accelerated and the extent of L4 deposition increased significantly.
M. Schweigkofler et al. reported that compared with linear siloxanes, many types of absorbents, including silicon and carbon-based material, show higher adsorption ability for cyclic siloxanes (Schweigkofler and Niessner, 2001). Besides the adsorption process, linear siloxanes also have much higher desorption efficiency than cyclic siloxanes because linear siloxanes can also be absorbed physically without any transformation. In some cases, large molecule linear siloxanes can convert to L2 after desorption from absorbents (Soreanu et al., 2011). Based on this insight, the assumed L4 and D4 adsorption and desorption processes on the YSZ pellet surface are presented in Jonsson Figure 12. The D4 contamination is believed to result in more degradation for SOFCs’ anode due to its high adsorption and low desorption ability on YSZ compared to L4. The pellets’ XRD results with D4 and L4 contamination in Figure 7 and Figure 8 show different deposition peak positions for SiO2 and SiC. The different positions refer to crystalline differences resulting from D4 and L4 deposition, even though they have similar composition. This may also be explained by the adsorption and desorption process difference for D4 and L4 on the YSZ pellets. As the initial step of siloxane deposition, the adsorption process difference may cause significant divergence in next deposition reaction steps.
FIGURE 12. D4/L4 chemical adsorption and desorption on the YSZ pellet surface.
Several evidences including previous studies along with the SOFC and pellet experimental results in this study derive the assumed mechanism. Direct evidence such as high spatial resolution imaging of the adsorption process by techniques like transmission electron microscopy (TEM) is still needed to prove the assumption. More studies like XPS analysis of deposition on SOFC and pellet surfaces and exhaust gas composition analysis from the SOFC experiment can also aid in understanding the siloxane deposition process.
Besides the differences in D4 versus L4 deposition, there are other interesting results to discuss. For siloxane pellet experiments, introducing H2O to the fuel accelerates the siloxane deposition which can be explained from the chemical adsorption process as discussed in the previous section. However, this can’t explain why the wet fuel reduces performance degradation with siloxane contamination which has been reported in previous work (Tian and Milcarek, 2020). There must be other factors also resulting in Ni/YSZ anode degradation besides siloxane deposition on the YSZ. Our previous work (Tian and Milcarek, 2020) suggested that sufficient H2O in the fuel could prevent carbon deposition on the Ni which is considered as a good catalyst for hydrocarbon reforming reactions (Hecht et al., 2005). In this study, some evidence can also be provided. For siloxane deposition composition analysis tests, XRD and Raman tests both show carbon-based compounds, such as SiC in XRD tests and strong amorphous carbon signals in Raman test after D4 deposition. Existing (-C=C-)n and CHx groups on YSZ surface are also evidence of early stages of carbon deposition.
Besides carbon deposition, degradation of silver current collector (also considered as electrode for pellet experiments) due to siloxane contamination is also demonstrated by this study. Silver, also known as an interaction catalyst of oxygen (Nagy and Mestl, 1999), can also be attacked by carbon and silicon, like Ni in the anode. From Figure 4, the siloxanes prefer to deposit around the silver/YSZ interface. The degradation of silver current collector/electrode can also be verified by electrochemical characterization analysis from Figure 11 in which an obvious impedance increase can be noticed after siloxane contamination. The composition map of the pellet after H2+N2+H2O+D4 exposure support significant silicon and oxygen deposition around the silver. These results all suggest that silver is extremely vulnerable to siloxane contamination. Moreover, for the setup in this study, the failure of the silver current collector not only leads to poor conductivity for electrochemical reactions, but also creates leakage around the anode. This can also cause a significant performance loss for the SOFC. In future work, siloxane deposition on silver and nickel still needs to be addressed.
Conclusion
In this study, D4 and L4 are used to represent cyclic and linear structure siloxanes, respectively, to investigate contamination of SOFCs utilizing biogas. SOFC degradation experiments with H2+N2+L4/D4 as the fuel were conducted. According to polarization curves and EIS results, the SOFC in the experiment with D4 as contamination source had higher degradation than with L4.
To reveal the mechanism causing the SOFC degradation difference by cyclic and linear structure siloxanes and also investigate the relationship between the chemical adsorption of siloxane and deposition process on YSZ, pure YSZ pellet experiments with H2+N2+H2O+D4/L4, H2+N2+D4/L4 and N2+D4/L4 as the fuel were conducted. Postmortem analysis including SEM/WDS, XRD and Raman all indicated that the deposition from D4 was more significant than from L4, in general. Among these experiments with different surface hydroxylation extent, H2+N2+H2O+D4/L4 experiment had the most deposition due to more hydroxyl groups. Considering that the siloxane deposition process is highly dependent on the extent of the surface hydroxylation, it can be concluded that the YSZ surface chemical adsorption process is a critical step. Thus, the high adsorption and the low desorption rates of cyclic siloxane compared with linear siloxanes on YSZ may explain the deposition and SOFC degradation.
Besides silicon deposition, carbon deposition including SiC and amorphous carbon was also noted from XRD and Raman results due to siloxane contamination. Electrochemical characterization results from the YSZ pellet experiments also support that silver current collector accelerated siloxane deposition which can cause the SOFC performance degradation.
Data Availability Statement
The original contributions presented in the study are included in the article/Supplementary Material, further inquiries can be directed to the corresponding author.
Author Contributions
JT: Conceptualization, Methodology, Validation, Investigation, Writing–Original Draft, Writing–Review and Editing. RM: Conceptualization, Methodology, Validation, Investigation, Writing–Review and Editing, Supervision, Funding acquisition.
Funding
This material is based upon work supported by the U.S. Department of Energy under award number DE-EE0007721.
Conflict of Interest
The authors declare that the research was conducted in the absence of any commercial or financial relationships that could be construed as a potential conflict of interest.
Publisher’s Note
All claims expressed in this article are solely those of the authors and do not necessarily represent those of their affiliated organizations, or those of the publisher, the editors and the reviewers. Any product that may be evaluated in this article, or claim that may be made by its manufacturer, is not guaranteed or endorsed by the publisher.
Acknowledgments
We acknowledge the use of facilities within the Eyring Materials Center at Arizona State University supported in part by NNCI-ECCS-1542160.
References
Bouhamed, H. (2017). Improved Structural Stability and Electrochemical Performance of 8YSZ Electrolyte by MxOy Doping for Low Temperature Solid Oxide Fuel Cells (LT-SOFCs). Mater. Sci. Eng. B 225, 182–188. doi:10.1016/j.mseb.2017.08.020
Caliandro, P., Nakajo, A., Diethelm, S., and Van herle, J. (2019). Model-Assisted Identification of Solid Oxide Cell Elementary Processes by Electrochemical Impedance Spectroscopy Measurements. J. Power Sourc. 436, 226838. doi:10.1016/j.jpowsour.2019.226838
Ciucci, F., and Chen, C. (2015). Analysis of Electrochemical Impedance Spectroscopy Data Using the Distribution of Relaxation Times: A Bayesian and Hierarchical Bayesian Approach. Electrochimica Acta 167, 439–454. doi:10.1016/j.electacta.2015.03.123
da Silva, S. W., Pedroza, R. C., Sartoratto, P. P. C., Rezende, D. R., da Silva Neto, A. V., Soler, M. A. G., et al. (2006). Raman Spectroscopy of Cobalt Ferrite Nanocomposite in Silica Matrix Prepared by Sol-Gel Method. J. Non-Crystalline Sol. 352, 1602–1606. doi:10.1016/j.jnoncrysol.2006.01.054
Dewil, R., Appels, L., Baeyens, J., Buczynska, A., and Van Vaeck, L. (2007). The Analysis of Volatile Siloxanes in Waste Activated Sludge. Talanta 74, 14–19. doi:10.1016/j.talanta.2007.05.041
Downs, R. T., and Palmer, D. C. (1994). The Pressure Behavior of a Cristobalite. Am. Mineral. 79, 9–14.
Effat, M. B., and Ciucci, F. (2017). Bayesian and Hierarchical Bayesian Based Regularization for Deconvolving the Distribution of Relaxation Times from Electrochemical Impedance Spectroscopy Data. Electrochimica Acta 247, 1117–1129. doi:10.1016/j.electacta.2017.07.050
Ferrari, A. C. (2007). Raman Spectroscopy of Graphene and Graphite: Disorder, Electron-Phonon Coupling, Doping and Nonadiabatic Effects. Solid State. Commun. 143, 47–57. doi:10.1016/j.ssc.2007.03.052
Finocchio, E., Garuti, G., Baldi, M., and Busca, G. (2008). Decomposition of Hexamethylcyclotrisiloxane Over Solid Oxides. Chemosphere 72, 1659–1663. doi:10.1016/j.chemosphere.2008.05.032
Gandiglio, M., Lanzini, A., Santarelli, M., Acri, M., Hakala, T., and Rautanen, M. (2020). Results from an Industrial Size Biogas-Fed SOFC Plant (The DEMOSOFC Project). Int. J. Hydrogen Energ. 45, 5449–5464. doi:10.1016/j.ijhydene.2019.08.022
Gun’ko, V. M., Borysenko, M. V., Pissis, P., Spanoudaki, A., Shinyashiki, N., Sulim, I. Y., et al. (2007). Polydimethylsiloxane at the Interfaces of Fumed Silica and Zirconia/Fumed Silica. Appl. Surf. Sci. 253, 7143–7156. doi:10.1016/j.apsusc.2007.02.185
Guo, X. (2001). Size Dependent Grain-Boundary Conductivity in Doped Zirconia. Comput. Mater. Sci. 20, 168–176. doi:10.1016/S0927-0256(00)00174-9
Guo, X., and Waser, R. (2006). Electrical Properties of the Grain Boundaries of Oxygen Ion Conductors: Acceptor-Doped Zirconia and Ceria. Prog. Mater. Sci. 51, 151–210. doi:10.1016/j.pmatsci.2005.07.001
Haga, K., Adachi, S., Shiratori, Y., Itoh, K., and Sasaki, K. (2008). Poisoning of SOFC Anodes by Various Fuel Impurities. Solid State Ionics 179, 1427–1431. doi:10.1016/j.ssi.2008.02.062
Hecht, E. S., Gupta, G. K., Zhu, H., Dean, A. M., Kee, R. J., Maier, L., et al. (2005). Methane Reforming Kinetics within a Ni-YSZ SOFC Anode Support. Appl. Catal. A: Gen. 295, 40–51. doi:10.1016/j.apcata.2005.08.003
Hong, J., Bhardwaj, A., Bae, H., Kim, I.-H., and Song, S.-J. (2020). Electrochemical Impedance Analysis of SOFC with Transmission Line Model Using Distribution of Relaxation Times (DRT). J. Electrochem. Soc. 167, 114504. doi:10.1149/1945-7111/aba00f
Jerng, S.-K., Seong Yu, D., Hong Lee, J., Kim, C., Yoon, S., and Chun, S.-H. (2011). Graphitic Carbon Growth on Crystalline and Amorphous Oxide Substrates Using Molecular Beam Epitaxy. Nanoscale Res. Lett. 6, 1–6. doi:10.1186/1556-276X-6-565
Jonsson, O., Erik, P., Jan, K., Rolf, E., Hakan, S., and Staffan, I. (1997). Sustainable Gas Enters the European Gas Distribution. Tokio: World gas conference.
Kikuchi, Y., Matsuda, J., Tachikawa, Y., Shiratori, Y., Taniguchi, S., and Sasaki, K. (2017). Degradation of SOFCs by Various Impurities: Impedance Spectroscopy and Microstructural Analysis. ECS Trans. 78, 1253–1260. doi:10.1149/07801.1253ecst
Kogler, M., Köck, E.-M., Bielz, T., Pfaller, K., Klötzer, B., Schmidmair, D., et al. (2014). Hydrogen Surface Reactions and Adsorption Studied on Y2O3, YSZ, and ZrO2. J. Phys. Chem. C 118, 8435–8444. doi:10.1021/jp5008472
Lanzini, A., Madi, H., Chiodo, V., Papurello, D., Maisano, S., Santarelli, M., et al. (2017). Dealing with Fuel Contaminants in Biogas-Fed Solid Oxide Fuel Cell (SOFC) and Molten Carbonate Fuel Cell (MCFC) Plants: Degradation of Catalytic and Electro-Catalytic Active Surfaces and Related Gas Purification Methods. Prog. Energ. Combustion Sci. 61, 150–188. doi:10.1016/j.pecs.2017.04.002
Lu, Y., Yuan, T., Wang, W., and Kannan, K. (2011). Concentrations and Assessment of Exposure to Siloxanes and Synthetic Musks in Personal Care Products from China. Environ. Pollut. 159, 3522–3528. doi:10.1016/j.envpol.2011.08.015
Macdonald, J. R., and Garber, J. A. (1977). Analysis of Impedance and Admittance Data for Solids and Liquids. J. Electrochem. Soc. 124, 1022–1030. doi:10.1149/1.2133473
Madi, H., Diethelm, S., Poitel, S., Ludwig, C., and Van herle, J. (2015a). Damage of Siloxanes on Ni-YSZ Anode Supported SOFC Operated on Hydrogen and Bio-Syngas. Fuel Cells 15, 718–727. doi:10.1002/fuce.201400185
Madi, H., Lanzini, A., Diethelm, S., Papurello, D., Van herle, J., Lualdi, M., et al. (2015b). Solid Oxide Fuel Cell Anode Degradation by the Effect of Siloxanes. J. Power Sourc. 279, 460–471. doi:10.1016/j.jpowsour.2015.01.053
Mondal, P., Klein, A., Jaegermann, W., and Hahn, H. (1999). Enhanced Specific Grain Boundary Conductivity in Nanocrystalline Y2O3-Stabilized Zirconia. Solid State Ionics 118, 331–339. doi:10.1016/s0167-2738(98)00452-4
Nagy, A., and Mestl, G. (1999). High Temperature Partial Oxidation Reactions Over Silver Catalysts. Appl. Catal. A: Gen. 188, 337–353. doi:10.1016/S0926-860X(99)00246-X
Nielsen, J., and Hjelm, J. (2014). Impedance of SOFC Electrodes: A Review and a Comprehensive Case Study on the Impedance of LSM:YSZ Cathodes. Electrochimica Acta 115, 31–45. doi:10.1016/j.electacta.2013.10.053
Ong, K., Hanna, J., and Ghoniem, A. F. (2016). Investigation of a Combined Hydrogen and Oxygen Spillover Mechanism for Syngas Electro-Oxidation on Ni/YSZ. J. Electrochem. Soc. 164, F32–F45. doi:10.1149/2.0161702jes
Papurello, D., Borchiellini, R., Bareschino, P., Chiodo, V., Freni, S., Lanzini, A., et al. (2014). Performance of a Solid Oxide Fuel Cell Short-Stack with Biogas Feeding. Appl. Energ. 125, 254–263. doi:10.1016/j.apenergy.2014.03.040
Papurello, D., Lanzini, A., Drago, D., Leone, P., and Santarelli, M. (2016). Limiting Factors for Planar Solid Oxide Fuel Cells under Different Trace Compound Concentrations. Energy 95, 67–78. doi:10.1016/j.energy.2015.11.070
Papurello, D., and Lanzini, A. (2018). SOFC Single Cells Fed by Biogas: Experimental Tests with Trace Contaminants. Waste Manage. 72, 306–312. doi:10.1016/j.wasman.2017.11.030
Park, J.-W., and Shin, H.-C. (2001). Surface Emission of Landfill Gas from Solid Waste Landfill. Atmos. Environ. 35, 3445–3451. doi:10.1016/S1352-2310(01)00118-2
Rasmussen, J. F. B., and Hagen, A. (2009). The Effect of H2S on the Performance of Ni-YSZ Anodes in Solid Oxide Fuel Cells. J. Power Sourc. 191, 534–541. doi:10.1016/j.jpowsour.2009.02.001
Riley, D. M., Tian, J., Güngör-Demirci, G., Phelan, P., Villalobos, J. R., and Milcarek, R. J. (2020). Techno-Economic Assessment of CHP Systems in Wastewater Treatment Plants. Environments 7, 74. doi:10.3390/environments7100074
Rillo, E., Gandiglio, M., Lanzini, A., Bobba, S., Santarelli, M., and Blengini, G. (2017). Life Cycle Assessment (LCA) of Biogas-Fed Solid Oxide Fuel Cell (SOFC) Plant. Energy 126, 585–602. doi:10.1016/j.energy.2017.03.041
Rücker, C., and Kümmerer, K. (2015). Environmental Chemistry of Organosiloxanes. Chem. Rev. 115, 466–524. doi:10.1021/cr500319v
Ryckebosch, E., Drouillon, M., and Vervaeren, H. (2011). Techniques for Transformation of Biogas to Biomethane. Biomass and Bioenergy 35, 1633–1645. doi:10.1016/j.biombioe.2011.02.033
Scarlat, N., Dallemand, J.-F., and Fahl, F. (2018). Biogas: Developments and Perspectives in Europe. Renew. Energ. 129, 457–472. doi:10.1016/j.renene.2018.03.006
Schweigkofler, M., and Niessner, R. (2001). Removal of Siloxanes in Biogases. J. Hazard. Mater. 83, 183–196. doi:10.1016/S0304-3894(00)00318-6
Skinner, B., and Appleman, D. (1963). Melanophlogite, a Cubic Polymorph of Silica. Am. Mineral. 48, 854–867.
Soreanu, G., Béland, M., Falletta, P., Edmonson, K., Svoboda, L., Al-Jamal, M., et al. (2011). Approaches Concerning Siloxane Removal from Biogas - A Review. Can. Biosyst. Eng./Le Genie Des Biosyst. Au Can. 53, 8.1–8.18.
Sumi, H., Shimada, H., Yamaguchi, Y., Yamaguchi, T., and Fujishiro, Y. (2020). Degradation Evaluation by Distribution of Relaxation Times Analysis for Microtubular Solid Oxide Fuel Cells. Electrochimica Acta 339, 135913. doi:10.1016/j.electacta.2020.135913
Tian, J., and Milcarek, R. J. (2020). Investigating the Degradation Mechanism of the Solid Oxide Fuel Cell Nickel-Yttria Stabilized Zirconia Anode Under Siloxane Contamination. J. Power Sourc. 480, 229122. doi:10.1016/j.jpowsour.2020.229122
Tian, J., and Milcarek, R. J. (2021). Siloxane Deposition on the Ni-YSZ Solid Oxide Fuel Cell Anode Exposed to Bio-Syngas. J. Electrochem. Soc. 168, 044503. doi:10.1149/1945-7111/abf21a
Trendewicz, A. A., and Braun, R. J. (2013). Techno-Economic Analysis of Solid Oxide Fuel Cell-Based Combined Heat and Power Systems for Biogas Utilization at Wastewater Treatment Facilities. J. Power Sourc. 233, 380–393. doi:10.1016/j.jpowsour.2013.01.017
Vaiss, V. S., Fonseca, C. G., Antunes, F. P. N., Chinelatto Jr., L. S., Chiaro, S. S. X., Souza, W. F., et al. (2020). Experimental and Theoretical Study of Deactivated HDT Catalysts by Si Species Deposited on Their Surfaces: Models Proposition, Structural and Thermodynamic Analysis. J. Catal. 389, 578–591. doi:10.1016/j.jcat.2020.06.007
Van Herle, J., and McEvoy, A. J. (1994). Oxygen Diffusion through Silver Cathodes for Solid Oxide Fuel Cells. J. Phys. Chem. Sol. 55, 339–347. doi:10.1016/0022-3697(94)90230-5
Wan, T. H., Saccoccio, M., Chen, C., and Ciucci, F. (2015). Influence of the Discretization Methods on the Distribution of Relaxation Times Deconvolution: Implementing Radial Basis Functions with DRTtools. Electrochimica Acta 184, 483–499. doi:10.1016/j.electacta.2015.09.097
Wang, N., Tan, L., Xie, L., Wang, Y., and Ellis, T. (2020). Investigation of Volatile Methyl Siloxanes in Biogas and the Ambient Environment in a Landfill. J. Environ. Sci. 91, 54–61. doi:10.1016/j.jes.2020.01.005
Yan, P., Mineshige, A., Mori, T., Wu, Y., Auchterlonie, G. J., Zou, J., et al. (2013). Microanalysis of a Grain Boundary's Blocking Effect in Lanthanum Silicate Electrolyte for Intermediate-Temperature Solid Oxide Fuel Cells. ACS Appl. Mater. Inter. 5, 5307–5313. doi:10.1021/am401195e
Yu, Y., Wang, Y., Lin, K., Hu, N., Zhou, X., and Liu, S. (2013). Complete Raman Spectral Assignment of Methanol in the C-H Stretching Region. J. Phys. Chem. A. 117, 4377–4384. doi:10.1021/jp400886y
Yuan, M., Dong, W., Wei, L., Liu, Q., Meng, Y., Wang, X., et al. (2020). Stability Study of SOFC Using Layered Perovskite Oxide La1·85Sr0·15CuO4 Mixed with Ionic Conductor as Membrane. Electrochimica Acta 332, 135487. doi:10.1016/j.electacta.2019.135487
Keywords: solid oxide fuel cell (SOFC), siloxane, biogas, degradation, D4, L4, carbon deposition
Citation: Tian J and Milcarek R (2021) Degradation Comparison of Cyclic and Linear Siloxane Contamination on Solid Oxide Fuel Cells Ni-YSZ Anode. Front. Energy Res. 9:749771. doi: 10.3389/fenrg.2021.749771
Received: 29 July 2021; Accepted: 11 October 2021;
Published: 22 October 2021.
Edited by:
Uwe Schröder, University of Greifswald, GermanyReviewed by:
Stephen Skinner, Imperial College London, United KingdomAleksey Yaremchenko, University of Aveiro, Portugal
Copyright © 2021 Tian and Milcarek. This is an open-access article distributed under the terms of the Creative Commons Attribution License (CC BY). The use, distribution or reproduction in other forums is permitted, provided the original author(s) and the copyright owner(s) are credited and that the original publication in this journal is cited, in accordance with accepted academic practice. No use, distribution or reproduction is permitted which does not comply with these terms.
*Correspondence: Ryan J. Milcarek, Unlhbi5NaWxjYXJla0Bhc3UuZWR1