 Zaijun Li
 Suleman Sarwar
 Tao Jin3,4*
94% of researchers rate our articles as excellent or good
Learn more about the work of our research integrity team to safeguard the quality of each article we publish.
Find out more
ORIGINAL RESEARCH article
Front. Energy Res. , 20 August 2021
Sec. Sustainable Energy Systems
Volume 9 - 2021 | https://doi.org/10.3389/fenrg.2021.746405
This study evaluated the agricultural eco-efficiency (AEE) of 77 counties and districts in Jiangsu Province from 1999 to 2018 using the slack-based measure (SBM) of efficiency in data envelopment analysis (DEA) (SBM-DEA) and analyzed its spatiotemporal evolution characteristics and influencing factors. We found that 1) the overall AEE, pure technology efficiency (PTE), and scale efficiency (SE) exhibited a fluctuating downward trend. AEE exhibited a significantly positive spatial association and an increasingly widening regional inequality. 2) AEE featured the “high south” and “low north” spatial pattern, with the high-value regions concentrated around the Taihu Lake plain region in southern Jiangsu Province (Sunan) and low-value regions scattered across most of the northern Jiangsu Province (Subei) cities. The high-high and low-low spatial association types further confirmed the existence of the north–south agglomeration pattern. 3) PTE and SE exhibited a similar “high south” and “low north” spatial pattern to that of AEE. The areas with the growth trends of AEE, PTE, and SE were clustered in Xuzhou and Nanjing city and in the bordering regions between Yangzhou and the Huai’an city, and also between Changzhou and the Wuxi city. 4) Excessive redundant input and use of pesticides, chemical fertilizers, agricultural diesel, labor, land, and agricultural carbon emissions, all have been the primary factors affecting Jiangsu’s AEE. Irrigation also considerably affected AEE, while mechanical power and agricultural film have minimal effects. The majority of counties and districts in the Subei, central Jiangsu Province (Suzhong), and Ningzhen Yang Hilly region experienced excessive usage of chemical fertilizers, pesticides, chemical fertilizers, agricultural diesel, labor, and land. The findings can improve understanding of the spatial association effect and underlying impediment of AEE and can further help policymakers promoting agricultural eco-efficiency.
The rapid development of China’s agricultural industry has led to severe agricultural pollution caused by the massive application of chemical fertilizers, agricultural plastic films, and pesticides. This pollution is linked to intensive agriculture growth mode and is threatening sustainable agricultural development (Liu et al., 2020; Zou et al., 2020). For instance, Jiangsu, one of China’s primary agricultural production bases, remains in the conventional development mode of high investment, high consumption, and high output. In recent years, the province has declined into high material inputs, high carbon emissions, and low efficiency to promote agricultural yield (Du, 2010; Tian et al., 2014; Xiong et al., 2020). This has increased emissions of agricultural ammonia (NH3), nitrogen (N), carbon dioxide (CO2), chemical oxygen demand (COD), total nitrogen, and total phosphorus emissions (Liu et al., 2014; Guo et al., 2017; Huang et al., 2020). These agricultural byproducts have exerted significant adverse effects on soil, water, air, and neurobehavioral functions (Huang et al., 2007; Zhang et al., 2016). These phenomena hamper the goals of sustainable agriculture aimed at conserving land and water resources, using environmentally non-degrading production techniques. They are also aimed at using technically appropriate, economically viable, and socially acceptable farming operations (Pretty, 2008; Bonfiglio et al., 2017). Hence, identifying green agricultural performance and its underlying impediment factors is crucial for supporting the agricultural transformation and development of Jiangsu province from the quantitative growth stage towards green and efficient development.
Eco-efficiency is defined as the effectiveness of producing maximum economic output while consuming minimal natural resources and minimizing environmental degradation (Kuosmanen, 2005; Huang et al., 2014; Caiado et al., 2017). It has been applied in numerous fields, such as industrial processes (Liu et al., 2021), tourism assessment(Peng et al., 2017), carbon performance (Lei et al., 2017), energy and environmental impact assessment (Xing et al., 2018; Peng et al., 2020), and even to a specific sector of industry (Shao et al., 2019). By bridging the economic value of agricultural activities and their impacts on the environment, eco-efficiency is broadened to agricultural applications and can be considered an effective tool for measuring agricultural sustainability (Keating et al., 2010; Georgopoulou et al., 2015). Agricultural eco-efficiency (AEE) carries the inherent connotation of eco-efficiency and embodies the ecological and economic aspects of agricultural sustainability, which means producing more quantity and higher quality agricultural products and services, exploiting fewer natural resources, enhancing resource utilization, and causing minimal adverse environmental impacts (Picazo-Tadeo et al., 2011; Coluccia et al., 2020; Gołaś et al., 2020). The measurement of AEE can effectively quantify agricultural sustainability performance, which has been applied at different scales, from the national level (Pang et al., 2016; Gancone et al., 2017), provincial level (Xu et al., 2020; Liao et al., 2021), city level (Rosano-Peña et al., 2020; Yang et al., 2021), village level (Xiang et al., 2020), to the farm level (Barnes and Thomson, 2014; Stępień et al., 2021). However, our review of the previous related studies indicates that there is a lack of research on evaluation of AEE at the county level, especially in Jiangsu province. The county is considered as a basic administrative unit in the agricultural production management, while the county agriculture constitutes the foundation of the national economy.
AEE has been evaluated using numerous methods including the ratio method, life cycle accounting (LCA), ecological footprint, environmentally sustainable value (ESV), stochastic frontier analysis (SFA), and data envelopment analysis (DEA) (Victor et al., 2018; Czyżewski et al., 2021). Compared with the specific parameter methods, the nonparametric DEA has the advantage of neither specifying a functional form, nor dealing with multiple input and output systems, are required (Huang et al., 2018; Yu et al., 2018). Moreover, various improvements have been made to ameliorate the limitations of the original DEA model and expand its flexibility and effectiveness. For example, Tone (2001) proposed a non-radial slacks-based measure (SBM) DEA model to avoid the biased estimation of radial and oriented DEA models, which effectively resolves the slack of input excesses and the output shortfalls and measures the inefficiency of the decision-making units (DMUs) in traditional DEA. Tone (2004) further extended the SBM to consider undesirable outputs for production efficiency evaluation, which reflects the real production process. Hence, the SBM model incorporating slack variables and undesirable outputs can better reflect the nature of eco-efficiency evaluation (Lee et al., 2014; Peng et al., 2017) and is, therefore, more suitable for the evaluation of agricultural production performance that accommodates both economic and environmental effects (Chen, 2014; Linh Le et al., 2019;Suzigan et al., 2020).
The first law of geography states that everything is related to everything else, and that near things are more related than distant things (Tobler, 1970; Zhu et al., 2018). Likewise, space is highly consequential in environmental and resource economic analyses (Anselin, 2001). Spatial effects concerning spatial dependence, heterogeneity, and clustering have been considered in energy eco-efficiency (Guan and Xu, 2016; Wang et al., 2019) and regional eco-efficiency (Zhou et al., 2019). The spatial effects of inter-regional eco-efficiency can be evaluated by measuring the global Moran’s I and local Moran’s I. There are six agricultural zones in Jiangsu province, that are divided according to the physiographic and socioeconomic composition of agricultural production contexts: 1) the Taihu lake agriculture area, 2) the agriculture area along the Yangtze River, 3) the Ningzheny Yang hilly agricultural area, 4) the Xuzhou-Huai’an agriculture area, 5) the coastal agriculture area, and 6) the Lixiahe river area. Evaluation of the spatiotemporal evolution characteristics of AEE can support the formulation and implementation of high-quality green agricultural strategies. Given these similar inner production conditions, the spatial dimension of agricultural eco-efficiency and the global and local spatial clustering of agricultural eco-efficiency should be used to analyze the cluster pattern of agricultural eco-efficiency in Jiangsu province.
In this study, the DEA-SBM model was used to assess the AEE by incorporating agricultural carbon emissions in the 77 counties and districts of Jiangsu province (China) in 1999–2018. The main research questions addressed by the study are 1) the temporal variation trend of the AEE and its decomposition terms in Jiangsu province during the study period, 2) the spatial differences in AEE based on characteristics, association patterns, and growth type, and 3) the primary sources of AEE loss for various counties and districts of Jiangsu province. This manuscript is organized as follows: the second part is methodology and data, followed by empirical results and analysis, then the discussion, and finally, the conclusion.
Jiangsu province is located in the eastern coast of China, at the lower reaches of the Yangtze and Huaihe rivers (Figure 1). The topography features vast plains and water areas with patches of mountains and hilly lands. Due to rapid urbanization and industrialization, losses in croplands have shown a decreasing trend from 700.10 × 10⁴ hm2 in 2000 to 633.06 × 10⁴ hm2 in 2015 (Wu et al., 2020). The per capita cultivated land is 0.85 mu, equivalent to two-thirds of the national average. In the southern Jiangsu, the value difference is even more prominent when the per capita cultivated land is less than 0.30 mu. Due to the region’s limited per capita arable land and dense population, the Jiangsu’s agricultural production is highly dependent on use of fertilizers that trigger strong carbon release and intensified environmental pressure (Hu et al., 2019).
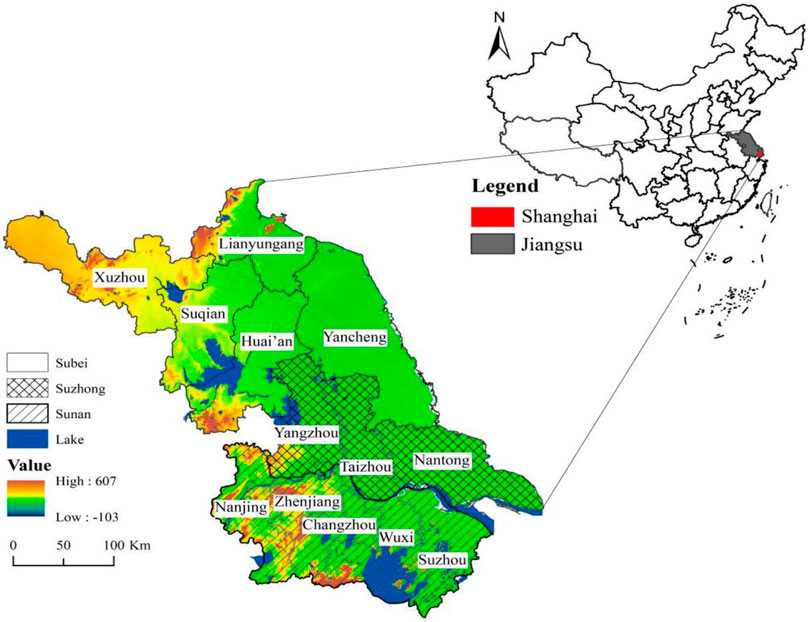
FIGURE 1. The study area.
Jiangsu is located in the northern part of the Yangtze River Delta economic zone. It is composed of 13 municipalities, which can be further subdivided into three districts based on socioeconomic boundaries: Subei, Suzhong, and Sunan. The level of economic development greatly varies among the three regions, exhibiting clear decreasing trend from south to north. Jiangsu is one of the 13 major grain-producing provinces in China.
As a non-radial and non-oriented DEA model, the SBM model has the advantage of settling the problem of input and output slacks and avoid radial and oriented deviation. In this study, we selected 77 counties of Jiangsu as DMUs. Each unit contains inputs, desirable outputs, and undesirable outputs (carbon emissions), represented by the vectors:
where
AEE can be decomposed into pure technology efficiency (PTE) and scale efficiency (SE). PTE refers to the efficiency of resource allocation, utilization, pollution control, management, and production technology. SE is the efficiency of the resource scale, using which one can determine whether the DMUs are at the optimal production scale or not (Cheng, 2014). The value
The degree of inequality in the AEE can be measured using the CV and the Gini coefficient.
where
ESDA is a set of synthesized methods focused on exploring spatial distributions and on identifying spatial association, clusters, and hot (or cold) spots, for both global and local spatial autocorrelations (Kim and Dall'erba, 2014; Fan et al., 2019). The global Moran’s I is mainly utilized to describe the global spatial autocorrelation, and is defined for n observations on an attribution variable x as follows (Anselin, 1995):
Where
While global spatial autocorrelation can help identify spatial clusters, it cannot be used for spatial allocation of these clusters. Local spatial autocorrelation can be used to explain the patterns of local clustering. For province i and year t, the local spatial autocorrelation is expressed as (Ren et al., 2020):
Four types of spatial associations can be identified based on the value of adjacent regions from the local spatial autocorrelation: high-high, low-low, high-low, and low-high. Regions classified as high are those with greater-than-average values clustered in areas with greater-than-average values. Likewise, low-low, high-low, and low-high clusters can be identified. Only the high-high and low-low classes represent positive spatial autocorrelation, since these categories have regions with similar values being clustered together.
General agriculture comprises agriculture, forestry, animal husbandry, and fishery, while special agriculture only refers to planting. Planting is the foundation of agriculture and is the most important component from AEEs perspective. In this study, special agriculture (i.e., planting) was selected as the research object to measure AEE. Seven input indicators were selected to characterize agricultural labor, land, irrigation, chemical fertilizer, and pesticide usage using the available data from Jiangsu’s Statistics Bureau. Both desirable and undesirable output indicators were included, and the evaluation system for the input-output and variable selection is described in Table 1.
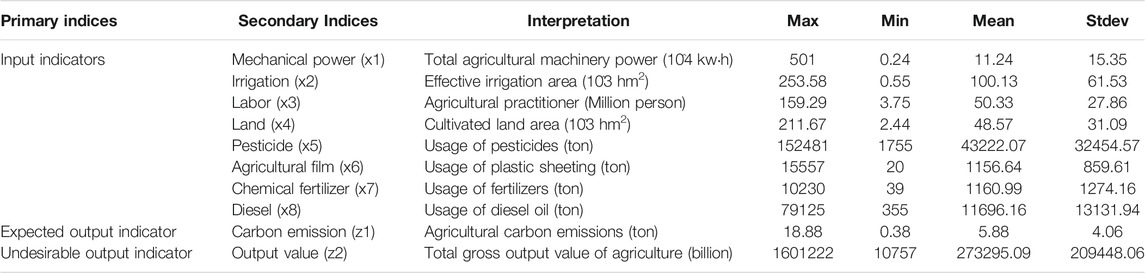
TABLE 1. The evaluation indicators of agricultural eco-efficiency.
Agricultural carbon emissions were incorporated as undesirable agricultural outputs. The main carbon sources for agricultural production activities were identified as chemical fertilizers, pesticides, films, diesel, irrigation, and tillage. We used the estimates from the previous studies (Tian et al., 2014; Xiong et al., 2016; Xiang et al., 2020): agricultural chemical fertilizer (0.8956 t/t), agricultural pesticide (4.9341 t/t), agricultural film (5.18 t/t), agricultural diesel (0.5927 t/t), agricultural irrigation (0.2665 t/hm2), and arable land (0.3126 t/hm2). Agricultural output indicators were characterized using the total agricultural output value. Price data were adjusted to the 1999 prices to eliminate the impact of price fluctuations. All data were collected from the Jiangsu Statistical Yearbook (2000–2019) and the Rural Statistical Yearbook of Jiangsu Province (2000–2019), that are annually published by the Jiangsu Statistics Press.
The temporal changes in the AEE, PTE, and SE are shown in Figure 2 by calculating each year’s geometric mean value of the AEE, PTE, and SE of all counties and districts from 1999 to 2018.
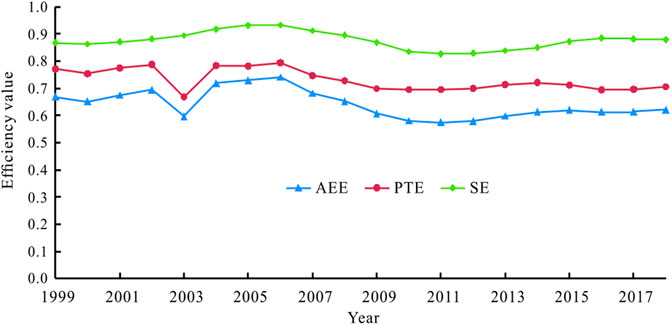
FIGURE 2. Temporal variation of the AEE, PTE, and SE from 1999 to 2018.
As seen from Figure 2, the annual mean of AEE was 0.640, thus, indicating that the actual input was only approximately 64.0% of the optimal input. Under a constant output, a reduction of 36.0% of the input would yield effective AEE. The geometric mean value for the annual PTE was 0.730, while it was 0.876. Both values are above the annual mean value of AEE, and the value of SE was greater than that of PTE, suggesting that the improvement of AEE was dependent on scale efficiency.
Figure 2 also shows that the AEE exhibited a generally downward fluctuating trend. The value increased from 0.669 in 1999 to 0.695 in 2002. Then it dropped to 0.597 in 2003, mounted to a peak value of 0.741 in 2006, declined to 0.574 in 2011, and, ultimately, reached 0.621 in 2018. The PTE experienced temporal fluctuations in the AEE. For the SE, the value rose from 0.867 in 1999 to 0.933 in 2006 and declined to 0.879 in 2018. Its contribution rate to AEE has increased from 129.65% in 1999 to 141.55% in 2018.
First, the CV and Gini coefficients of AEE at the temporal and spatial dimensions were calculated (Figures 3, 4). As shown in Figure 3, the CV and Gini coefficients of AEE exhibited a fluctuating but generally upward trend. It experienced an initial decline followed by a strongly positive trend. More specifically, the CV and Gini values decreased from 0.239 to 0.132 in 1999 to 0.195 and 0.110 in 2004, and rose to 0.332 and 0.190, respectively, in 2018. These trends indicate that in recent years, the regional differences in AEE have been likely increased.
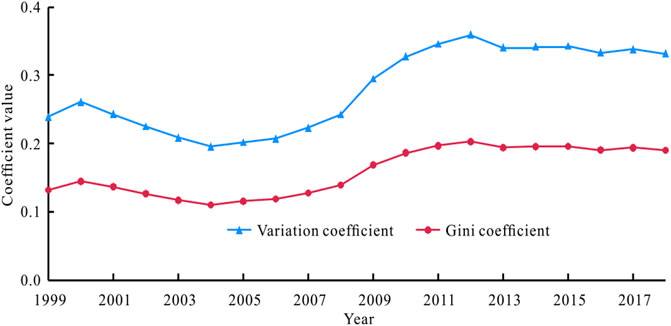
FIGURE 3. The CV and Gini coefficient of regional agricultural eco-efficiency from 1999 to 2018.
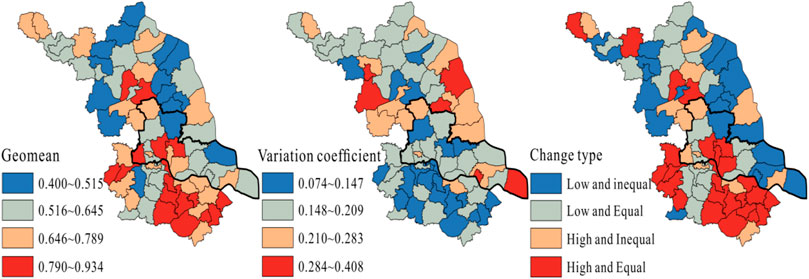
FIGURE 4. Spatial evolution pattern of regional agricultural eco-efficiency.
Taking 0.65 as the dividing line of high and low AEE by 0.65 and using 0.19 to separate relative equality and inequality groups, then, the spatiotemporal differentiation evolution types of AEE for each county and district was visualized through the ArcGIS 10.5 software (Figure 4). As shown in Figure 4, the annual geometric mean value of AEE in Jiangsu province overall disclosed a “high south” and “low north” distribution pattern. The counties and districts with high AEE values were evidenced mainly around the Taihu Plain in Sunan and scattered in Nanjing, Yangzhou, Huai’an, and the Taizhou City. Those with low AEE values were mainly located in Subei, particularly along the coasts, and in Ningzhen Yang Hilly of Sunan.
The variation coefficient for each county and district from 1999 to 2018 was calculated to identify inter-annual fluctuation patterns. Overall, the variation coefficient ranged from 0.074 to 0.408, thus, pointing on a large interannual difference in AEE for most counties and districts. The spatial pattern of the regional variation coefficient was nearly opposite to the calculated geometric mean of the AEE. The high variation coefficient regions were mainly found in Subei, and particularly in Yancheng and Huai’an, while the low variation coefficient regions were mainly found in Sunan and Suzhong. The regions with a high geometric mean of AEE have likely experienced weaker interannual variability. In contrast, the regions with lower geometric mean value have likely exhibited stronger interannual fluctuations because the low AEE regions were more susceptible to input conditions in agricultural production, while the spatial evolution pattern of high AEE has cumulative and inertial effects.
The spatiotemporal differentiation pattern of the combination type between high and low and equal and unequal AEE was generally consistent with the geometric mean pattern of AEE. The high and equal types were mainly distributed in Sunan, Yangzhou in Suzhong, Dafeng County, and the Huai’an districts, accounting for 32.47% of the entire region. The low and inequal and low and equal types were respectively scattered in the Ningzhen Yang Hilly region and the northern and coastal counties in Subei, accounting for 50.65% of the whole region.
As shown in Table 2, the global Moran’s I of the AEE exhibited a positive spatial correlation. Overall, the global Moran’s I passed the 5% significance level except 2003, 2004, and 2005. These findings indicated that AEE in Jiangsu province exhibited significant clustering, but the degree of clustering showed a fluctuating and expanding trend. Likewise, the Moran’s I of AEE fluctuated to its lowest level in 2004, followed by a rapid increase. The results suggest a consistent variation trend between the spatial association and regional inequality of the AEE. With the improvement of AEE in all counties and districts in 2000 and 2004, the regional difference and spatial clustering degree were significantly reduced. However, with the regional difference in AEE increasing since 2004, the spatial clustering degree of regional AEEs has returned to expanding pattern.
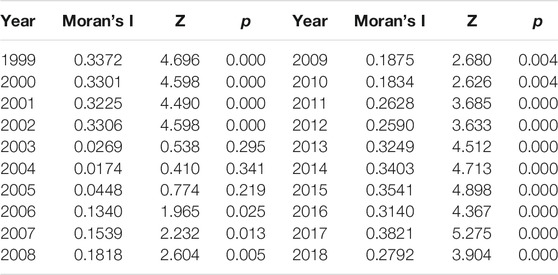
TABLE 2. The Moran’s I of agricultural eco-efficiency from 1999 to 2018.
Global Moran’s I values did not reflect the spatial association characteristics of a particular region. Due to this, the local Moran’s I value was used to explore the local clustering characteristics of agricultural eco-efficiency during five selected years: 1999, 2004, 2009, 2014, and 2018. According to the local indicators of spatial association (LISA) agglomeration diagram (as shown in Figure 5), the local spatial correlation in Jiangsu’s agricultural eco-efficiency showed distinct characteristics. First, AEE was generally significant for the high-high and low-low spatial clusters, with the high-high type accounting for 32.47%, and the low-low type accounting for 35.06%. The rest (high-low and low-high agglomeration regions) accounted for only 32.47%. Second, the spatial association pattern in the regional AEEs exhibited salient spatial variability. The high-high cluster regions exhibited significant spatial variations, with the initial clustering in the border regions of Wuxi, Nantong, and the Suzhou city shifting to the districts of Nanjing and Taizhou city. The clustering then shifted toward the continuous Suzhou-Wuxi-Changzhou region and expanded the isolated Xuzhou, Yangzhou, and Nanjing cities. The low-low cluster regions exhibited noticeable contrast with an initial scattered distribution among inland counties and districts of Xuzhou, Huai’an, and the Nanjing City, shifting towards coastal counties and districts of Subei and Suzhong, especially in Yancheng and Nantong city and parts of Lianyungang and Suqian City. The high-low and low-high regions had unstable spatial patterns. Also, the number of high-low regions decreased, while the low-high regions clustered in the Ningzhen Yang Hilly mountain area.
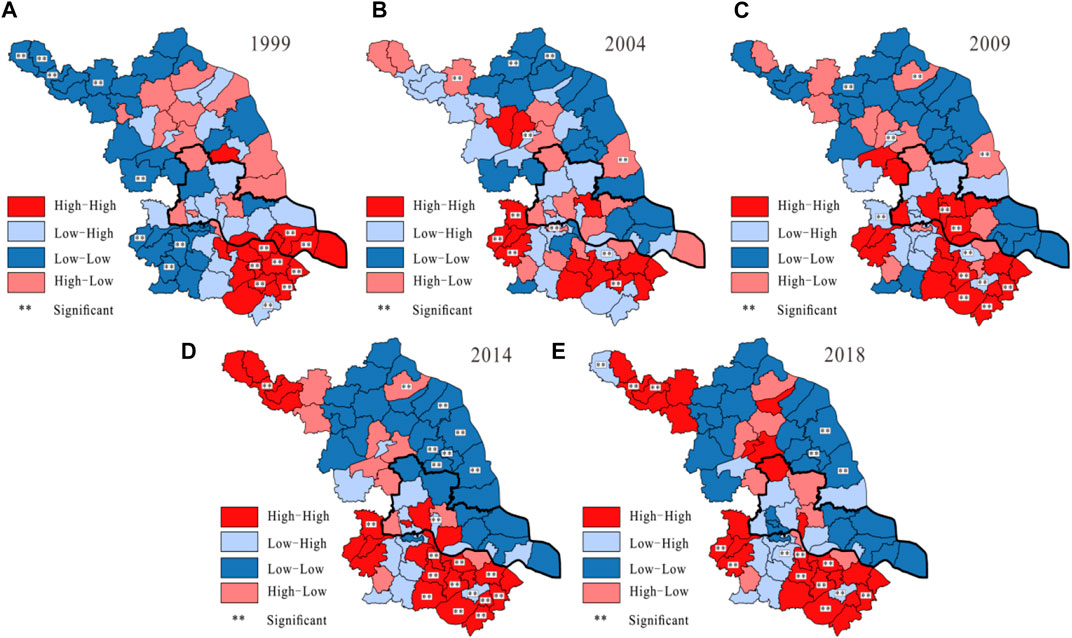
FIGURE 5. Spatial association pattern of regional agricultural eco-efficiency.
The coordination growth between AEE, PTE, and SE was further identified, mapped, and categorized in terms of growth type. As shown in Figure 6, the spatial pattern of PTE is generally consistent with that of AEE, where high values are found in the north, and low values are found in the south. The regions with relatively low PTE geometric mean value are distributed in Subei, the coastal regions of Suzhong, and parts of the Ningzhen Yang Hilly region. From SE perspective, the geometric mean value for each county and district is higher than the PTE, indicating that SE significantly contributes to promoting AEE. Likewise, SE exhibited a spatial pattern of high south and low north. The areas with high SE are found mainly in Sunan, the inland regions of Suzhong, and the Huai’an city of Subei, while low SE regions are clustered in the coastal and northern regions of Subei, particularly in Yancheng city.
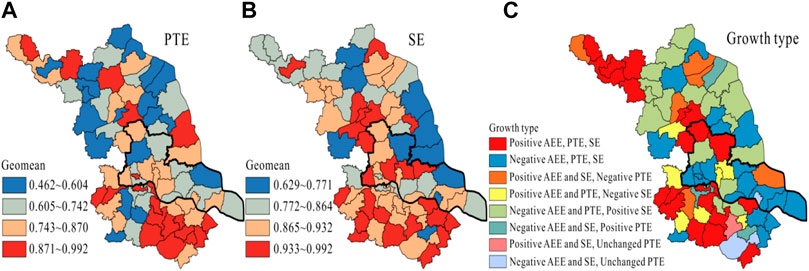
FIGURE 6. The growth type of between agricultural eco-efficiency, pure technology efficiency, and scale efficiency.
During the study period, the areas with positive growth of AEE, PTE, and SE accounted for 27.27% of total areas and were mainly situated in Xuzhou, Huai’an, Yangzhou, Nanjing, and Changzhou city, which implies that these regions’ positive AEE growth has been accompanied by the synergistic growth of PTE and SE. The areas with the negative AEE, negative PTE, and positive SE type accounted for 22.08% and were mainly distributed in Subei. This growth combination hints that AEE growth is dwindled by the lag in PTE growth. Meanwhile, the areas with negative AEE, PTE, and SE growth accounted for 25.97% and were concentrated in the coastal regions of Suzhong and Sunan and along the Yangtze River region, where the negative AEE was caused by the deterioration in PTE and SE. The number of the other types was relatively small and was scattered throughout the province.
The non-effective DEA unit analysis showed that the input-output allocation had not reached the optimal level. The redundancy analysis of input factors can identify the reasons for AEE loss in Jiangsu province and clarify the potential for promoting AEE. According to the SBM model, when p*<1,
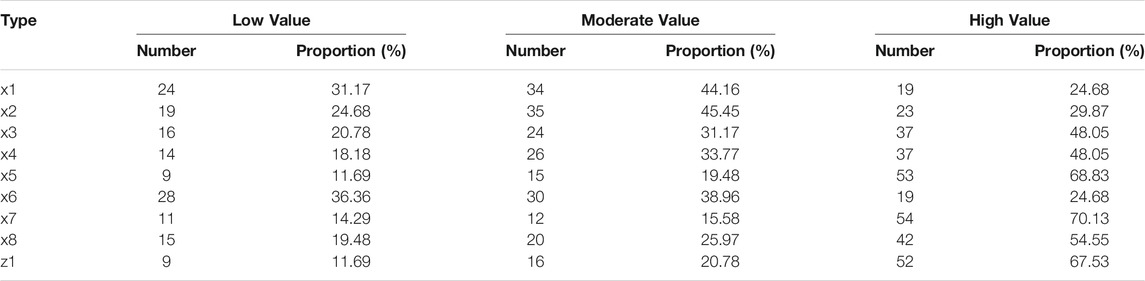
TABLE 3. The number and proportion of counties and districts at different intervals of indicators.
As shown in Table 3, the loss of agricultural eco-efficiency in most counties and districts results from the excessive use of pesticides (x5), chemical fertilizers (x7), diesel (x8), labor (x3), land (x4), and agricultural carbon emissions (z1). In particular, the number of counties and districts with high values of pesticide (x5) and chemical fertilizer (x7) use were 53 and 54, respectively. These estimates account for 68.83 and 70.13% of whole units, respectively. Thus, more than 68% of counties and districts should reduce their agricultural pesticide and chemical fertilizer use by at least 35%. The similar conclusions are applicable for x8, x3, and x4. In terms of undesirable output (z1), 67.53% of counties and districts have high input-output redundancy rates. As a part of agricultural carbon emissions resulting from chemical fertilizer (x5), pesticide (x7), diesel (x8), and arable land (x4). In turn, it indicates that the excessive use of agricultural chemicals and extensive farming techniques are significant factors influencing the AEE. Likewise, x2 considerably affects AEE, while x6 and x1 only have minimal effects.
The ArcGIS 10.5 software was used to visualize the spatial difference of the reducible proportion for the different indicators. As shown in Figure 7, the areas with high reducible proportions are mainly situated in Subei, Suzhong, and the Ningzhen Yang Hilly region, while the majority of counties with low reducibility and districts are clustered in the Taihu Plain. In terms of chemical fertilizer (x7), the spatial pattern exhibits distinct south low and north high distributions. A similar spatial pattern can be identified for x3, x4, x5, and x8. Given the improvements in agricultural mechanization and the progress of agricultural production technology, the reducible proportion for inputs of x1, x2, and x6 is significantly reduced in most counties and districts.
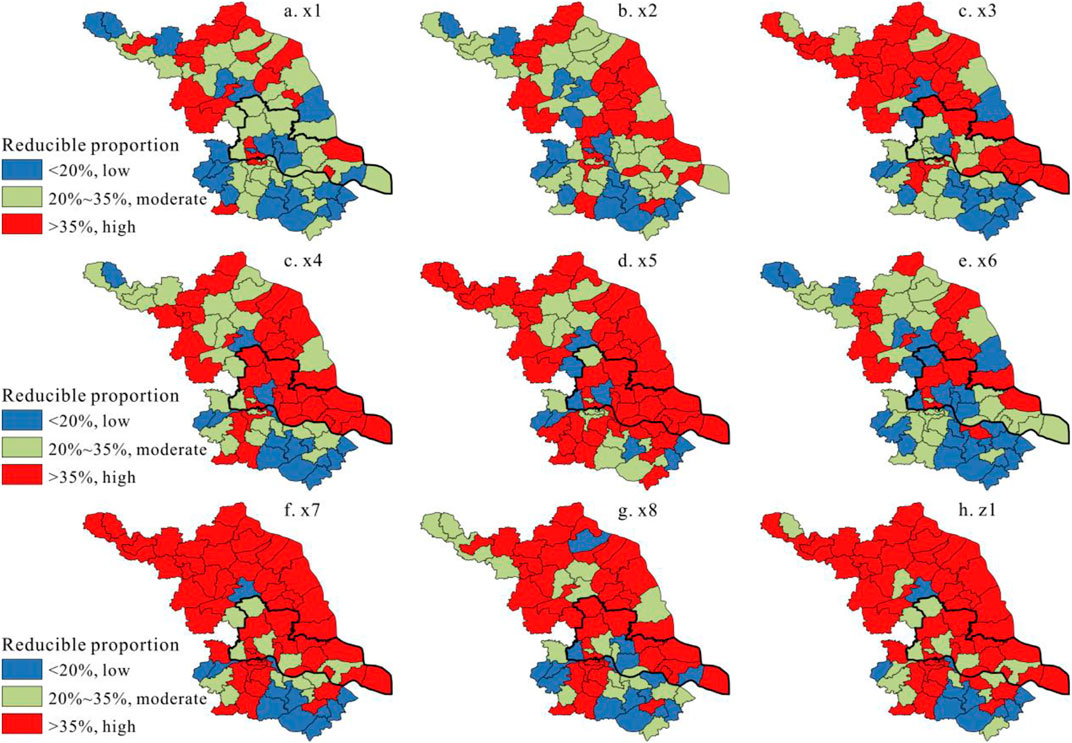
FIGURE 7. The improvement potential for agricultural ecological efficiency.
The trends of temporal change of AEE, PTE, and SE show that the slow growth of AEE in Jiangsu province for the past 20 yr has been caused by the negative growth in PTE. It yielded the low-level conversion rate of green technology and caused the unreasonable allocation of resources. Thus, the agricultural technological innovation and rational resource allocation should be prioritized to minimize the reduction of AEE caused by the lag in PTE. With the accelerating land-intensive degree in Jiangsu province, the scale effect of the labor, machinery, and chemical fertilizer inputs is maximized due to adverse combination of all factors. Therefore, SE plays an important role in promoting AEE.
The quick rise of the real estate industry expropriated many agricultural lands, thus, causing a sudden drop in AEE in 2003. Since 2004, AEE has entered a new stage of rapid development driven by the series of policies issued by the Chinese government to support the agriculture. Jiangsu province positively responds to policies and arrangements to benefit farmers, by actively adjusting its agricultural structure, and by implementing relevant fiscal policies. This further helps to increase the benefits from farm operations. These actions also promote the development of modern agriculture with high yield, high efficiency, ecology, and safety.
The spatial patterns of geomean, variation coefficient, and growth type indicate that the high south and low north spatial configurations are relatively constant and cannot easily be changed. Moreover, the significantly increasing global Moran’s I value hint that the spatial clustering of AEE is intensifying. Meanwhile, the local high-high and low-low clusters become increasingly more spatially concentrated. These results suggest that the spatiotemporal evolution pattern of AEE exhibits a relatively stable spatial dependence due to limitations in geographical environmental conditions, agricultural production technology, and socioeconomic conditions.
Given the dominance of planting in the agricultural sector in Jiangsu province, the proportion of planting output over the total agricultural output was over 50% from to 1999–2018. During the planting production process, large amounts of chemical fertilizers, pesticides, agricultural films, and other direct and indirect material inputs are expended. They further consume energy and cause environmental damage through greenhouse gas emissions, soil structure deterioration, and water pollution (Xiong et al., 2020). Excessive chemical fertilizer and pesticide use has been identified as the primary sources of pollution in agricultural production (Chen and Ma, 2018). Meanwhile, the spatial difference in the reducible proportion of input factors was found to be closely related to the regional economic disparity in Jiangsu province. More specifically, Sunan has a developed economy and strong purchasing capacity for agricultural materials, embracing the intensive agricultural production mode. While the economic development of Subei and Suzhong is relatively backward, and with a large proportion of agriculture accounting for the local economy, the labor force and land resources are relatively rich in Subei and Suzhong. This causes extensive agricultural production, thus, also leading to excessive redundancy of various production factors.
Green agriculture is one of the inevitable trends of agriculture on the way to diversification and multiple functionality in the future. Agricultural eco-efficiency is an important index for measuring the green and sustainable development of agriculture. Quantitative evaluation of agricultural eco-efficiency facilitates the accurate evaluation of the true level of agricultural ecosystems, thus, elucidating the efficient utilization of agricultural resources. This study evaluates the agricultural eco-efficiency of 77 counties and districts in Jiangsu province (China) from 1999 to 2018 using the SBM-DEA model and analyzes the spatiotemporal evolution pattern and underlying loss sources of agricultural eco-efficiency.
1) The AEE, PTE, and SE generally exhibited a downward fluctuating trend from 1999 to 2018. The improvement of AEE in Jiangsu province mainly depends on the growth of SE, while PTE makes secondary contributions. Regional inequality in AEE among counties and districts tends to increase, and AEE exhibits a strong positive spatial association.
2) The AEE in Jiangsu province exhibited a “high south” and “low north” spatial pattern, with the high-level AEE regions were mainly clustered around the Taihu lake plain region in Sunan and with the low-level AEE regions clustered in the rugged hills and bordering counties and districts of Yancheng, Changzhou, Huai’an, Suqian, Xuzhou, and the Lianyungang city. Moreover, the local spatial association pattern of AEE manifested a prominent spatial locking effect. Namely, the high-high type was increasingly concentrated around the adjacent Suzhou-Wuxi-Changzhou region. The low-low type was mainly distributed in the coastal regions of Subei and Suzhong, and with the high-low and low-high type were both marginal in number and scattered all over the region. Moreover, the spatial pattern of PTE and SE demonstrated a “north high” and “south low” distribution, thus, contributing to the relatively stable evolution of spatial dependence pattern of AEE.
3) The excessive use of pesticides, chemical fertilizers, agricultural diesel, labor, land, and agricultural carbon emissions are the main factors affecting AEE in Jiangsu Province. Irrigation considerably affects AEE, while mechanical power and use of agricultural films have minimal effects. The majority of counties and districts in Subei, Suzhong, and the Ningzhen Yang Hilly region should significantly reduce their use and dependence on chemical fertilizers, pesticides, chemical fertilizers, agricultural diesel, labor, and land.
To improve the eco-efficiency of regional agricultural production, we propose relevant policy recommendations. First, the local governments should take the transformation of traditional agricultural operations towards green agricultural development as the focus of sustainable transformation development strategy. They should further create green agricultural development support systems, including the green value system, green technology system, green finance system, green policy system, and green management system. In addition, each county and district should fully exploit their regional advantages and develop agriculture with local characteristics in light of local conditions. Meanwhile, the local governments should comprehensively account for the differences in geographical location, resource endowment, and agricultural economic development level with neighboring regions, strengthen agricultural production cooperation and exchange, and establish agricultural ecological cooperation mechanisms and agricultural ecological policy linkage mechanisms with neighboring regions.
Second, several steps are required to reduce redundancies in the current input factors. Namely, is necessary to promote the transformation of agricultural operations from the high investment extensive type to the intensive ecological type, to accelerate the upgrading of the agricultural technical level, to improve the allocation efficiency of agricultural production factors, and to strengthen the ecological management performance of regional farming systems. Meanwhile, to ensure the sustainability of agricultural production and growth, it is also necessary to implement an innovation-driven growth strategy, introduce modern production factors (such as improved seeds, machinery and equipment, farming technology, etc.) to increase the input of environment-friendly factors, to improve the socialization of agricultural services, to deepen the specialization of agriculture, and optimize the planting structure.
Third, it is necessary to strengthen farmers’ education and training and adopt incentive policies to encourage them to reduce their dependence on fertilizers and pesticides. Moreover, the local governments should promote the restructuring of the agricultural industry and improve the absorption capacity of township enterprises by integrating the rural surplus labor force. It is also necessary to improve agricultural land utilization efficiency and agricultural total factor productivity by relying on the popularity of agricultural industrialization and mechanization.
This study has some limitations to report. First, many input and output indicators are unavailable due to the restriction of county data availability and the lack of a uniform evaluation standard for AEE. Hence, the AEE calculated herein may suffer from unknown uncertainties. Moreover, the analysis of influencing factors of AEE is based on input-output redundancy rate, without taking into account other socioeconomic and natural variables, such as urbanization rate, the fragmentation degree of cultivated land, terrain, and marketization degree. Future studies can introduce a spatial econometric model to identify their impact on AEE. In addition, the factors influencing both PTE and SE can be further explored to identify the impediment factors of AEE by using the spatial econometric model.
The raw data supporting the conclusions of this article will be made available by the authors, without undue reservation.
Conceptualization, ZL and TJ; methodology, ZL and SS; formal analysis, ZL and TJ; writing—original draft preparation, ZL and TJ; writing—review and editing, SS; supervision, ZL and SS. All authors have read and agreed to the published version of the manuscript.
This research was funded by Humanities and Social Sciences Youth Foundation, Ministry of Education of the People’s Republic of China, grant number 20YJCZH080, Social Science Foundation of Jiangsu Province, grant number 20SHD009, the Yangzhou University Qing Lan Project, and the Yangzhou Lv Yang Jinfeng Project in 2020, the Key Research and Development Plan of Jiangsu Province, grant number BE2018355, and Major Project of CAE and Local Cooperation Consultation Research, grant number JS2019ZD01.
The authors declare that the research was conducted in the absence of any commercial or financial relationships that could be construed as a potential conflict of interest.
All claims expressed in this article are solely those of the authors and do not necessarily represent those of their affiliated organizations, or those of the publisher, the editors and the reviewers. Any product that may be evaluated in this article, or claim that may be made by its manufacturer, is not guaranteed or endorsed by the publisher.
Anselin, L. (1995). Local Indicators of Spatial Association-LISA. Geogr. Anal. 27 (2), 93–115. doi:10.1111/j.1538-4632.1995.tb00338.x
Anselin, L. (2001). Spatial Effects in Econometric Practice in Environmental and Resource Economics. Am. J. Agric. Econ. 83 (3), 705–710. doi:10.1111/0002-9092.00194
Barnes, A. P., and Thomson, S. G. (2014). Measuring Progress Towards Sustainable Intensification: How Far Can Secondary Data Go? Ecol. Indicators 36, 213–220. doi:10.1016/j.ecolind.2013.07.001
Bonfiglio, A., Arzeni, A., and Bodini, A. (2017). Assessing Eco-Efficiency of Arable Farms in Rural Areas. Agric. Syst. 151, 114–125. doi:10.1016/j.agsy.2016.11.008
Caiado, R. G. G., de Freitas Dias, R., Mattos, L. V., Quelhas, O. L. G., and Leal Filho, W. (2017). Towards Sustainable Development Through the Perspective of Eco-Efficiency - A Systematic Literature Review. J. Clean. Prod. 165, 890–904. doi:10.1016/j.jclepro.2017.07.166
Chen, C.-M. (2014). Evaluating Eco-Efficiency with Data Envelopment Analysis: An Analytical Reexamination. Ann. Oper. Res. 214, 49–71. doi:10.1007/s10479-013-1488-z
Chen, J., and Ma, G. S. (2018). Study on Environmental Pollution and Control Countermeasures of Agricultural and Rural Areas in Jiangsu Province. Adv. Eng. Res. 170, 1599–1603. doi:10.2991/iceep-18.2018.288
Cheng, G. (2014). Data Envelopment Analysis: Methods and MaxDEA Software. Beijing: Intellectual Property Publishing House Co. Ltd.
Coluccia, B., Valente, D., Fusco, G., De Leo, F., and Porrini, D. (2020). Assessing Agricultural Eco-Efficiency in Italian Regions. Ecol. Indicators 116, 106483. doi:10.1016/j.ecolind.2020.106483
Czyżewski, B., Matuszczak, A., Grzelak, A., Guth, M., and Majchrzak, A. (2021). Environmental Sustainable Value in Agriculture Revisited: How Does Common Agricultural Policy Contribute to Eco-Efficiency? Sustain. Sci. 16, 137–152. doi:10.1007/s11625-020-00834-6
Du, H. Z. (2010). The Research on Countermeasures of green Agricultural Development in Jiangsu Province. Asian Agric. Res. 2, 31–37. doi:10.22004/ag.econ.93645
Fan, Q., Yang, S., and Liu, S. (2019). Asymmetrically Spatial Effects of Urban Scale and Agglomeration on Haze Pollution in China. Ijerph 16 (24), 4936. doi:10.3390/ijerph16244936
Gancone, A., Pubule, J., Rosa, M., and Blumberga, D. (2017). Evaluation of Agriculture Eco-Efficiency in Latvia. Energ. Proced. 128, 309–315. doi:10.1016/j.egypro.2017.08.318
Georgopoulou, A., Angelis-Dimakis, A., Arampatzis, G., and Assimacopoulos, D. (2015). Improving the Eco-Efficiency of an Agricultural Water Use System. Desalination Water Treat. 57 (25), 11484–11493. doi:10.1080/19443994.2015.1058727
Gołaś, M., Sulewski, P., Wąs, A., Kłoczko-Gajewska, A., and Pogodzińska, K. (2020). On the Way to Sustainable Agriculture-Eco-Efficiency of Polish Commercial Farms. Agriculture 10 (10), 438. doi:10.3390/agriculture10100438
Guan, W., and Xu, S. (2016). Study of Spatial Patterns and Spatial Effects of Energy Eco-Efficiency in China. J. Geogr. Sci. 26 (9), 1362–1376. doi:10.1007/s11442-016-1332-x
Guo, J., Hu, X., Gao, L., Xie, K., Ling, N., Shen, Q., et al. (2017). The Rice Production Practices of High Yield and High Nitrogen Use Efficiency in Jiangsu, China. Sci. Rep. 7, 2101. doi:10.1038/s41598-017-02338-3
Guo, L., Na, S., Tan, X., Gui, P., and Liu, C. (2020). Evolution of the Efficiency of Nationwide Commercial Banks in China Based on an SBM-Undesirable Model and DEA Window Analysis. Math. Probl. Eng. 2020, 1–12. doi:10.1155/2020/4682790
Hu, L.-x., Zhang, X.-h., and Zhou, Y.-h. (2019). Farm Size and Fertilizer Sustainable Use: An Empirical Study in Jiangsu, China. J. Integr. Agric. 18 (12), 2898–2909. doi:10.1016/s2095-3119(19)62732-2
Huang, J., Xia, J., Yu, Y., and Zhang, N. (2018). Composite Eco-Efficiency Indicators for China Based on Data Envelopment Analysis. Ecol. Indicators 85, 674–697. doi:10.1016/j.ecolind.2017.10.040
Huang, J., Xiong, R., Fang, L., Li, T., and Shen, W. (2020). Estimation of Interannual Trends of Ammonia Emissions from Agriculture in Jiangsu Province from 2000 to 2017. Atmos. Oceanic Sci. Lett. 13 (3), 268–273. doi:10.1080/16742834.2020.1736499
Huang, J., Yang, X., Cheng, G., and Wang, S. (2014). A Comprehensive Eco-Efficiency Model and Dynamics of Regional Eco-Efficiency in China. J. Clean. Prod. 67, 228–238. doi:10.1016/j.jclepro.2013.12.003
Huang, S. S., Liao, Q. L., Hua, M., Wu, X. M., Bi, K. S., Yan, C. Y., et al. (2007). Survey of Heavy Metal Pollution and Assessment of Agricultural Soil in Yangzhong District, Jiangsu Province, China. Chemosphere 67 (11), 2148–2155. doi:10.1016/j.chemosphere.2006.12.043
Keating, B. A., Carberry, P. S., Bindraban, P. S., Asseng, S., Meinke, H., and Dixon, J. (2010). Eco-efficient Agriculture: Concepts, Challenges, and Opportunities. Crop Sci. 50, S-109. doi:10.2135/cropsci2009.10.0594
Kim, T., and Dall’erba, S. (2014). Spatio-temporal Association of Fossil Fuel CO2 Emissions from Crop Production Across US Counties. Agric. Ecosyst. Environ. 183, 69–77. doi:10.1016/j.agee.2013.10.019
Kuosmanen, T. (2005). Measurement and Analysis of Eco-Efficiency: An Economist's Perspective. J. Ind. Ecol. 9 (4), 15–18. doi:10.1162/108819805775248025
Lee, T., Yeo, G.-T., and Thai, V. V. (2014). Environmental Efficiency Analysis of Port Cities: Slacks-Based Measure Data Envelopment Analysis Approach. Transport Policy 33, 82–88. doi:10.1016/j.tranpol.2014.02.009
Lei, M., Yin, Z., Yu, X., and Deng, S. (2017). Carbon-weighted Economic Development Performance and Driving Force Analysis: Evidence from China. Energy Policy 111, 179–192. doi:10.1016/j.enpol.2017.09.016
Liao, J., Yu, C., Feng, Z., Zhao, H., Wu, K., and Ma, X. (2021). Spatial Differentiation Characteristics and Driving Factors of Agricultural Eco-Efficiency in Chinese Provinces from the Perspective of Ecosystem Services. J. Clean. Prod. 288, 125466. doi:10.1016/j.jclepro.2020.125466
Linh Le, T., Lee, P.-P., Chung Peng, K., and H. Chung, R. (2019). Evaluation of Total Factor Productivity and Environmental Efficiency of Agriculture in Nine East Asian Countries. Agric. Econ. - Czech 65, 249–258. doi:10.17221/50/2018-agricecon
Liu, C., Gao, M., Zhu, G., Zhang, C., Zhang, P., Chen, J., et al. (2021). Data Driven Eco-Efficiency Evaluation and Optimization in Industrial Production. Energy 224, 120170. doi:10.1016/j.energy.2021.120170
Liu, Q. P., Giesy, J. P., and Li, Z. H. (2014). Spatio-temporal Distributions and Environmental Safety Threshold of Cropland Fertilization of Jiangsu Province, China. Amr 962-965, 2110–2115. doi:10.4028/www.scientific.net/amr.962-965.2110
Liu, Y., Zou, L., and Wang, Y. (2020). Spatial-temporal Characteristics and Influencing Factors of Agricultural Eco-Efficiency in China in Recent 40 Years. Land Use Policy 97, 104794. doi:10.1016/j.landusepol.2020.104794
Pang, J., Chen, X., Zhang, Z., and Li, H. (2016). Measuring Eco-Efficiency of Agriculture in China. Sustainability 8 (4), 398. doi:10.3390/su8040398
Peng, B., Wang, Y., and Wei, G. (2020). Energy Eco-Efficiency: Is There Any Spatial Correlation Between Different Regions? Energy Policy 140, 111404. doi:10.1016/j.enpol.2020.111404
Peng, H., Zhang, J., Lu, L., Tang, G., Yan, B., Xiao, X., et al. (2017). Eco-efficiency and its Determinants at a Tourism Destination: A Case Study of Huangshan National Park, China. Tourism Manag. 60, 201–211. doi:10.1016/j.tourman.2016.12.005
Picazo-Tadeo, A. J., Gómez-Limón, J. A., and Reig-Martínez, E. (2011). Assessing Farming Eco-Efficiency: A Data Envelopment Analysis Approach. J. Environ. Manage. 92, 1154–1164. doi:10.1016/j.jenvman.2010.11.025
Pretty, J. (2008). Agricultural Sustainability: Concepts, Principles and Evidence. Phil. Trans. R. Soc. B 363 (1491), 447–465. doi:10.1098/rstb.2007.2163
Ren, H., Shang, Y., and Zhang, S. (2020). Measuring the Spatiotemporal Variations of Vegetation Net Primary Productivity in Inner Mongolia Using Spatial Autocorrelation. Ecol. Indicators 112, 106108. doi:10.1016/j.ecolind.2020.106108
Rosano-Peña, C., Almeida, C., Rodrigues, E., and Serrano, A. (2020). Spatial Dependency of Eco-Efficiency of Agriculture in São Paulo. Bbr 17, 328–343. doi:10.15728/bbr.2020.17.3.5
Shao, L., Yu, X., and Feng, C. (2019). Evaluating the Eco-Efficiency of China's Industrial Sectors: A Two-Stage Network Data Envelopment Analysis. J. Environ. Manage. 247 (1), 551–560. doi:10.1016/j.jenvman.2019.06.099
Stępień, S., Czyżewski, B., Sapa, A., Borychowski, M., Poczta, W., and Poczta-Wajda, A. (2021). Eco-efficiency of Small-Scale Farming in Poland and its Institutional Drivers. J. Clean. Prod. 279, 123721. doi:10.1016/j.jclepro.2020.123721
Suzigan, L. H., Peña, C. R., and Guarnieri, P. (2020). Eco-efficiency Assessment in Agriculture: A Literature Review Focused on Methods and Indicators. J. Agric. Sci. 9 (11), 99–111. doi:10.5539/jas.v12n7p118
Tian, Y., Zhang, J.-b., and He, Y.-y. (2014). Research on Spatial-Temporal Characteristics and Driving Factor of Agricultural Carbon Emissions in China. J. Integr. Agric. 13 (6), 1393–1403. doi:10.1016/s2095-3119(13)60624-3
Tobler, W. R. (1970). A Computer Movie Simulating Urban Growth in the Detroit Region. Econ. Geogr. 46, 234–240. doi:10.2307/143141
Tone, K. (2001). A Slacks-Based Measure of Efficiency in Data Envelopment Analysis. Eur. J. Oper. Res. 130 (3), 498–509. doi:10.1016/S0377-2217(99)00407-5
Tone, K. (2004). Dealing with Undesirable Outputs in DEA: A Slacks-Based Measure (SBM) Approach. Toronto, ON, Canada: North American Productivity Workshop.
Victor, M., Margarita, R., and Pedro, M. (2018). Economic-environmental Efficiency of European Agriculture - A Generalized Maximum Entropy Approach. Agric. Econ. - Czech 64 (10), 423–435. doi:10.17221/45/2017-agricecon
Wang, Z., Sun, Y., Yuan, Z., and Wang, B. (2019). Does Energy Efficiency Have A Spatial Spill-Over Effect in China? Evidence from Provincial-Level Data. J. Clean. Prod. 241, 118258. doi:10.1016/j.jclepro.2019.118258
Wu, C., Chen, B., Huang, X., and Dennis Wei, Y. H. (2020). Effect of Land-Use Change and Optimization on the Ecosystem Service Values of Jiangsu Province, China. Ecol. Indicators 117, 106507. doi:10.1016/j.ecolind.2020.106507
Xiang, H., Wang, Y. H., Huang, Q. Q., and Yang, Q. Y. (2020). How Much Is the Eco-Efficiency of Agricultural Production in West China? Evidence from the Village Level Data. Ijerph 17, 4049. doi:10.3390/ijerph17114049
Xing, Z., Wang, J., and Zhang, J. (2018). Expansion of Environmental Impact Assessment for Eco-Efficiency Evaluation of China's Economic Sectors: An Economic Input-Output Based Frontier Approach. Sci. Total Environ. 635, 284–293. doi:10.1016/j.scitotenv.2018.04.076
Xiong, C., Chen, S., and Xu, L. (2020). Driving Factors Analysis of Agricultural Carbon Emissions Based on Extended STIRPAT Model of Jiangsu Province, China. Growth and Change 51 (3), 1401–1416. doi:10.1111/grow.12384
Xiong, C., Yang, D., and Huo, J. (2016). Spatial-temporal Characteristics and LMDI-Based Impact Factor Decomposition of Agricultural Carbon Emissions in Hotan Prefecture, China. Sustainability 8 (3), 262. doi:10.3390/su8030262
Xu, K., Bossink, B., and Chen, Q. (2019). Efficiency Evaluation of Regional Sustainable Innovation in China: A Slack-Based Measure (SBM) Model with Undesirable Outputs. Sustainability 12 (1), 31. doi:10.3390/su12010031
Xu, Y. L., Li, Z. J., and Wang, L. (2020). Temporal-Spatial Differences in And Influencing Factors Of Agricultural Eco-Efficiency in Shandong Province, China. Ciência Rural 50, e20190818. doi:10.1590/0103-8478cr20190818
Yang, B., Wang, Z., Zou, L., Zou, L., and Zhang, H. (2021). Exploring the Eco-Efficiency of Cultivated Land Utilization and its Influencing Factors in China's Yangtze River Economic Belt, 2001-2018. J. Environ. Manage. 294, 112939. doi:10.1016/j.jenvman.2021.112939
Yanlin, X., Zijun, L., and Liang, W. (2020). Temporal-spatial Differences in and Influencing Factors of Agricultural Eco-Efficiency in Shandong Province, China. Cienc. Rural 50 (7), e20190818. doi:10.1590/0103-8478cr20190818
Yu, Y., Zhang, Y., and Miao, X. (2018). Impacts of Dynamic Agglomeration Externalities on Eco-Efficiency: Empirical Evidence from China. Ijerph 15 (10), 2304. doi:10.3390/ijerph15102304
Zhang, X., Wu, M., Yao, H., Yang, Y., Cui, M., Tu, Z., et al. (2016). Pesticide Poisoning and Neurobehavioral Function Among Farm Workers in Jiangsu, People's Republic of China. Cortex 74, 396–404. doi:10.1016/j.cortex.2015.09.006
Zhou, L., and Zhu, S. (2017). Research on the Efficiency of Chinese Commercial banks Based on Undesirable Output and Super-SBM DEA Model. Jmf 07 (1), 102–120. doi:10.4236/jmf.2017.71006
Zhou, Y., Kong, Y., and Zhang, T. (2019). The Spatial and Temporal Evolution of Provincial Eco-Efficiency in China Based on SBM Modified Three-Stage Data Envelopment Analysis. Environ. Sci. Pollut. Res. Int. 27, 8557–8569. doi:10.1007/s11356-019-07515-7
Zhu, A. X., Lu, G., Liu, J., Qin, C. Z., and Zhou, C. (2018). Spatial Prediction Based on Third Law of Geography. Ann. GIS 24 (4), 225–240. doi:10.1080/19475683.2018.1534890
Keywords: SBM-DEA model, improvement potential, Jiangsu province, agricultural eco-efficiency, spatial perspective
Citation: Li Z, Sarwar S and Jin T (2021) Spatiotemporal Evolution and Improvement Potential of Agricultural Eco-efficiency in Jiangsu Province. Front. Energy Res. 9:746405. doi: 10.3389/fenrg.2021.746405
Received: 23 July 2021; Accepted: 09 August 2021;
Published: 20 August 2021.
Edited by:
Avik Sinha, Goa Institute of Management, IndiaReviewed by:
Muhammad Ibrahim Shah, BRAC University, BangladeshCopyright © 2021 Li, Sarwar and Jin. This is an open-access article distributed under the terms of the Creative Commons Attribution License (CC BY). The use, distribution or reproduction in other forums is permitted, provided the original author(s) and the copyright owner(s) are credited and that the original publication in this journal is cited, in accordance with accepted academic practice. No use, distribution or reproduction is permitted which does not comply with these terms.
*Correspondence: Tao Jin, dGppbkB5enUuZWR1LmNu
Disclaimer: All claims expressed in this article are solely those of the authors and do not necessarily represent those of their affiliated organizations, or those of the publisher, the editors and the reviewers. Any product that may be evaluated in this article or claim that may be made by its manufacturer is not guaranteed or endorsed by the publisher.
Research integrity at Frontiers
Learn more about the work of our research integrity team to safeguard the quality of each article we publish.